


Servicios Personalizados
Articulo
 Inglés (pdf)
 Articulo en XML
 Referencias del artículo
Indicadores

Links relacionados
-
 Citado por Google
 -
 Similares en Google
Compartir

 Permalink
South African Journal of Enology and Viticulture
versión On-line ISSN 2224-7904
versión impresa ISSN 0253-939X
S. Afr. J. Enol. Vitic. vol.44 no.2 Stellenbosch 2023
http://dx.doi.org/10.21548/44-2-5913
ARTICLES
Detection and Quantification of Grapevine Bunch Rot Using Functional Data Analysis and Canonical Variate Analysis Biplots of Infrared Spectral Data
Cornelissen R.J.I, IV; Le Roux N.J.II; Gardner-Lubbe S.II; Aleixandre Tudo J.L.III, V; Nieuwoudt H.HI, *
ISouth African Grape and Wine Research Institute (SAGWRI), Stellenbosch University, Private Bag X1, Matieland, 7602, South Africa
IICentre for Multi-Dimensional Data Visualisation (MuViSU), Department Statistics and Actuarial Science, Stellenbosch University, Private Bag X1, Matieland, 7602, South Africa
IIIDepartment of Viticulture and Oenology, Stellenbosch University, Private Bag X1, Matieland, 7602, South Africa
IVNamaqua Wines, P.O. Box 75, Vredendal, 8160, South Africa
VInstituto de Ingeniería de Alimento para el Desarrollo (IIAD), Departamento de Tecnología de Alimentos (DTA), Unversitat Politecnica de Valencia (UPV), Valencia, Spain
ABSTRACT
Grapevine bunch rot assessment has economic significance to wineries. Industrial working conditions require rapid assessment methods to meet the time constraints typically associated with grape intake at large wineries. Naturally rot-affected and healthy white wine grape bunches were collected over five vintages (2013 to 2016, 2020). Spectral data of 382 grape must samples were acquired using three different, but same-type attenuated total reflection mid-infrared (ATR-MIR) ALPHA spectrometers. The practical industrial problem of wavenumber shifts collected with different spectrometers was overcome by applying functional data analysis (FDA). FDA improved the data quality and boosted data mining efforts in the sample set. Canonical variate analysis (CVA) biplots were employed to visualise the detection and quantification of rot. When adding 90 % alpha-bags to CVA biplots minimal overlap between rot-affected (Yes) and healthy (No) samples was observed. Several bands were observed in the region 1734 cm-1 to 1722 cm-1 which correlated with the separation between rot-affected and healthy grape musts. These bands connect to the C=O stretching of the functional groups of carboxylic acids. In addition, wavenumber 1041 cm-1, presenting the functional group of ethanol, contributed to the separation between categories (severity % range). ATR-MIR could provide a sustainable alternative for rapid and automated rot assessment. However, qualitative severity quantification of rot was limited to only discriminating between healthy and severe rot (> 40 %). This study is novel in applying FDA to correct wavenumber shifts in ATR-MIR spectral data. Furthermore, visualisation of the viticultural data set using CVA biplots is a novel application of this technique.
Keywords: grapevine bunch rot, detection, quantification, ATR-MIR, data mining, data visualisation, canonical variate analysis biplot, functional data analysis, spline modelling
INTRODUCTION
Detrimental grapevine bunch rots, specifically botrytis rot and sour rot, have significant economic impact on wine production (Bois et al., 2017; Madden et al., 2017; Crandall et al., 2022). Rot leads to a reduced volume of pre-fermentative juice and thus a reduced final wine yield (Barata et al. 2011), as well as processing difficulties such as stuck fermentations and wine filtration problems (Hausinger et al., 2014; Osborne, 2014; Jadhav and Gupta, 2016). However, the major detrimental effects of botrytis and sour rots on wine quality primarily relate to the impact on the sensory properties of grape juice and wine (Steel et al., 2013; González-Barreiro et al., 2015; Gelhken et al., 2022; Li et al., 2022; Santos et al., 2022). Due to the detrimental effect of rot on wine quality, wineries incorporate rot assessment into grape quality evaluation (AGW, 2022).
Disease assessment can be divided into identification, detection, and quantification objectives (Bock et al., 2022a). The focus of the present study is on bunch rot detection and quantification. Plant disease detection aims to reveal a disease's presence, while disease quantification seeks explicitly to indicate the amount or intensity of a disease in a target population (Nutter et al., 1991). Plant disease intensity is predominantly described by the term severity, which is defined as the visible symptomatic area of the sampling unit affected by the disease, expressed as a percentage or proportion of the total area (Nutter et al., 1991). Severity, or percentage rot, has a clear effect on wine composition (Barata et al., 2011). Severity is often used at wineries to enforce price penalties if rot intensity exceeds a certain threshold (Hill et al., 2013). Recently the approach for the detection of grapevine bunch rot has been centred on detecting the increased concentrations of rot-associated disease markers (Porep et al., 2015; Steel et al., 2018; Gelhken et al., 2022), and discriminating between rot-affected and healthy grapes (Giovenzana et al., 2018).
Although visual estimations are known to be vulnerable to assessor error, it still is the reference method used in modern-day disease assessment (Bock et al., 2022b). However, subjectivity associated with visual estimation of rot is a source of contention between grape growers and wineries. Sensor-based technology and image analysis are employed to increase the reliability of grapevine bunch rot measurements (Hill et al., 2014; Bock et al., 2022b). Spectroscopy features strongly in these alternative methods of assessing rot.
There are several reasons why methods for faster and more sustainable quality control (QC) are turning to spectroscopy. Key advantages of vibrational-based methodologies such as spectroscopy that relate well to industrial applications include rapid and simultaneous measurement of several parameters and being environmentally friendly (Caramês et al., 2017; Okere et al., 2021; Hassoun et al., 2023). It is primarily the mid-infrared (MIR) region (4000 to 400 cm-1) that has proven potential for analysis of the compositional features of grape must (reviewed by dos Santos et al., 2017). The specific sampling technique of attenuated total reflectance mid-infrared (ATR-MIR) spectroscopy is valuable for quantitative and qualitative food analysis (reviewed by Mendes and Duarte, 2021). Under industrial working conditions, the ATR sampling technique is hugely beneficial because no or minimal sample preparation is required in analysis (Gambetta et al., 2019). This reduces the need for additional labour and time of sample pre-processing, thus increasing the speed of analysis. Even though ATR is the most widely used MIR sampling module in food analysis (Mendes and Duarte, 2021), studies on using this sampling mode specifically for grape analysis are not plentiful. Furthermore, the investigation of Schmidtke et al. (2019) is the only published study in which ATR-MIR was specifically explored in rot assessment.
Along with spectroscopic methods, large volumes and a variety of data, referred to as big data, are generated (Simsek et al., 2019). Infrared spectroscopic data is an example of high-dimensional big data, i.e., data where the number of variables (predictors) is large compared to the number of observations (Petrovic et al., 2019). Information must be extracted from these big datasets using case-specific data mining techniques, such as computer-based statistical models or algorithms (Ropodi et al, 2016; Szymañska, 2018).
Efficient data visualisation is critical in analysing big datasets (Szymañska, 2018; Rodwell et al, 2021; Kim & Kim, 2022). A score scatter plot is traditionally used to visually represents the relationship between two variables using two orthogonal axes. On the other hand, a biplot can be seen as an extension of the score plot to accommodate p variables by introducing p axes which can assume any orientation (Gower & Hand, 1996). In routine application, the main advantage of biplot methodology is that high-dimensional data like spectra are projected in such a way that the information can be visualised by a human operator and interpreted by non-statisticians.
Two examples of biplot variations used for the visualisation of multivariate data include principal component analysis (PCA) and canonical variate analysis (CVA) (Alkan et al., 2015; Rodwell et al, 2021). Principal component analysis (PCA) is most often used for initial data exploration by visualising outliers, groupings, or trends (Callao & Ruisánchez, 2018; Arslan et al, 2021). CVA biplots are used in discriminant analysis (DA) methods, and the DA results are visually displayed compared to merely reporting discriminant functions (Gardner & Le Roux, 2005). The multivariate visualisation technique of CVA biplots provides a visual interpretation of the similarities or differences between observations according to the variables, as well as the degree of overlap between classes (Le Roux & Gardner, 2005; Gower et al., 2011). The applications of CVA biplots on multivariate data were previously explored in the disciplines of archaeology (Wurz et al., 2003), process control of metallurgical plants (Aldrich et al., 2004), and meteorology (Alkan et al., 2015). However, the application of CVA biplots on a viticultural data set has not been investigated before.
Without a doubt, data artefacts could hinder the mining of spectral data and lead to low data utility and prevent routine applications. Wavenumber shifts, which could occur due to the difference in internal settings of spectrometers, are an examples of data artefacts encountered (Szymañska, 2018). The following paragraph addresses the misalignment in spectral data with functional data analysis (FDA).
Mid-infrared spectra are typically plotted as a function of wavenumbers (Fig. 1), resulting in a curve of continuous measurements following a sequence. With traditional methods such as PCA and partial least squares (PLS) regression, spectra are considered as a set of points where the way they are ordered has no influence on the results. In contrast to this approach, FDA assumes that a continuous function of intensity (absorbance units) is observed as a discreet set of wavenumbers, representing a "smooth" data-generating process (Ramsay & Silverman, 1997). Smoothing is the first step in FDA, with the purpose of converting raw discrete data points into a smoothly varying function (Ullah & Finch, 2013). Typically, smoothing splines are used to estimate the underlying continuous function (Saeys et al., 2008). Spline modelling is an established tool in statistical regression analysis to reproduce flexible shapes mathematically (Perperoglou et al., 2019). The original definition of "splines" refers to draftsmen's strips used for drawing curves. The spline would be fixed at specific points, called knots, for the strip of material to form a smooth curve between the knots (Wright & London, 2009). Low-order polynomials are chosen to fit the data, or in other words, draw the curve between two points on a scatter plot. The polynomials have different degrees of freedom relating to the complexity of the model; for example, a one-degree polynomial corresponds to a straight line and simple linear regression (Wright & London, 2009). Smoothing splines also have a regularisation parameter that determines the amount of smoothing.
This study aimed to explore the potential use of ATR-MIR spectroscopy to detect and quantify grapevine bunch rot using biplot methodology.
MATERIALS AND METHODS
Sample collection from commercial vineyards
In-vineyard grape bunch samples (n = 382), each consisting of ten single cultivar bunches, were collected over five vintages (2013 to 2016, 2020) from commercial vineyards situated in the Olifants River and Cape Coastal Wine of Origin regions, Western Cape, South Africa. A producer winery's three viticulturists selected and categorised the samples as rot-affected or healthy based on the presence or absence of symptoms associated with botrytis and sour rots (Cornelissen et al., 2022). The viticulturists also assessed the samples' severity (%) as Hill et al. (2010) described: S = ΣSi/n, where Si = severity for the ith bunch and n = the total number of bunches assessed. Samples were collected from the white wine grape cultivars Chenin blanc (SN), Colombar (CO), Sauvignon blanc (SB), Chardonnay (CY) and Hanepoot (Muscat d' Alexandrie) (HP). The cultivars Fernäo Pires, Harslevelü, Nouvelle, Sémillon, Verdelho, Viognier and White Muscadel (Muscat de Frontignan) were also included, although with low representation (Table 1). According to the modified Eichhorn-Lorenz (E-L) grape berry growth stages system (Coombe, 1995), samples were collected in any of the following berry growth stages: Stage 36 (intermediate sugar levels) to 38 (berries harvest-ripe).
ATR-MIR spectra acquisition of grape must samples
Upon collection, grape bunch samples were placed in plastic bags, kept below 20°C and immediately transported to the on-site winery laboratory for analysis. Samples (consisting of 10 bunches each) were pressed by hand to extract the fresh grape must (± 300 mL) and decanted from the skins and seeds to be used for spectroscopic analysis without further pre-processing. Must aliquots (1 mL) were scanned on a MIR ALPHA spectrometer (Bruker Optics GmbH, Ettlingen, Germany) fitted with a diamond ATR single reflection sample module. Air, used as reference background spectra, was scanned hourly during analyses using the same method described for the grape musts. Each sample was scanned in 30 seconds on the diamond crystal heated to 40°C, at a resolution of 8 cm-1 in the wavenumber region 6996 to 373 cm-1. The average spectrum of 64 repeat scans per sample was recorded with OPUS spectroscopy software (www.optikinstruments.eu). The ATR cell was cleaned with distilled water between samples and dried with disposable wipes to avoid sample carryover. An instrument-specific Performance Qualification (PQ) test was used for daily validation of the performance of the spectrometer (ALPHA user manual, 2014).
Data treatment and analysis
Alignment of spectral data with functional data analysis (FDA)
Three different same-type spectrometers were used throughout the period of sample collection and spectral acquisition. The exact scanning wavenumber ranges of the spectrometers were not identical due to the spectrometers' unique internal settings and laser configurations. Either 1 607, 2 309 or 2 338 datapoints were created per spectrum, depending on the internal settings of each spectrometer. Exploring the spectral data in instrument-independent software required wavenumber alignment of the complete spectral data set (6996 to 373 cm-1), which was achieved using FDA. A brief introduction on FDA was given in the Introduction section.
In the present study, the smoothing approach encompassed a three-degree polynomial cubic regression, yi = ß0 + ßlxi + ß2xi2 + ß3xi3 with 500 knots and smoothing parameter = 0. The aim was to interpolate the intensity (absorbance units) between the observed wavenumbers (Fig. 2A). The "Spline" package in R, Version 3.6.1 (The R Foundation for Statistical Computing, 2019) was used.
Each of the three spectrometers' grape must spectral data were fitted in this way to form a new regular grid of aligned wavenumbers. One thousand evenly spaced points in the region 2600 to 900 cm-1 were chosen as predictor variables based on this region's prominent published molecular information regarding grape must chemical composition (Shah et al., 2010; Petrovic et al., 2020).
Detection and severity quantification of grapevine bunch rot
Each sample was descriptively categorised for the detection of rot as "Yes", indicating the presence of rot, or "No", if the sample did not show any visual rot symptoms. Furthermore, a third class of samples with unknown grape rot status, where no visual assessment was carried out on these samples, was categorised as "Yes/No". In total, the sample set consisted of 222 "Yes", 48 "No", and 112 "Yes/No" samples (Table 1).
For the quantification of rot intensity, each of the "Yes" and "No" samples were also assigned to either of five categories based on their visually estimated severity (%) (Table 1). The five categories (severity % range) were established by the researcher using empirical experience regarding the maximum severity encountered under local conditions, published rot severity threshold levels before detrimental effects on wine quality were observed (Ky et al., 2012), and in-vineyard reported severities (Meneguzzo et al., 2008, Evans et al., 2010; Pañitrur et al., 2018; Schueuermann et al., 2019; Würz et al., 2020).
Multivariate data analysis (MVDA)
Principal component analysis (PCA), described by Naes et al. (2004) and Cozzolino et al. (2012), was used to explore the underlying group structure in the dataset and to detect outlying or extreme samples. Raw spectra were mean centered, and Hotelling's T2 (95 %) was used to identify unusually positioned samples (SIMCA MVDA software, Version 16, Sartorius Stedim Data Analytics AB, Umeå, Sweden).
Canonical variate analysis (CVA) biplots
Weighted canonical variate analysis (CVA) was used to evaluate the separation between the five pre-decided categories (severity % range). The aim of CVA is to obtain optimal separation between classes and relies on Mahalanobis distances to define interclass distance or differences between class means (Gardner & Le Roux, 2005; Gardner-Lubbe et al., 2008; Gower et al., 2015). The results are reported as CVA biplots (R function of Package "UBbiplot", available on a website featuring R code and datasets in Understanding biplots, Gower et al., 2011). Biplots are not primarily a method of analysis, but rather a way of visualising the data (Gower et al., 2015). CVA biplots provide a method to visualise the differences between the means of K groups in a reduced number of dimensions. A two-dimensional representation of the data is given with non-orthogonal axes. Alpha-bags (Le Roux & Gardner, 2005) were superimposed on the CVA biplots as a quantitative measure to describe how well categories are separated, as well as the degree of overlap.
The challenges related to CVA modelling in the present study were that with only a small number of samples, the number of predictor variables totalling 1 000 is much larger than the number of samples. Furthermore, since the spectra follow a smooth curve, the variables are highly correlated, especially variables associated with wavenumbers close together. The collinearity problem of variables is a fundamental problem in spectroscopy, with many strongly related measurable variables (Naes et al., 2004), which makes overfitting a problem. CVA cannot deal with multi-collinear data (Khakimov et al., 2015), thus, dimension reduction was needed.
Dimensionality reduction was done by mathematically selecting a subset of the most relevant variables out of the 1 000 equally spaced wavenumbers obtained with FDA, based on the ideas of Tuv et al. (2006). A final subset of 38 wavenumbers was selected for DA of the three pre-classed rot categories ("Yes", "No" and "Yes/No").
A second round of variable selection was executed on the 1 000 wavenumbers for DA on five pre-decided severity categories (severity % range). The best subset of seven wavenumbers was selected. The package "randomForest" in R Language for Statistical Computing, Version 3.6.1 (The R Foundation for Statistical Computing, 2019), was used for both rounds of variable selection.
RESULTS AND DISCUSSION
Alignment of spectral data with FDA
The spectral wavenumbers or variables of the three ALPHA spectrometers used were misaligned due to differences in the internal settings of these instruments, and pre-processing of data was thus required. Accurate wavenumber alignment was obtained by using a grid consisting of evenly spaced wavenumbers, as illustrated by the example of a grid of wavenumbers for two spectrometers in Figure 2A. The solid lines indicate the interpolated intensity curves. In the intensely zoomed representation, deviations are present between the solid lines and the observed values (indicated by the blue and orange o). However, these deviations are insignificant in practice while ensuring a smooth curve. As shown in Figure 2A, the vertical dotted lines of wavenumbers for the two spectrometers are not aligned. To construct a single dataset for observations from the instruments, a new aligned grid was chosen for each spectrometer. This new aligned grid of each of the spectrometers is indicated by the black square (■) at the end of the black dotted lines (Fig. 2B).
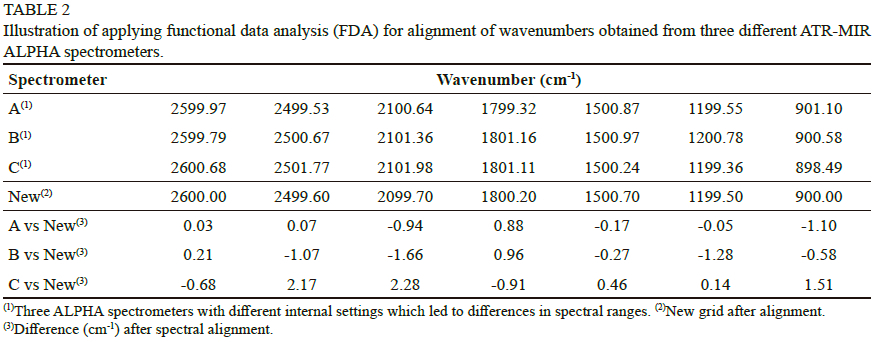
Each of the three ALPHA spectrometers used in the study had its own regular grid of wavenumbers. For alignment of wavenumbers, a new grid was to be modelled using the same principle illustrated in Figures 2A and 2B. This new grid was chosen as 1 000 equally spaced points in the interested MIR region of 2600 to 900 cm-1. From Table 2, it is evident that the magnitude of the shift is not merely constant either to the right or left but calculated. The spectral shift ranged from -1.66 cm-1 to 2.28 cm-1. Misalignment of spectra is not problematic when using instrument-specific software since the software can handle instrument differences. However, whenever standalone software is used for data mining, spectral alignment differences are problematic, and alignment is necessary.
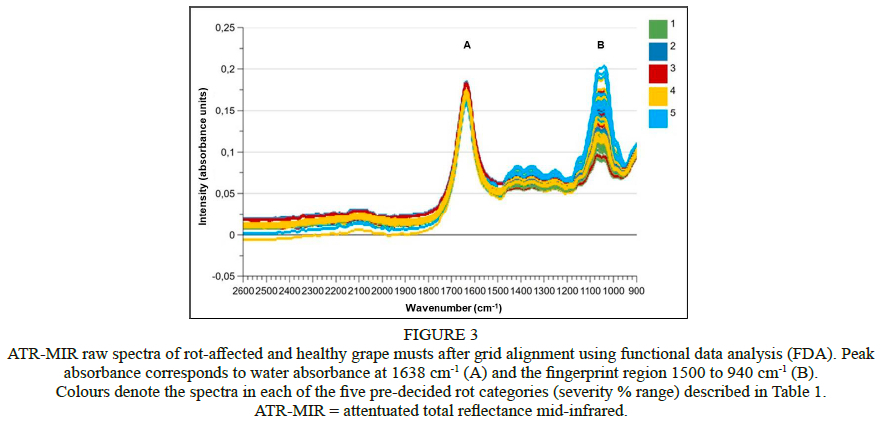
In Figure 3, the raw ATR-MIR spectra after grid alignment are plotted. No offset was observed, which demonstrated the value of FDA in spectroscopy to maximise industrial application as previously advocated (Saeys et al., 2008). The observed peaks corresponded to water absorbance at 1638 cm-1 (Lemos et al, 2020) and the fingerprint region 1500 to 940 cm-1 (Musingarabwi et al., 2016), denoted by A and B respectively (Fig. 3). With specific reference to the fingerprint region, wavenumbers in the region 1087 to 1032 cm-1 showed the strongest absorbance. These strong absorptions are mainly due to the CH-OH frequencies of glucose and fructose (Cozzolino & Curtin, 2012; Gambetta et al., 2019) and C-O stretching of alcohol (Nagarajan et al., 2006). Data artefacts will always be part of the practical problems encountered in data collection (Naes et al., 2004), but can be dealt with by means of pre-processing as demonstrated by the present study.
Detection and severity quantification of rot-affected grape musts
Principal component analysis (PCA)
Explained variance of 98 % was obtained with the first two principal components (PC's). Seven outlier samples were deselected from the sample set. In the present study, a visible pattern along PC1 is observed of increased severity (%) from the negative to the positive end of PC1 (Fig. 4). Furthermore, the loadings line plot of PC1 (Fig. 5) confirmed the importance of the fingerprint region's (1500 to 940 cm-1) contribution to explained variance along PC1. No clear separation according to categories (severity % range) were obtained. However, PCA models only attempt to visualise the multidimensional variation and underlying structure in data without a discriminating function (Wise et al., 2006).
CVA biplots
In the CVA biplots (Figs. 6 and 7), samples are illustrated as points in a two-dimensional space, and the variables or wavenumbers are presented by separate biplot axes. The axes are calibrated in the original units of measurement (Le Roux and Gardner, 2005), representing absorbance units in the current study.
Superimposing 90 % alpha-bags, minimal overlap between rot-affected (Yes) and healthy (No) categories was observed (Fig. 6). Alpha-bags quantitatively describe the overlap between classes with the largest value of alpha between 0 to 100 quantifying separations between classes (Grower, et al., 2015). A 90 % alpha-bag means that 90 % of all the samples in a particular category are included in the bag.
The wavenumbers strongly correlating with separation between "Yes" and "No" categories are identified as 1734 cm-1 and 1722 cm-1 (Fig. 6). Absorbance units of 1734 cm-1 and 1722 cm-1 are high in the "Yes" category and low in the "No" category. Interestingly, these two wavenumbers are not located in the fingerprint region of 1500 to 940 cm-1, which were identified as the main source of variation along PC1 (Fig. 5). It has been shown that the spectral region located at 1733 to 1716 cm-1 are key to the prediction of titratable acidity (TA) (Gambetta et al., 2019), with carbonyl group stretching (C=O) appears around 1730 to 1700 cm-1 (Defemez et al., 1995; Shah et al., 2010; Silva et al., 2022). Examples of major carboxylic acids found in grape musts include tartaric acid, lactic acid, malic acid, citric acid, acetic acid, and succinic acid (Callul et al., 1992). Berry dehydration, and thus the concentration of organic acids, and production of gluconic acid and acetic acid, could explain the increase of TA in rot-affected compared to healthy grapes (Barata et al., 2011; Cinquanta et al., 2015).
The third category with unknown grape rot status (Yes/No) predominantly presents on the lower left of the CVA biplot (Fig. 6). Grape growers collected these samples as part of the commercial winery's, where these grapes will be received, protocol to establish harvest date. The assumption was that in most instances, grape growers would not knowingly collect rot-affected samples in determining harvest date, but rather purposively collect healthy samples. If the assumption is correct, combined with the visual interpretation of Figure 6, it is expected that for the detection of rot, healthy samples would present to the left of the CVA biplot and rot-affected samples to the right of the biplot. However, this hypothesis will have to be tested in the following vintages.
The CVA biplot of the five pre-decided categories (severity % range) with 90 % alpha-bags superimposed indicated that Category 1 (0 - 4.9 %) and Category 5 (> 40 %) only showed a negligible overlap (Fig. 7). Apart from this separation, the alpha-bags overlapped markedly. However, the separation between Category 1 (0 - 4.9 %) was more with each of the other Categories 2, 3, 4 and 5, than with Categories 2, 3, 4 and 5 amongst themselves (Data not shown).
An increase in severity (%) is observed from left to right on the biplot (Fig. 7). Like the results in Figure 6, high absorbance units of wavenumber 1725 cm-1 were correlated with discrimination between categories (severity % range). As previously discussed, the spectral band of 1725 cm-1 contains information on carboxylic acids due to the stretching of C=O. In addition, wavenumber 1041 cm-1 also contributes strongly to discrimination between Category 1 (0 - 4.9 %) and Category 5 (> 40 %). A distinct ethanol peak is situated at wavenumber 1044 cm-1 to 1 040 cm-1 due to C-O stretching vibrations (Nagarajan et al., 2006; Schalk et al., 2017). Yeasts from rot convert sugars in the grape berry to ethanol (Hall et al., 2018). Especially in sour rot, ethanol could be further oxidised to acetic acid. Acetic acid, amongst other organic acids, could be represented by wavenumber 1725 cm-1.
The visual assessment's subjectivity and the complexity of metabolic pathways associated with rot could explain the lack of clear discrimination between Category 1 and the middle severity % ranges of Categories 2, 3 and 4 (5 to 39.9 %). Furthermore, visual assessment has been found to overestimate lower severity of < 20 % (Bock et al., 2022b), which could have contributed to a clear differentiation lacking in the middle severity ranges. Results in the current study suggested that the rapid quantification of rot assessment by means of ATR-MIR spectroscopy could be limited to discrimination between healthy and severe infection (> 40 %). Similarly, Hill et al. (2014) also find a clear separation between the 0 % to 25 % categories, and the categories of 50 % and 78 %. The "seperation" was based on the spectral plots of absorbance data in the narrow MIR region of 1142 cm-1 to 1081 cm-1; however, this separation could be related to the C-O stretch of glycerol (Pavia et al., 2001). Glycerol is known to be a rot-associated disease marker (Versari et al., 2008).
CONCLUSIONS
The time-consuming and subjective in-vineyard assessments of grapevine bunch rot are unsustainable for large wineries. Rapid methods like spectroscopy need to be employed to address the industrial requirements of rapid and automated grape quality evaluation. However, practical problems like data artefacts in routine industrial applications of rapid methods are often unnecessarily interpreted as barriers to application. The present study demonstrates a practical solution of applying FDA correcting of misalignment of wavenumbers due to different internal settings of same-type spectrometers. What is known through the literature, this study is one of the first to apply FDA for correcting misaligned MIR spectra. The outcome was improved data quality which boosted the mining of ATR-MIR spectral data for detection and severity quantification of grapevine bunch rot.
The results of this study are of significant industrial importance. Generally, the use of ATR-MIR for rapid assessment of rot-affected grapes is underexplored, and this study significantly contributes to the evaluation of this spectroscopic method for industrial applications. Furthermore, to the best of the authors' knowledge this is the first study exploring the use of ATR-MIR specifically for the detection or quantification of grapevine bunch rot.
The use of CVA biplots demonstrates an effective method for addressing the challenge of visualising big data sets and is novel for the application to a large viticultural data set. Biplot technology is especially of advantageous for industrial use since non-experts can easily interpretate results.
Regarding process monitoring, future work could include adding quality and acceptance regions to the biplots as decision support for the acceptance or rejection of grape loads and visually evaluating each vintage's quality. However, the current CVA models need to be validated by additional samples in the following vintages. For quantification of rot, future work could explore the use of multi-evaluation by combining spectral and quantitative data trying to improve models for prediction of severity in the ranges of 5 % to 39.9 %.
LITERATURE CITED
Australian Grape & Wine Incorporated (AGW), 2022. Winegrape assessment in the vineyard and at the winery. Hooper, A. & Wilkes, E. (eds). pp.1-24. https://www.agw.org.au/winegrape-assessment/ Date of access: 04.04.2023. [ Links ]
Aldrich, C., Gardner, S. & Le Roux, N.J., 2004. AIChE J. 50(9), 2167-2186. https://doi.org/10.1002/aic.10170 [ Links ]
Alkan, B.B., Atakan, C. & Akdi, Y., 2015. Visual analysis using biplot techniques of rainfall changes over Turkey. Mapan - J. Metrol. Soc. India 30(1), 25-30. https://doi.org/10.1007/s12647-014-0119-8 [ Links ]
ALPHA user manual 1005541, 4th version, 2014. 2014 Bruker Optik GmbH, Ettlinger, www.bruker.com [ Links ]
Arslan, M., Tahir, H.E., Zareef, M., Shi, J., Rakha, A., Bilal, M., Xiaowei, H., Zhihua, L. & Xiaoba, Z., 2021. Recent trends in quality control, discrimination and authentication of alcoholic beverages using nondestructive instrumental techniques. Trends Food Sci. Technol. 107, 80-113. https://doi.org/10.1016/j.tifs.2020.11.021 [ Links ]
Barata, A., Pais, A., Malfeito-Ferreira, M. & Loureiro, V., 2011. Influence of sour rotten grapes on the chemical composition and quality of grape must and wine. European Food Research and Technology 233(2), 183-194. https://doi.org/10.1007/s00217-011-1505-x [ Links ]
Bock, C.H., Pethybridge, S.J., Barbedo, J.G.A., Esker, P.D., Mahlein, A.K. & Del Ponte, E.M., 2022a. A phytopathometry glossary for the twenty-first century: towards consistency and precision in intra- and inter- disciplinary dialogues. Trop. Plant Pathol. 47(1), 14-24. https://doi.org/10.1007/s40858-021-00454-0 [ Links ]
Bock, C.H., Chiang, K.S. & Del Ponted, E.M., 2022b. Plant disease severity estimated visually: a century of research, best practices, and opportunities for improving methods and practices to maximize accuracy. Trop. Plant Pathol. 47(1), 25-42. https://doi.org/10.1007/s40858-021-00439-z [ Links ]
Bois, B., Zito, S. & Calonnec, A., 2017. Climate vs grapevine pest and diseases worldwide: The first results of a global survey. OENO One 51(2), 133-139. https://doi.org/10.20870/oeno-one.2016.0.0.1780 [ Links ]
Callao, M.P. & Ruisánchez, I., 2018. An overview of multivariate qualitative methods for food fraud detection. Food Control, 86, 283-293. https://doi.org/10.1016/j.foocont.2017.11.034 [ Links ]
Calull, M., Marcé, R.M. & Borrull, F., 1992. Determination of carboxylic acids, sugars, glycerol and ethanol in wine and grape must by ion-exchange high-performance liquid chromatography with refractive index detection. J. Chromatogr. A 590(2), 215-222. https://doi.org/10.1016/0021-9673(92)85384-6 [ Links ]
Caramês, E.T.S., Alamar, P.D., Poppi, R.J., & Pallone, J.A.L., 2017. Rapid assessment of total phenolic and anthocyanin contents in grape juice using infrared spectroscopy and multivariate calibration. Food Anal. Methods 10(5), 1609-1615. https://doi.org/10.1007/s12161-016-0721-1 [ Links ]
Cinquanta, L., Albanese, D., De Curtis, F., Malvano, F., Crescitelli, A. & Di Matteo, M., 2015. Rapid assessment of gray mold (Botrytis cinerea) infection in grapes with a biosensor system. Am. J. Enol. Vitic. 66(4), 502-508. https://doi.org/10.5344/ajev.2015.15029 [ Links ]
Coombe, B.G., 1995. Growth stages of the grapevine: Adoption of a system for identifying grapevine growth stages. Aust. J. Grape Wine Res. 1(2), 104-110. https://doi.org/10.1111/j.1755-0238.1995.tb00086.x [ Links ]
Cornelissen, R.J., Kidd, M., Aleixandre Tudo, J. & Nieuwoudt, H.H., 2022. Data-driven determination of disease markers' threshold values in rot-affected wine grapes. South African J. Enol. Vitic. 43(1), 85-95. https://doi.org/10.21548/43-1-4960 [ Links ]
Cozzolino, D. & Curtin, C., 2012. The use of attenuated total reflectance as a tool to monitor the time course of fermentation in wild ferments. Food Control 26(2), 241-246. https://doi.org/10.1016/j.foodcont.2012.02.006 [ Links ]
Cozzolino, D., McCarthy, J. & Bartowsky, E., 2012. Comparison of near infrared and mid infrared spectroscopy to discriminate between wines produced by different Oenococus Oeni strains after malolactic fermentation: A feasibility study. Food Control 26(1), 81-87. https://doi.org/10.1016/j.foodcont.2012.01.003 [ Links ]
Crandall, S.G., Spychalla, J., Crouch, U.T., Acevedo, F.E., Naegele, R.P. & Miles, T.D., 2022. Rotting grapes don't improve with age: Cluster rot disease complexes, management and future prospects. Plant Dis. 106(8), 2013-2025. https://doi.org/10.1094/PDIS-04-21-0695-FE [ Links ]
Defemez, M., Kemsley, E.K. & Wilson, R.H., 1995. Use of infrared spectroscopy and chemometrics for the authentication of fruit purees. J. Agric. Food Chem. 43(1), 109-113. https://doi-org.ez.sun.ac.za/10.1021/jf00049a021 [ Links ]
Dos Santos, C.A.T., Páscoa, R.N.M.J. & Lopes, J.A., 2017. A review on the applications of vibrational spectroscopy in the wine industry: From soil to bottle. TrAC - Trends Anal. Chem. 88, 100-118. http://dx.doi.org/10.1016/j.trac.2016.12.012 [ Links ]
Evans et al., 2010. Effective management of botrytis bunch rot for cool climate viticulture. Project no. UT0601, University of Tasmania. https://www.wineaustralia.com/getmedia/3eb20c93-e535-4e1b-9989-7ebc16b3ce3c/UT-06-01 Date of access: 30.01.2022. [ Links ]
Gambetta, J.M., Cozzolino, D., Bastian, S.E.P. & Jeffery, D.W., 2019. Classification of Chardonnay grapes according to geographical indication and quality grade using attenuated total reflectance mid-infrared spectroscopy. Food Anal. Methods 12(1), 239-245. https://doi.org/10.1007/s12161-018-1355-2 [ Links ]
Gardner, S. & Le Roux, N.J., 2005. Extensions of biplot methodology to discriminant analysis. J. Classif. 22(1), 59-86. https://doi.org/10.1007/s00357-005-0006-7 [ Links ]
Gardner-Lubbe, S., Le Roux, N.J. & Gower, J.C., 2008. Measures of fit in principal component and canonical variate analysis. J. Appl. Stat. 35(9), 947-965. https://doi.org/10.1080/02664760802185399 [ Links ]
Gehlken, J., Pour Nikfardjam, M. & Zörb, C., 2022. Determination of aroma compounds in grape mash under conditions of tasting by on-line near-infrared spectroscopy. Eur. Food Res. Technol. 248(9), 2325-2337. https://doi.org/10.1007/s00217-022-04048-1 [ Links ]
Giovenzana, V., Beghi, R., Tugnolo, A., Brancadora, L. & Guidetti, R., 2018. Comparison of two immersion probes coupled with visible/near infrared spectroscopy to assess the must infection at the grape receiving area. Comput. Electron. Agric. 146, 86-92. https://doi.org/10.1016/j.compag.2018.01.017 [ Links ]
González-Barreiro, C., Rial-Otero, R., Cancho-Grande, B. & Simal-Gándara, J., 2015. Wine aroma compounds in grapes: A critical review. Crit. Rev. Food Sci. Nutr. 55(2), 202-218. https://doi.org/10.1080/10408398.2011.650336 [ Links ]
Gower, J. C. & Hand, D. J., 1996. Biplots. Chapman & Hall, London, United Kingdom. [ Links ]
Gower, J.C., Le Roux, N.J. & Gardner-Lubbe, S., 2015. Biplots: quantitative data. Wiley Interdiscip. Rev. Comput. Stat. 7(1), 42-62. https://doi.org/10.1002/wics.1338 [ Links ]
Gower, J.C., Gardner-Lubbe, S. & Le Roux, N.J., 2011. Understanding biplots. John Wiley & Sons, Ltd, Chichester, United Kingdom. [ Links ]
Hall, M.E., Loeb, G.M., Cadle-Davidson, L., Evans, K.J. & Wilcox, W.F., 2018. Grape sour rot: A four-way interaction involving the host, yeast, acetic acid bacteria, and insects. Phytopathology 108(12), 1429-1442. https://doi.org/10.1094/PHYTO-03-18-0098-R [ Links ]
Hassoun, A., Jagtap, S., Garcia-Garcia, G., Trollman, H., Pateiro, M., Lorenzo, J.M., Trif, M., Rusu, A.V., Aadil, R.M., Simat, V., Cropotova, J. & Câmara, J.S., 2023. Food quality 4.0: From traditional approaches to digitalized automated analysis. J. Food Eng. 337, 1-16. https://doi.org/10.1016/j.jfoodeng.2022.111216 [ Links ]
Hausinger, K., Lipps, M., Raddatz, H., Rosch, A., Scholten, G. & Schrenk, D., 2014. Influence of grape rot on the contents of sulfur binding compounds in wine after automated optical grape sorting. Vitis 53(3), 167-171. [ Links ]
Hill, G.N., Evans, K.J., Beresford, R.M., & Dambergs, R.G., 2013. Near and mid-infrared spectroscopy for the quantification of botrytis rot in white wine grapes. J. Near Infrared Spectrosc. 21(6), 467-475. https://doi.org/10.1255/jnirs.1083 [ Links ]
Hill, G.N., Evans, K.J., Beresford, R.M. & Dambergs, R.G., 2014. Comparison of methods for the quantification of botrytis bunch rot in white wine grapes. Aust. J. Grape Wine Res. 20(3), 432-441. https://doi.org/10.1111/ajgw.12101 [ Links ]
Jadhav, S.B. & Gupta, A., 2016. Studies on application of ß-1,3 glucanase in the degradation of glucans produced by Botrytis cinerea and inhibition of fungal growth. Biocatal. Agric. Biotechnol. 7, 45-47. https://doi.org/10.1016/j.bcab.2016.05.006 [ Links ]
Khakimov, B., Gürdeniz, G. & Engelse, S.B., 2015. Trends in the application of chemometrics to foodomics studies. Acta Aliment. 44(1), 4-31. https://doi.org/10.1556/AAlim.44.2015.1.1 [ Links ]
Kim, S.S. & Kim, S., 2022. Impact and prospect of the fourth industrial revolution in food safety: Mini-review. Food Sci. Biotechnol. 31(4), 399-406. https://doi.org/10.1007/s10068-022-01047-6 [ Links ]
Ky, I., Lorrain, B., Jourdes, M., Pasquier, G., Fermaid, M., Gény, L., Rey, P., Doneche, B. & Teissedre, P.-L., 2012. Assessment of grey mould (Botrytis cinerea) impact on phenolic and sensory quality of Bordeaux grapes, musts and wines for two consecutive vintages. Aust. J. Grape Wine Res. 18(2), 215-226. [ Links ]
Lemos, A.M., Machado, N., Egea-Cortines, M. & Barros, A.I., 2020. ATR-MIR spectroscopy as a tool to assist 'Tempranillo' clonal selection process: Geographical origin and year of harvest discrimination and oenological parameters prediction. Food Chem. 325, 1-8. https://doi.org/10.1016/j.foodchem.2020.126938 [ Links ]
Le Roux, N.J. & Gardner, S., 2005. Analysing your multivariate data as a pictorial: A case for applying biplot methodology? Int. Stat. Rev. 73(3), 365-387. https://doi.org/10.1111/j.1751-5823.2005.tb00154.x [ Links ]
Li, X., Li, T., Li., M., Chen, D., Liu, X., Zhao, S., Dai, X., Chen, J., Kong, Z. & Tan, J., 2022. Effect of pathogenic fungal infestation on the berry quality and volatile organic compounds of Cabernet Sauvignon and Petit Manseng grapes. Front. Plant Sci. 13, 1-14. https://doi.org/10.3389/fpls.2022.942487 [ Links ]
Madden, A.A., Boyden, S.D., Soriano, J.A.N., Corey, T.B., Leff, J.W., Fierer, N. & Starks, P.T., 2017. The emerging contribution of social wasps to grape rot disease ecology. PeerJ 5:e3223, 1-17. https://doi.org/10.7717/peerj.3223 [ Links ]
Meneguzzo, J., Miele, A., Rizzon, L.A. & Ayub, M.A.Z., 2008. Effect of bunch rot on the sensory characteristics of the Gewürztraminer wine. J. Int. de Sci. la Vigne du Vin 42(2), 107-111. [ Links ]
Mendes, E. & Duarte, N., 2021. Mid-infrared spectroscopy as a valuable tool to tackle food analysis: A literature review on coffee, dairies, honey, olive oil and wine. Foods 10(2), 1-32. https://doi.org/10.3390/foods10020477 [ Links ]
Musingarabwi, D.M., Nieuwoudt, H.H., Young, P.R., Eyéghé-bickong, H.A. & Vivier, M.A., 2016. A rapid qualitative and quantitative evaluation of grape berries at various stages of development using Fourier-transform infrared spectroscopy and multivariate data analysis. Food Chem. 190, 253-262. http://dx.doi.org/10.1016/j.foodchem.2015.05.080 [ Links ]
Naes, T., Isakson, T., Fearn, T. & Davies, T., 2004. A user-friendly guide to multivariate calibration and classification. NIR Publications, Chichester, United Kingdom. [ Links ]
Nagarajan, R., Gupta, A., Mehrotra, R. & Bajaj, M., 2006. Quantitative analysis of alcohol, sugar, and tartaric acid in alcoholic beverages using attenuated total reflectance spectroscopy. J. Autom. Methods Manag. Chem., 1-5. https://doi.org/10.1155/JAMMC/2006/45102 [ Links ]
Nutter, F.W, Teng, P.S. & Shokes, F.M., 1991. Disease assessment terms and concepts. Plant Dis. 75(11), 1187-1188. [ Links ]
Okere, E.E., Arendse, E., Nieuwoudt, H., Fawole, O.A., Perold, W.J. & Opara, U.L., 2021. Non-invasive methods for predicting the quality of processed horticultural food products, with emphasis on dried powders, juices and oils: A review. Foods 10(12), 1-31. https://doi.org/10.3390/foods10123061 [ Links ]
Osborne, J., 2014. Dealing with compromised fruit in the winery. Pract. Winer. Vineyard August 2014, 60-62. [ Links ]
Pañitrur-De La Fuente, C. Valdés-Gómez, H., Roudet, J., Acevedo-Opazo, C., Verdugo-Vásquez, N., Araya-Alman, M., Lolas, M., Moreno, Y. & Fermaud, M., 2018. Classification of winegrape cultivars in Chile and France according to their susceptibility to Botrytis cinerea related to fruit maturity. Aust. J. Grape Wine Res. 24(2), 145-157. https://doi.org/10.1111/ajgw.12315 [ Links ]
Pavia, D.L., Lampmann, G.M. & Kriz, G.S., 2001. Introduction to Spectroscopy: A Guide for Students of Organic Chemistry. (3rd ed.). Harcourt College Publishers, Fort Worth, Texas, United States. [ Links ]
Perperoglou, A., Sauerbrei, W., Abrahamowicz, M. & Schmid, M., 2019. A review of spline function procedures in R. BMC Med. Res. Methodol. 19, 1-16. https://doi.org/10.1186/s12874-019-0666-3 [ Links ]
Petrovic, G., Aleixandre-Tudo, J.L. & Buica, A., 2019. Unravelling the complexities of wine: A big data approach to yeast assimilable nitrogen using infrared spectroscopy and chemometrics. OENO One 3(2), 107-127. https://doi.org/10.20870/oeno-one.2019.53.2.2371 [ Links ]
Petrovic, G., Aleixandre-Tudo, J.L. & Buica, A., 2020. Viability of IR spectroscopy for the accurate measurement of yeast assimilable nitrogen content of grape juice. Talanta 206, 1-7. https://doi.org/10.20870/oeno-one.2019.53.2.2371 [ Links ]
Porep, J.U., Mattes, A., Pour Nikfardjam, M.S., Kammerer, D.R. & Carle, R., 2015. Implementation of an on-line near infrared/visible (NIR/ VIS) spectrometer for rapid quality assessment of grapes upon receival at wineries. Aust. J. Grape Wine Res. 21(1), 69-79. https://doi.org/10.1111/ajgw.12120 [ Links ]
Ramsay, J.O. & Silverman, B.W., 1997. Functional data analysis (Springer series in statistics). (1st ed.). Springer Publishing Company, New York City, United States. [ Links ]
Rodwell, D.T., Van der Merwe, C.J. & Gardner-Lubbe, S., 2021. Categorical CVA biplots. Comput. Stat. Data Anal. 163, 1-13. https://doi.org/10.1016/j.csda.2021.107299 [ Links ]
Ropodi, A.I., Panagou, E.Z. & Nychas, G.J.E., 2016. Data mining derived from food analyses using non-invasive/non-destructive analytical techniques: determination of food authenticity, quality and safety in tandem with computer science disciplines. Trends Food Sci. Technol. 50, 11-25. https://doi.org/10.1016/j.tifs.2016.01.011 [ Links ]
Saeys, W., De Ketelaere, B. & Darius, P., 2008. Potential applications of functional data analysis in chemometrics. J. Chemom. 22(5), 335-344. https://doi.org/10.1002/cem.1129 [ Links ]
Santos, H., Augusto, C., Reis, P., Rego, C., Figueiredo, A.C. & Fortes, A.M., 2022. Volatile metabolism of wine grape Trincadeira: Impact of infection with Botrytis cinerea. Plants 11, 1-18. https://doi.org/10.3390/ plants11010141 [ Links ]
Schalk, R., Geoerg, D., Staubach, J., Raedle, M., Methner, F.J. & Beuermann, T., 2017. Evaluation of newly developed mid-infrared sensor for real-time monitoring of yeast fermentations. J. Biosci. Bioeng. 123(5), 651-657. https://doi.org/10.1016/j.jbiosc.2016.12.005 [ Links ]
Schmidtke, L.M., Schwarz, L.J., Schueuermann, C. & Steel, C.C., 2019. Discrimination of Aspergillus spp., Botrytis cinerea, and Penicillium expansum in grape berries by ATR-FTIR spectroscopy. Am. J. Enol. Vitic 70(1), 68-76. https://doi.org/10.5344/ajev.2018.18048 [ Links ]
Schueuermann, C., Steel, C.C., Blackman, J.W., Clark, A.C., Schwarz, L.J., Maraga, J., Collado, I.G. & Schmidtke, L.M., 2019. A GC-MS untargeted metabolomics approach for the classification of chemical differences in grape juices based on fungal pathogen. Food Chem. 270, 375-384. https://doi.org/10.1016/j.foodchem.2018.07.057 [ Links ]
Shah, N., Cynkar, W., Smith, P., & Cozzolino, D., 2010. Use of attenuated total reflectance midinfrared for rapid and real-time analysis of compositional parameters in commercial white grape juice. J. Agric. Food Chem. 58(6), 3279-3283. https://doi.org/10.1021/jf100420z [ Links ]
Silva, E.G.C., Silva, C.S. & Pimentel, M.F., 2022. Infrared spectroscopy for document dating - Advantages, challenges and limitations. Talanta Open 5, 1-12. https://doi.org/10.1016/j.talo.2022.100102 [ Links ]
Simsek, Z., Vaara, E., Paruchuri, S., Nadkari, S. & Shaw, J., 2019. New ways of seeing big data. Acad. Manag. J. 62(4), 971-978. https://doi.org/10.5465/amj.2019.4004 [ Links ]
Steel, C.C., Blackman, J.W. & Schmidtke, L.M., 2013. Grapevine bunch rots: Impacts on wine composition, quality and potential procedures for the removal of wine faults. J. Agric. Food Chem. 61 (22), 5189-5206. https://doi.org/10.1021/jf400641r [ Links ]
Steel, C., Schwarz, L., Clark, A. & Schmidtke, L., 2018. Determining bunch rot impact on wine quality. Grapevine management guide 2018-19, 21-23. https://www.dpi.nsw.gov.au/__data/assets/pdf_file/0003/1158087/Determining-bunch-rot-impact-on-wine-quality.pdf Date of access: 25.07.2022. [ Links ]
Szymañska. E., 2018. Modern data science for analytical chemical data - A comprehensive review. Anal. Chim. Acta, 1-10. https://doi.org/10.1016/j.aca.2018.05.038 [ Links ]
Tuv, E., Borisov, A. & Torkkola, K., 2006. Feature selection using ensemble based ranking against artificial contrasts. The 2006 IEEE International Joint Conference on Neural Network Proceedings, IEEE. pp. 2181-2186. https://doi.org/10.1109/IJCNN.2006.246991 [ Links ]
Ullah, S. & Finch, C.F., 2013. Applications of functional data analysis: A systematic review. BMC Med. Res. Methodol. 13(43), 1-12. http://www.biomedcentral.com/1471-2288/13/43 [ Links ]
Versari, A., Parpinello, G.P., Mattioli, A.U. & Galassi, S., 2008. Determination of grape quality at harvest using FT-MIR. Am. J. Enol. Vitic. 59(3), 317-322. https://doi.org/10.5344/ajev.2008.59.3.317 [ Links ]
Wise, B.M., Gallagher, N.B., Bro, R., Shaver, J.M., Windig, W. & Koch, R.S, 2006. Chemometrics tutorial for PLSToolbox and Solo. Eig. Res. Inc. 3059, 193-212. [ Links ]
Wright, D.B. & London, K., 2009. Regression splines and generalized additive models (GAMs). In: Modern Regression Techniques using R, 112-137. SAGE Publications Ltd, London, United Kingdom. DOI: https://dx.doi.org/10.4135/9780857024497 Date of access: 12.04.2022. [ Links ]
Würz, D.A., Rufato, L., Bogo, A., Allebrandt, R., Pereira de Bem, B., Marcon Filho, J.L., Brighenti, A.F. & Bonin, B.F., 2020. Effects of leaf removal on grape cluster architecture and control of Botrytis bunch rot in Sauvignon Blanc grapevines in Southern Brazil. Crop Prot. 131, 1-6. https://doi.org/10.1016/j.cropro.2020.105079 [ Links ]
Wurz, S., le Roux, N.J., Gardner, S. & Deacon, H.J., 2003. Discriminating between the end products of the earlier Middle Stone Age sub-stages at Klasies River using biplot methodology. J. Archaeol. Sci. 30(9), 1107-1126. https://doi.org/10.1016/S0305-4403(03)00009-8 [ Links ]
Submitted for publication: June 2023
Accepted for publication: September 2023
Acknowledgements: Funding of the research by the South African Grape and Wine Research Institute (SAGWRI), Stellenbosch University, South Africa, the National Research Foundation (NRF) of South Africa, and Namaqua Wines, South Africa. Technical assistance from the viticulturists and laboratory analysts of Namaqua Wines, Vredendal, South Africa. Bruker South Africa for the use of demonstration ATR-MIR ALPHA spectrometers during the research and technical assistance with analyses
R.J. Cornelissen: Current E-mail address: marina@namaquawines.com
* Corresponding author: E-mail address: hhn@sun.ac.za

