


Services on Demand
Article
 English (pdf)
 Article in xml format
 Article references
Indicators

Related links
-
 Cited by Google
 -
 Similars in Google
Share

 Permalink
South African Journal of Enology and Viticulture
On-line version ISSN 2224-7904
Print version ISSN 0253-939X
S. Afr. J. Enol. Vitic. vol.44 n.2 Stellenbosch 2023
http://dx.doi.org/10.21548/44-2-5664
ARTICLES
Effects of Soil Ameliorants Produced from Recycled Glass on the Establishment of Table Grapes
P.A. Myburgh; C.L. Howell*
ARC Infruitec-Nietvoorbij, Private Bag X5026, 7599, Stellenbosch, South Africa
ABSTRACT
Sandy, gravelly or stony soils with low nutrient supply or plant available water are common in the table grape growing regions of South Africa. A field study was carried out to determine if an ameliorant recycled from waste glass could enhance the nutrient and water supply during the establishing phase of table grapes. Two grades of ameliorant, i.e. fine and coarse, were incorporated into the soil before the grapevines were planted. No ameliorants were applied to the control. After planting, the grapevines were irrigated by using 2.1 L/h drippers. To establish whether the ameliorants could compensate if less water is applied, the same treatments were applied under 1.2 L/h drippers. In general, the grapevines responded positively to the higher irrigation volumes, irrespective of ameliorant application. Where higher irrigation volumes were applied, the ameliorants did not have any positive effect on soil chemical or grapevine nutrient status compared to the control. This showed that the ameliorants were chemically inert under the given conditions. The ameliorants also did not improve grapevine water status, vegetative growth, yield or juice characteristics. Likewise, the ameliorants could not compensate for any measured aspect of grapevine performance where less irrigation was applied. In general, the ameliorants did not meet the expectations. Considering the additional costs of the ameliorant application, and the lack of positive grapevine responses, this practice cannot be justified under the given, or comparable conditions.
Key words: ameliorant, grapevine, growth, irrigation, nutrients, water constraints, yield
INTRODUCTION
Table grapes need adequate water and nutrients to sustain vegetative growth, yield and fruit quality. In addition to fertilizers, application of ameliorants such as lime to adjust soil acidity, or gypsum to reduce the level of salinity/ sodicity, is common practice in vineyards soils (Conradie et al., 2020). Some soils in the table grape regions may have low cation exchange capacity (CEC) that will require precise nutrition management. However, in practice no ameliorants are applied to enhance the CEC of vineyard soils.
Water resources are generally limited in South Africa. Due to inconsistent rainfall that can cause periodic droughts, adequate irrigation is a challenge in most table grape growing regions. This scenario may worsen if future climate change reduces rainfall and increases air temperature. Furthermore, grapevines in soils with low water holding capacity, e.g. sandy, gravelly or stony soils, will require more frequent irrigation compared to heavier soils. It was previously reported that stone contents in soils along the Hex River could be in excess of 50% (Eustice, 2008). A high irrigation frequency will increase evaporation losses from the soil, thereby reducing the yield water use efficiency (WUEyield). A lower WUEyield means less grapes produced per unit of irrigation water. Likewise, the blue water footprint (WFblue) primarily due to irrigation (Hoekstra et al., 2011) will increase, i.e. more water will be required produce a unit of grapes.
Ameliorants that improve CEC and/or water holding capacity could ensure more sustainable table grape production. The addition of unprocessed organic matter to enhance soil water holding capacity is widely promoted (Barzegar et al., 2002; Leu et al., 2010; Azlan et al., 2012; Bhada et al., 2017; Van Beek et al., 2018; Herawati et al.,, 2021). Nevertheless, the increased water holding capacity by means of organic matter application appears to be relatively small (Minasny & McBratney, 2018).
Processed organic matter, or biochar, can also increase water holding capacity in soils (Basso et al., 2013; Yu et al., 2013, Mao et al., 2019; Hien et al., 2021; Li et al., 2021). However, biochars produced from different biomass sources seem to vary in their ability to improve soil water holding capacity (Brantley et al., 2015; Mao et al., 2019). According to Mao et al. (2019), biochar increased the water holding capacity in soils containing low levels of organic matter, but had no effect in soils containing high levels of organic matter, i.e. Phaeozems (IUSS Working Group WRB, 2015).
Super absorbent polymers such as cross-linked Polyacrylamide, or commonly referred to as hydrogels, can also enhance soil water holding capacity in soils (Abedi-Koupai et al., 2008; Agaba et al., 2010; Abdallah, 2019; Miller & Naeth, 2019). As a result, hydrogels could reduce the risk of water and nutrient losses caused by deep percolation, allow longer intervals between irrigations and serve as a buffer against water constraints in crops during periods of drought (Abdallah, 2019 and references therein). However, it seems that the positive effect of hydrogel can deteriorate over time (Miller & Naeth, 2019). Ameliorants produced from waste glass also holds promise for enhanced nutrient and water supply to crops. Furthermore, it would be an environmentally friendly practice if any ameliorant could be recycled from non-biodegradable waste materials. The objective of the study was to determine to what extent an ameliorant recycled from waste glass could improve the performance of table grapes during its establishing phase.
MATERIALS AND METHODS
Experiment layout
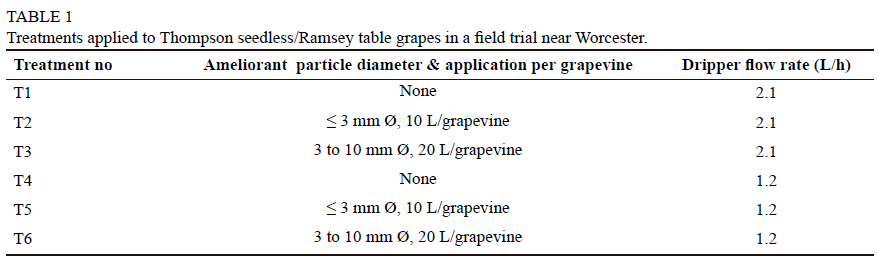
The field trial was carried out from August 2019 until July 2022 near Worcester in the Breede River Valley (-33.61676, 19.50294). The alluvial soil deposited by the Hex River consisted of 40 cm deep, stone-rich topsoil on heavy clay. The ameliorants were incorporated into the soil in August 2019 under the supervision of the suppliers. Plant hole dimensions were ca. 500 mm wide, 800 mm long and 400 mm deep. After excavating the soil, the ameliorants were mixed with soil as it was filled back into the holes. Two grades of the ameliorant were applied, i.e. particle size < 3 mm and 3 mm to 10 mm in diameter. No other soil preparation was carried out. In September 2019, Thompson Seedless grapevines grafted onto Ramsey rootstock were planted in the center of the soil volume where ameliorants were applied. The plant spacing was 3 m x 2 m, and the grapevines were trained onto a slanting trellis (Ferreira, 2019).
Six treatments were applied (Table 1). Drip irrigation was applied either at 2.1 L/h (hi- flow; T1 to T3), which is the flow rate preferred by the grower, or 1.2 L/h (lo-flow; T4 to T6). Since the irrigation was controlled by means of a single valve, the lo-flow drippers supplied 43% less water to the grapevines and could be considered continuous deficit irrigation compared to the hi-flow drip irrigation. The objective of the latter was to ascertain whether the ameliorant could compensate for lower irrigation volumes.
For each dripper flow rate, two grades of ameliorant were applied and compared to irrigation without ameliorant (T1 & T4). Each of the six treatments was replicated three times in a complete randomized experiment layout. Experiment plots consisted of four grapevines. Since only a limited amount of ameliorant could be imported, and treatment application was localized per grapevine, there were no border grapevines. Furthermore, the limited wetting pattern of the drip irrigation system, wide plant spacing and levelness of the land reduced the risk of overlapping treatment effects. The irrigation volumes were measured by means of three sets of water meters per flow level. The irrigation volumes were recorded at approximately 14-day intervals until harvest. During the post-harvest and dormant period, irrigation volumes were recorded every three to four weeks. Irrigation was terminated after significant winter rainfall occurred, i.e. in July. The grapevines were irrigated according to the grower's schedule, i.e. approximately three times a week. Fertilizers were applied by hand according to the grower's program.
Soil properties
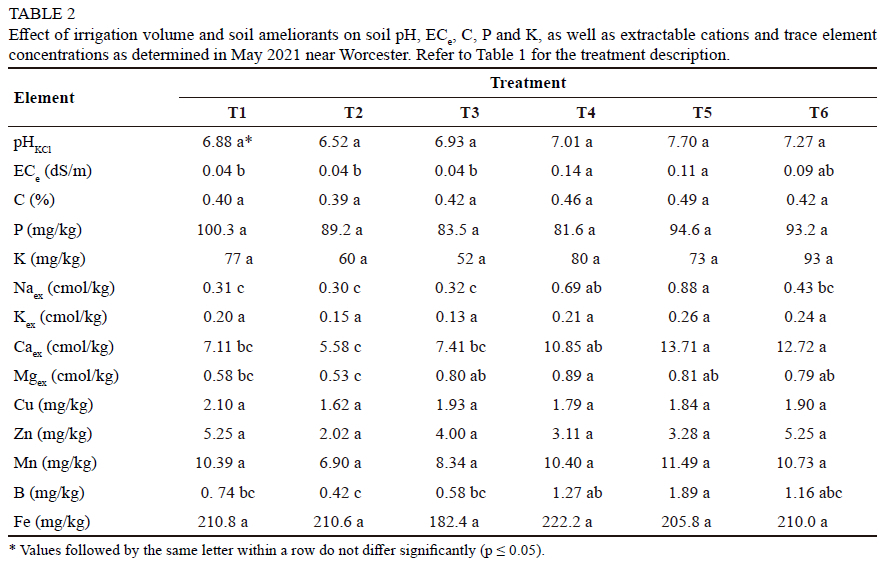
In May 2021, soil samples were taken in all experiment plots on the grapevine row in the 400 mm deep layer approximately 150 mm from a grapevine, i.e. in the soil volume where the ameliorants were added. The soil analyses were carried out at a commercial laboratory (Labserve, Stellenbosch). Soil (pHKCl), electrical conductivity (ECe), phosphorus-Ambic 1 (P) and potassium (K), as well as extractable sodium (Naex), potassium (Kex), calcium (Caex) and magnesium (Mgex) levels were determined. The copper (Cu), zinc (Zn), manganese (Mn), boron (B), iron (Fe) and organic carbon (C) contents were also determined. Soil texture and water holding capacity were determined on a composite sample collected at three representative positions in the field trial.
Grapevine responses
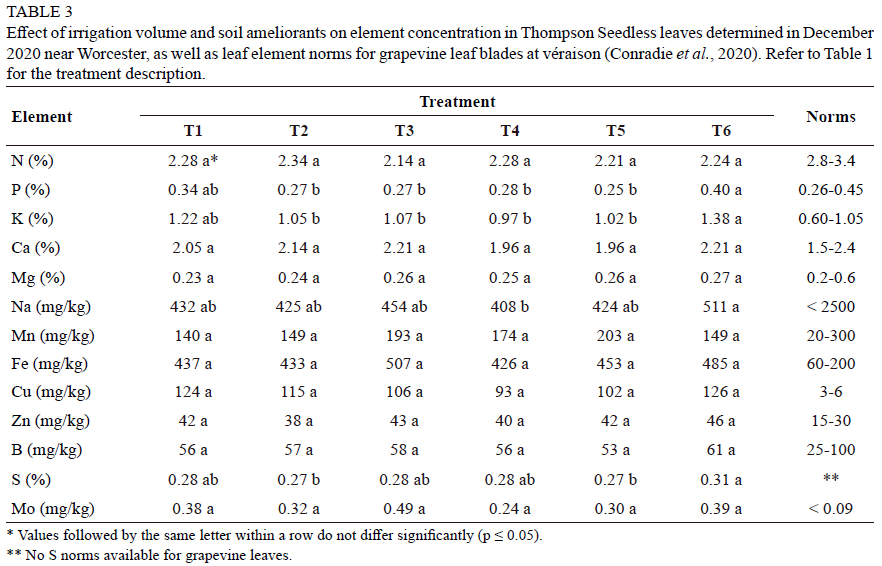
Grapevine chemical status: Leaf samples were collected on 24 December 2020. Twenty-five mature, unscathed leaves opposite a bunch were picked on each plot. Leaf nitrogen (N), P, K, Ca, Mg, Na, Mn, Fe, Cu, Zn, B, chloride (Cl), sulphur (S) and molybdenum (Mo) contents were determined at the same laboratory as the soil.
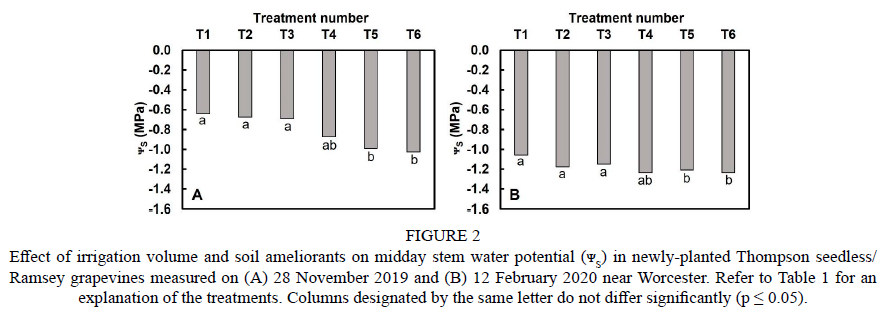
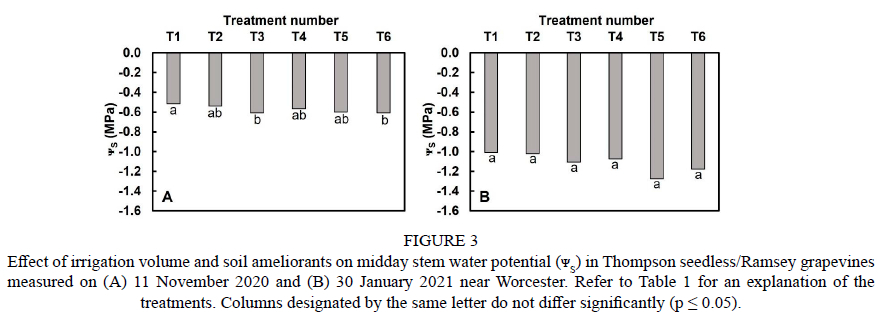
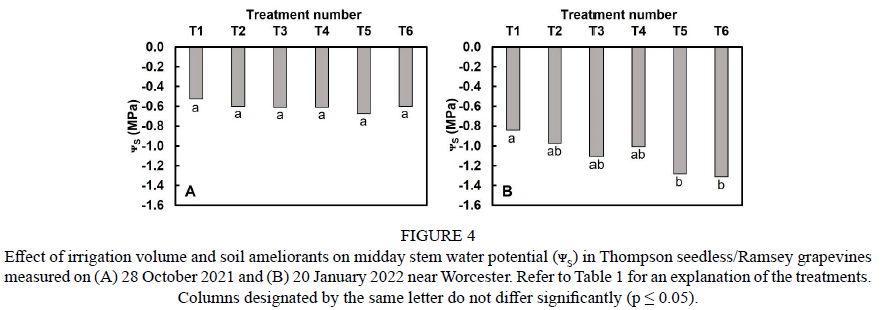
Grapevine water status: Grapevine water potential was measured by means of a pressure chamber (Scholander et al., 1965). Midday stem water potential (ΨS) in the newly planted grapevines was measured on 28 November 2019 and 12 February 2020 in all experiment plots. Midday ΨS was measured on 11 November and 30 December in the 2020/21 season, as well as on 28 October and 20 January in the 2021/22 season. To determine if the ameliorants could reduce the development of possible water constraints, irrigation was stopped two days before midday ΨS was measured.
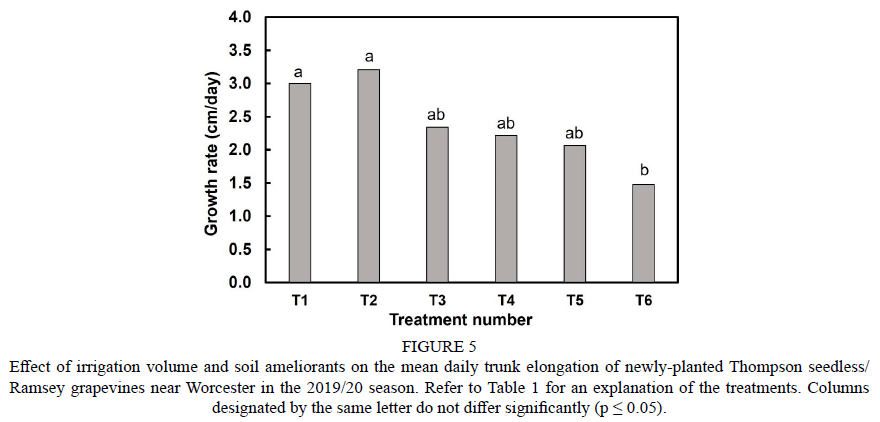
Vegetative growth: Since the newly planted grapevines were trained as a single stem onto the trellis system, the elongation rate of the stem, or trunk, was measured. Trunk length measurements were carried out on 26 November 2019 and repeated on 9 December 2019. The mean daily growth rate over the 13-day period was obtained by dividing the difference in height by the number of days between measurements. Grapevine trunk diameter was measured before pruning on 6 July 2020. The trunk diameter was measured in line with the work row, as well as across the work row at a height of 50 cm above the ground on each experiment grapevine using an electronic Vernier caliper. To obtain an indication of the accumulative growth over the season, cane mass was measured at pruning on 23 July 2020, 9 July 2021 and 30 June 2022.
Yield components: Grapes were harvested on 3 February in the 2020/21 and the 2021/22 seasons. Fresh berry mass was determined in all the plots at harvest. Fifty-berry samples were obtained by picking ten berries along the longitudinal axis from each of five bunches per plot. Berries were removed by cutting through the pedicel as close as possible to the berry using a small pair of scissors. All bunches in each plot were picked, counted and weighed to obtain the total mass per plot. Mean yield per grapevine was calculated and converted to ton per hectare. Bunch mass was determined by dividing the total grape mass per plot by the number of bunches per plot. The WUEyield was calculated as grapes (kg) produced per unit of irrigation water (m3), whereas the WFblue is irrigation water (m3) applied to produce a unit of grapes (t) (Hoekstra et al., 2011). The WUEyield and WFblue were only calculated for the full-bearing grapevines in the 2021/22 season.
Juice characteristics: Total soluble solids (TSS), pH and total titratable acidity (TTA) in the juice of the fifty-berry samples were determined according to the standard procedures of the wine laboratory at ARC Infruitec-Nietvoorbij.
Statistical analyses: Data was subjected to analysis of variance (Anova) using GLM (General Linear Models) Procedure of SAS software (Version 9.4; SAS Institute Inc, Cary, USA). Shapiro-Wilk test was performed on the standardized residuals from the model to test for deviation from normality (Shapiro, 1965). Fisher's least significant difference was calculated at the 5% level to compare treatment means (Ott, 1998). A probability level of 5% was considered significant for all significance tests.
RESULTS AND DISCUSSION
Soil texture and water holding capacity
The topsoil contained 4% clay and 12% silt, as well as 41%, 27% and 16% coarse, medium and fine sand, respectively. According to the particle size distribution, the soil had a loamy sand texture. The water holding capacity amounted to 72 mm/m, i.e. only 29 mm in the 400 mm deep topsoil.
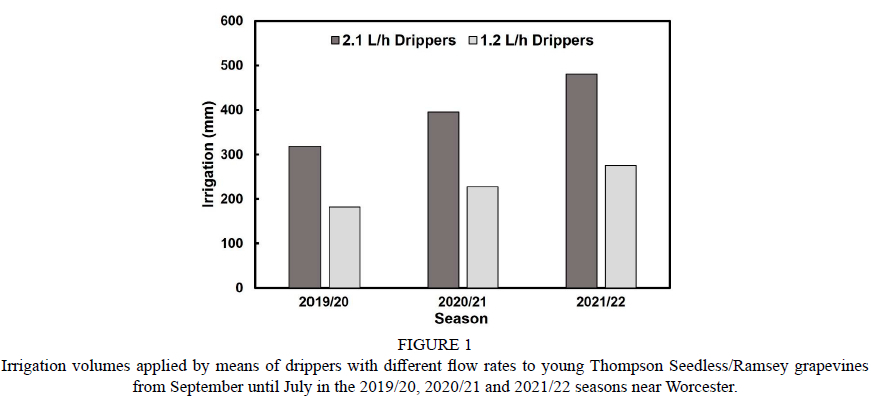
Irrigation volumes
The grower steadily increased the irrigation volumes as the grapevines developed (Fig. 1). In the second and third seasons, irrigation volumes applied via the hi-flow drippers (T1, T2 & T3) were appreciably more than the ca. 260 mm applied to drip irrigated Dan-ben-Hannah table grapes near Paarl in the cooler Berg River Valley region where the rainfall is higher compared to the Breede River valley (Myburgh & Howell, 2012). However, it was less than the ca. 700 mm required by drip irrigated Thompson Seedless table grapes under warm, arid conditions in the Lower Orange River Valley region where table grapes require irrigation throughout the year (Myburgh, 2012). In the third season, the 275 mm applied via the 1.2 L/h drippers was comparable to that of the full-bearing table grapes near Paarl.
Soil chemical status
The soil pHKCl was generally higher than the upper norm of 6.5 for table grapes (Conradie et al., 2020). Although the ameliorants did not have any effect on the pHKCl, it tended to be higher where the lower irrigation volumes were applied (Table 2). Furthermore, ECe was higher where less irrigation was applied, except for the coarse ameliorant (T6). Neither irrigation volume, nor ameliorant had any effect on the organic C, P or K (Table 2). Considering the extractable cations, higher irrigation volumes tended to reduce Kex (Table 2). In some treatments, the higher irrigation volumes reduced Naex, Caex and Mgex levels in the soil compared to less irrigation. The foregoing suggested that the higher irrigation volumes tended to leach more salts from the root zone compared to less irrigation. Irrigation volume and/or ameliorant did not affect trace element concentrations in the soil, except B (Table 2). Similar to the extractable cations, the higher irrigation volumes tended reduce the level of B in the root zone compared to les irrigation. The Mn, Cu, Zn and B contents were well above the minimum requirements of 2 mg/kg, 0.5 mg/kg, 0.5 mg/kg and 0.3 mg/kg, respectively, as proposed by Conradie et al. (2020) for vineyard soils (Table 2).
Grapevine responses
Grapevine chemical status: Al the macro- and micronutrients were within the norms for table grape leaf blades at véraison (Conradie, et al., 2020), except for Fe and Mo (Table 3). Iron levels of around 500 mg/kg in leaves of Concord grapevine did not seem to have any negative effects (Pradubsuk & Davenport, 2011). Molybdenum levels were well above the lower limit of 0.01 mg/kg to 0.09 mg/kg where deficiencies are expected (Williams et al., 2004). In fact, Mo levels were within the range of 0.2 mg/kg to 0.4 mg/kg reported for grapevine petioles (Gastol & Domagala-Swiatidewicz, 2014). Although some elements differed between treatments, the differences could not be explained in relation to the level of irrigation or the ameliorants. Since the element levels were within the norms for table grapes, these differences were unlikely to have caused any negative effect on grapevine growth and yield. Furthermore, it must be noted that the tendency towards leaching of elements by the higher irrigation volumes did not reflect in the nutrient status of the grapevines.
Grapevine water status: Early in the 2019/20 season, grapevines receiving the higher irrigation volumes (T1, T2 & T3) experienced low water constraints, i.e. midday ΨS was approximately -0.6 MPa (Fig. 2A). In contrast, lower irrigation volumes induced moderate water constraints, i.e. midday ΨS was less than -0.8 MPa. Both ameliorants did not affect grapevine water status where the higher irrigation volumes were applied. However, the ameliorants tended to induce more water constraints in the grapevines that received less irrigation (T5 & T6) compared to no ameliorants (T4). In fact, the combination of less irrigation and ameliorants (T5 & T6) induced more water constraints in grapevines with ameliorants compared to grapevines that received more irrigation (T1, T2 & T3). In February 2020, when the atmosphere was warmer and drier, the lack of irrigation caused midday ΨS in the grapevines to vary between -1 MPa and -1.2 MPa (Fig. 2B). This indicated that the grapevines experienced moderate to high water constraints.
The generally low midday ΨS confirmed that frequent drip irrigation is essential in this sandy soil with a high stone content. Furthermore, the ameliorants could not reduce water constraints compared to grapevines where no ameliorants were applied (Fig. 2B). Similar to earlier in the season, the combination of less irrigation and ameliorants (T5 & T6) induced more water constraints in grapevines compared to grapevines that received more irrigation (T1, T2 & T3).
Early in the 2020/21 season, grapevines experienced low water constraints, i.e. midday ΨS was less negative than -0.6 MPa, irrespective of irrigation volume or ameliorant (Fig. 3A). Although, the coarse ameliorant (T3 & T6) caused more water constraints in the grapevines compared to T1, the low levels of water constraints are not expected to have negative effects on grapevine functioning. Later in the season, i.e. on 30 December 2020, grapevines experienced moderate to high water constraints, irrespective of irrigation volume or ameliorant (Fig. 3B). Although irrigation volume or ameliorant had no effect on midday ΨS in the grapevines, the fine grade ameliorant tended to increase water constraints where less irrigation was applied (T5).
Similar to the first two seasons, grapevine water constraints were generally low early in the 2021/22 season (Fig. 4A). Furthermore, irrigation volume or ameliorant did not affect midday ΨS in the grapevines. On 20 January, the grapevines experienced moderate to high water constraints, except for T1 where ΨS was approximately -0.8 MPa (Fig. 4B). The combination of less irrigation and ameliorants (T5 & T6) induced more water constraints compared to more irrigation volume without ameliorants (T1). In fact, the T5 and T6 grapevines experienced high water constraints, i.e. ΨSwas more negative than -1.2 MPa.
Trunk elongation in the first season: Where more irrigation was applied, the growth rate of the newly planted grapevines tended to be lower where the coarse ameliorant was applied (T3) compared to the T1 (no ameliorant) and T2 (fine ameliorant) grapevines (Fig. 5). A similar trend occurred where less irrigation was applied. Furthermore, the combination of less irrigation and coarse ameliorant (T6) reduced the grapevine growth rate by ca. 50% compared to the T1 and T2 grapevines. This was probably due to more water constraints in the T5 and T6 grapevines as discussed above (Fig. 2).
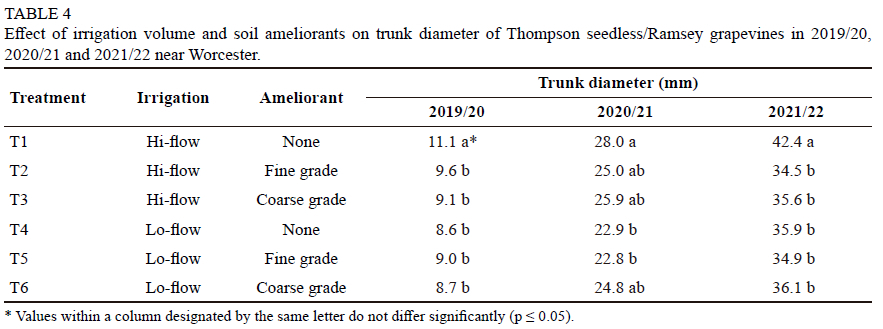
Trunk diameter: At the end of the 2019/20 season, grapevine trunks were thinner where less irrigation was applied compared to the higher irrigation volume where no ameliorants were applied (Table 4). This trend also occurred in the second and third seasons. This showed that less irrigation had a consistent, negative effect on grapevine vigour where no ameliorants were applied. After the first year, the newly planted grapevines had thinner trunks where the ameliorants were applied (T2, T3, T5 & T6) compared to the higher irrigation without ameliorants (T1). In the 2020/21 season, the combination of coarse ameliorant and less irrigation (T5) reduced trunk diameter compared to high irrigation and no ameliorants (T1) (Table 4). By the end of the third season, grapevine trunk diameter was smaller where the ameliorants were applied compared to T1, i.e. irrespective of irrigation volume. This showed that the ameliorants had a negative effect on the vegetative growth over the first three years after the grapevines were planted.
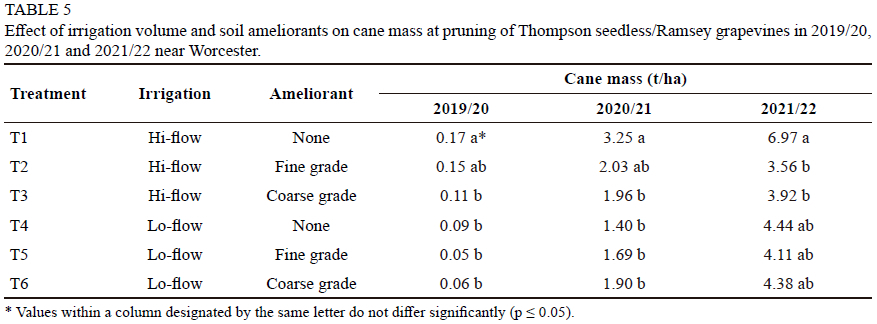
Cane mass: In the first two seasons, less irrigation (T4) reduced cane mass at pruning compared to the higher irrigation volume (T1) where no ameliorants were applied (Table 5). This negative response of vegetative growth of table grapes to reduced irrigation volumes is in agreement with earlier findings (Myburgh, 1996; Myburgh, 2003; Zúñiga-Espinoza et al., 2015). In the third season, i.e. 2021/22, cane mass obtained with the higher irrigation volume without ameliorants was comparable to the ca. 5 to 6 t/ha previously reported for full-bearing Thompson seedless table grapes that received daily drip irrigation around noon in the lower Orange River region (Myburgh, 2012). However, less irrigation (T4 to T6) only tended to reduce vegetative growth in the third season compared to T1. In the first two seasons, the coarse ameliorant (T3) reduced cane mass, whereas the fine ameliorant (T2) only tended to reduce the vigour compared to T1 where the higher irrigation volumes were applied (Table 5). In the 2021/22 season, both ameliorants (T2 & T3) caused lower cane mass compared to high irrigation and no ameliorants (T1). Where less irrigation was applied, the ameliorants (T5 & T6) only tended to suppress grapevine vigour compared to T1. The foregoing confirmed that the ameliorants could not improve the vegetative growth of the grapevines nor compensate for the reduction in vegetative growth where less irrigation was applied.
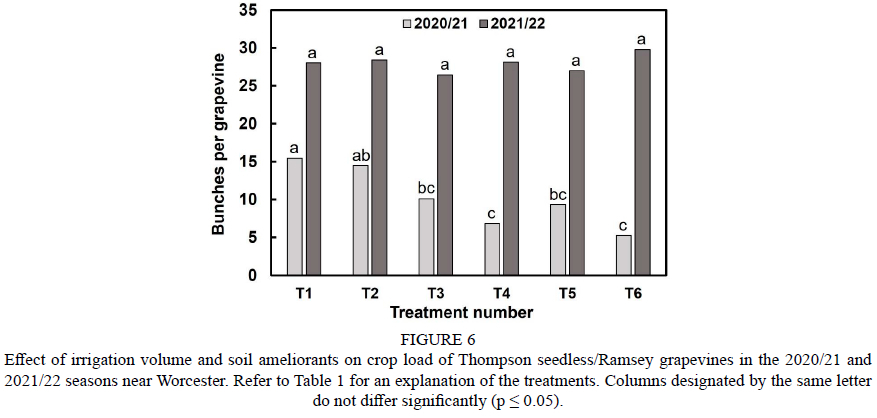
Yield components: Due to the differences in vegetative growth in 2019/20, the number of bunches per grapevine was limited where less irrigation or ameliorants were applied compared to T1, except for the combination of high irrigation volume and fine ameliorant (Fig. 6). However, given the stronger vegetative growth in the 2021/22 season, the grower allowed approximately 28 bunches to all grapevines. Consequently, there were no differences in crop load between treatments.
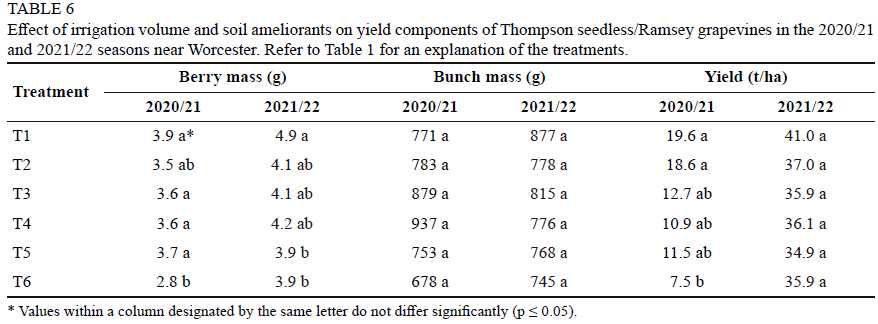
Since the grapes were only produced for the local market in the 2020/21 season, they did not receive the full hormone treatment to obtain bigger berries. Consequently, the berries were generally small, i.e. less than 4 g per berry (Table 6). Where less irrigation was applied, the coarse ameliorant (T6) reduced berry mass compared to most of the other treatments. Neither irrigation nor ameliorant had any effect on bunch mass. Where higher irrigation volumes were applied, the coarse ameliorant (T3) only tended to reduce yield compared to T1 and T2 (Table 6). However, where less irrigation was applied, the coarse ameliorant (T6) reduced the yield substantially compared to T1 and T2. In 2021/22, i.e. the first full bearing season, the crop load was thinned to ca. 28 bunches per grapevine for all treatments. Berry mass was generally higher compared to the 2020/21 season (Table 6). Although the combination of less water and the coarse ameliorant (T6) reduced berry mass, it did not reflect in the yield. However, the yield tended to be higher where the higher irrigation volume was applied without ameliorant (T1).
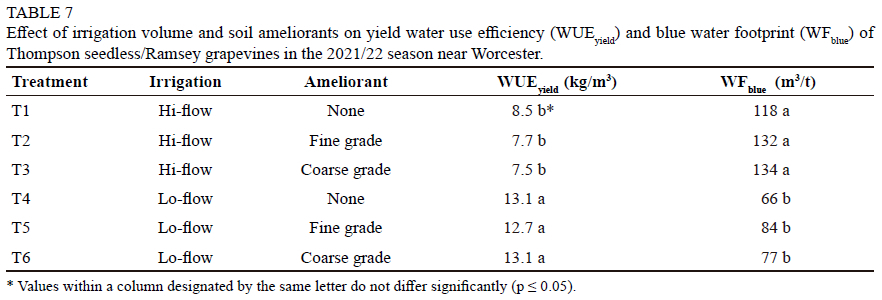
Yield water use efficiency and blue water footprint: The WUEyield was appreciably higher where the lower irrigation volumes were applied (T4, T5 & T6) compared to the grapevines that received more irrigation (Table 7). However, the WUEyield of hi-flow grapevines was still slightly higher compared to ca. 5.1 kg/m3 reported for drip irrigated table grapes in the nearby Hex River Valley (Kangueehi, 2018). The latter is the mean for two vineyards over two years. In contrast, the mean WUEyield was considerably higher than 1.35 kg/m3 for micro-sprinkler irrigated table grapes having a relatively short growth period of only 90 days (Teixeira et al., 2007). The WFblue was appreciably smaller where the lower irrigation volumes were applied compared to more irrigation (Table 7). Furthermore, the WFblue was smaller compared to 211 m3/t of drip irrigated table grapes in the Hex River Valley (Kangueehi, 2018). It must be noted that the WFblue was substantially lower compared to the general value of 454 m3/t reported for table grapes in the Hex River Valley (Jarmain et al., 2020). Under the prevailing conditions, the ameliorants did not have any positive effect on the WUEyield or WFblue of the drip irrigated table grapes (Table 7).
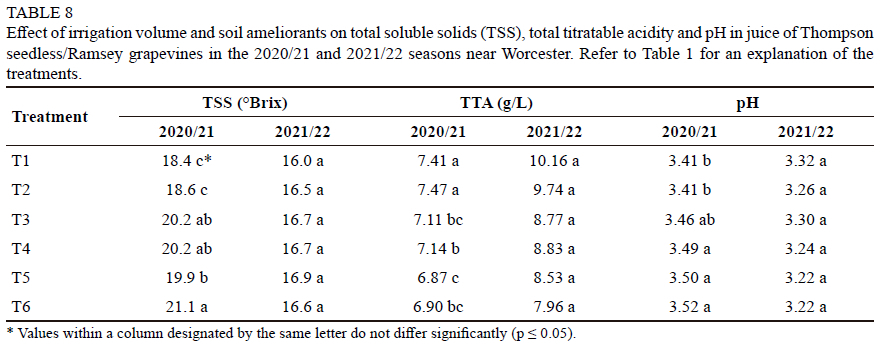
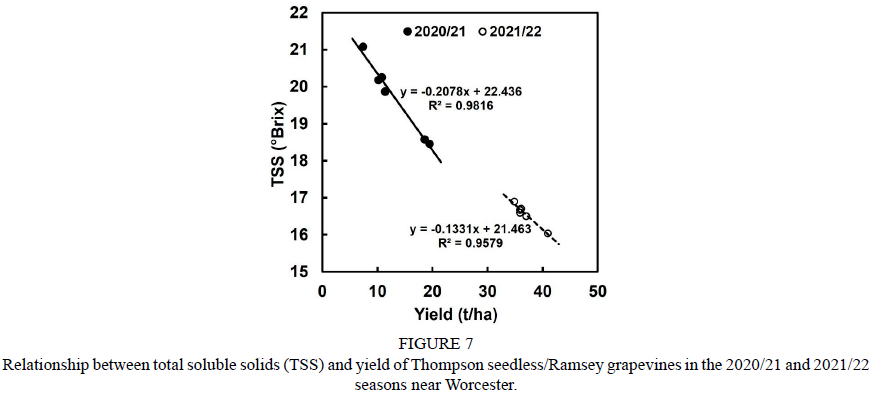
Juice characteristics: In 2020/21, the ameliorants tended to favour juice TSS at harvest, particularly where less irrigation was applied (Table 8). However, the juice TSS content was strongly related to the crop load, i.e. the rate of sugar accumulation was higher where the grapevines bore less fruit and vice versa (Fig. 7). Similar trends were previously reported for grapevines (Čuš, 2004; Somkuwar & Ramteke, 2006; McDonnell, 2011; Akin et al., 2012; Gamero et al.,, 2015; Senthilkumar et al., 2015 and references therein). This suggested that the combined effect of irrigation volume and ameliorant indirectly, i.e. through their effect on the allocation of crop loads according to vegetative growth, caused the differences in TSS between treatments (Table 8). Where more irrigation was applied, the coarse ameliorant (T3) increased the rate of juice TTA breakdown compared to T1 and T2. In contrast, the fine ameliorant (T5) had a similar effect compared to T4 where less water was applied. The higher irrigation volume reduced the juice pH compared to less irrigation, except where the coarse ameliorant was applied (Table 8). The ameliorants did not affect juice pH, irrespective of the irrigation volume. In 2021/22, neither irrigation volume, nor ameliorant had any effect onjuice TSS, TTA and pH (Table 8). Although there were no differences between treatments, TSS tended to decrease with a slight increase in yield (Fig. 7). However, the TSS decrease was substantially lower, and the differences between treatments less steep compared to 2020/21 when the crop loads were more pronounced.
CONCLUSIONS
Since the ameliorants did not affect soil or grapevine chemical status, they appeared to be chemically neutral. Where no ameliorants were applied, lower irrigation volumes reduced grapevine growth and yield compared to more irrigation. Where grapevines received the higher irrigation volumes, the ameliorants did not have any positive effect on grapevine water status, vegetative growth, yield or juice characteristics compared to grapevines where no ameliorants were applied. Furthermore, the ameliorants could not improve grapevine water status, vegetative growth and yield of grapevines that received less irrigation. Given the lack of positive yield responses, the ameliorants could not improve the WUEyield or WFblue. The results strongly suggest that the ameliorants limited water availability to the grapevines. Water absorbed by the ameliorants was probably either released too slowly or not available at all. Although table grapes did not respond to the ameliorants, it does not rule out the possibility that they might have positive effects on other crops. It should be noted that it will be difficult, if not impossible, to remove any ameliorant once it has been applied to the soil. Considering the additional costs of the ameliorant application, and the lack of positive grapevine responses, the specific ameliorants tested in this study cannot be justified for table grape production under the prevailing, or comparable, conditions.
LITERATURE CITED
Abdallah, A.M., 2019. The effect of hydrogel particle size on water retention properties and availability under water stress. Int. Soil Wat. Conserv. Res. 7, 275-285. [ Links ]
Abedi-Koupai, J., Sohrab, F. & Swarbrick, G., 2008. Evaluation of hydrogel application on soil water retention characteristics. J. Plant Nutr. 31, 317-331. [ Links ]
Agaba, H., Orikiriza, L.J.B., Esegu, J.F.O., Obua, J., Kabasa, J.D., & Hüttermann, A., 2010. Effects of Hydrogel Amendment to Different Soils on Plant Available Water and Survival of Trees under Drought Conditions. Clean-Soil, Air, Water 38, 328-335. [ Links ]
Akin, A., Dardeniz, A., Ates, F. & Celik, M., 2012. Effects of various crop loads and leaf fertilizer on grapevine yield and quality. J. Plant Nutr. 35, 1949-1957. [ Links ]
Azlan, A., Aweng, E.R., Ibrahim, C.O. & Noorhaidah, A., 2012. Correlation between soil organic matter, total organic matter and water content with climate and depths of soil at different land use in Kelantan, Malaysia. J. Appl. Sci. Environ. Manage. 16, 353-358. [ Links ]
Barzegar, A.R., Yousefi, A. & Daryashenas, A., 2002. The effect of addition of different amounts and types of organic materials on soil physical properties and yield of wheat. Plant Soil 247, 295-301. [ Links ]
Basso, A.S., Miguez, F.E., Laird, D.A., Horton, R. & Westgate, M., 2013. Assessing potential of biochar for increasing water-holding capacity of sandy soils. GCB Bioenergy 5, 132-143. [ Links ]
Bhadha, J.H., Capasso, J.M., Khatiwada, R., Swanson, S. & LaBorde, C., 2017. Raising Soil Organic Matter Content to Improve Water Holding Capacity. SL447, Soil & Water Science Department, UF/IFAS Extension. [ Links ]
Brantley, K.E., Brye, K.R., Savin, M.C. & Longer, D.E., 2015. Biochar source and application rate effects on soil water retention determined using wetting curves. Open J. Soil Sci. 5, 1-10. [ Links ]
Conradie, K., Raath, P., Saayman, D., Diederichs, B. & Louw, K., 2020. Fertilisation guidelines for the table grape industry. South African Table Grape Industry, 63 Main Road, Paarl, 7464. [ Links ]
Čuš, F., 2004. Influence of crop load on yield and grape quality of cv. "Chardonnay". Acta Agric. Slov. 83, 73-83. [ Links ]
Eustice, T., 2008. Efficiency of irrigation practices for table grapes in the Hex River Valley. Thesis, Stellenbosch University. Private Bag X1, 7602 Matieland, South Africa. [ Links ]
Ferreira, J., 2019. South African table grape industry statistics. https://www.satgi.co.za/. [ Links ]
Gamero, E., Moreno, D., Talaverano, I., Prieto, M.H., Guerra, M.T. & Valdés, M.E., 2014. Effects of irrigation and cluster thinning on Tempranillo grape and wine composition. S. Afr. J. Enol. Vitic., 35, 196-204. [ Links ]
Gąstoł, M. & Domagala-Świątkiewicz, I., 2014. Trace element Partitioning in 'Sibera' grapevines as affected by nitrogen fertilisation. S. Afr. J. Enol. Vitic., 35, 217-225. [ Links ]
Herawati, A., Mujiyo, Syamsiyah, J., Baldan, S.K. & Arifin, I., 2021. Application of soil amendments as a strategy for water holding capacity in sandy soils. IOP Conf. Ser.: Earth Environ. Sci. 724 012014. [ Links ]
Hien, T.T.T., Tsubota, T., Taniguchi, T. & Shinogi, Y., 2021. Enhancing soil water holding capacity and provision of a potassium source via optimization of the pyrolysis of bamboo biochar. Biochar 3, 51-61. [ Links ]
Hoekstra, A.Y., Chapagain, A.K., Aldaya, M.M. & Mekonnen, M.M., 2011. The Water Footprint Assessment Manual: Setting the Global Standard. Earthscan Ltd, London. [ Links ]
IUSS Working Group WRB, 2015. World Reference Base for Soil Resources 2014, update 2015. International soil classification system for naming soils and creating legends for soil maps. World Soil Resources Reports No. 106. FAO, Rome. [ Links ]
Jarmain, C., Avenant, E., van Niekerk, A., Stephenson, G., Mohlotsane, M., Muller, J., Vermeulen, D., Jordaan, H., Prins, A., Poblete-Echeverría, C. & Spies, C., 2020. Water footprint as an indicator of sustainable table and wine grape production. WRC Report No. 2710/1/20, Private Bag X03 Gezina 0031. [ Links ]
Kangueehi, G.N., 2018. Water footprint analysis to improve water use efficiency in table grape (Vitis vinifera L. cv. Crimson Seedless) production. A South African case study. Dissertation, Stellenbosch University. Private Bag X1, 7602 Matieland, South Africa. [ Links ]
Leu, J-M., Traore, S., Wang, Y-M. & Kan, C-E., 2010. The effect of organic matter amendment on soil water holding capacity change for irrigation water saving: Case study in Sahelian environment of Africa. Sci. Res. Essays Vol. 5, 3564-3571. [ Links ]
Li, L., Zhang, Y.-J., Novak, A., Yang, Y. & Wang, J., 2021. Role of biochar in improving sandy soil water retention and resilience to drought. Water 2021, 13, 407. https://doi.org/10.3390/w13040407. [ Links ]
Mao, J., Zhang, K. & Chen, B., 2019. Linking hydrophobicity of biochar to the water repellency and water holding capacity of biochar-amended soil. Environ. Poll. 253,779-789. [ Links ]
McDonnell, C., 2011. The effect of crop load and extended ripening on wine quality and vine balance in Vitis vinifera cv. Cabernet Sauvignon. Thesis (Ph.D.), University of Adelaide, Adelaide SA 5005, Australia. [ Links ]
Miller, V.S. & Naeth, M.A., 2019. Hydrogel and Organic Amendments to Increase Water Retention in Anthroposols for Land Reclamation. https://doi.org/10.1155/2019/4768091. [ Links ]
Minasny, B. & McBratney, A.B., 2018. Limited effect of organic matter on soil available water capacity. Eur. J. Soil Sci. 69, 39-47. [ Links ]
Myburgh, P.A., 1996. Response of Vitis vinifera L. cv. Barlinka/Ramsey to soil water depletion levels with particular reference to trunk growth parameters. S. Afr. J. Enol. Vitic. 17, 3-14. [ Links ]
Myburgh, P.A., 2003. Responses Vitis vinifera L. cv. Sultanina to level of soil water depletion under semi-arid conditions. S. Afr. J. Enol. Vitic. 24, 16-24. [ Links ]
Myburgh, P.A., 2012. Comparing irrigation systems and strategies for table grapes in the weathered granite-gneiss soils of the Lower Orange River region. S. Afr. J. Enol. Vitic. 33, 184-197. [ Links ]
Myburgh, P.A. & Howell, C.L., 2012. Comparison of three different fertigation strategies for drip irrigated table grapes - Part I. Soil water status, root system characteristics and plant water status. S. Afr. J. Enol. Vitic. 32, 89-103. [ Links ]
Ott, R.L., 1998. An introduction to Statistical methods and data analysis. Belmont, California:Duxbury Press. [ Links ]
Pradubsuk, S. & Davenport, J.R., 2011. Seasonal distribution of micronutrients in mature 'Concord' grape: Boron, iron, manganese, copper, and zinc. Amer. Soc. Hort. Sci. 136, 69-77. [ Links ]
Scholander, P.F., Hammel, H.T., Bradstreet, E.D., & Hemmingsen, E.A., 1965. Sap pressure in vascular plants. Science 148, 339-346. [ Links ]
Senthilkumar, S., Vijayakumar, R.M., Soorianathasundaram, K. & Durga Devi, D., 20015. Effect of pruning severity on vegetative, physiological, yield and quality attributes in grape (Vitis vinifera L.): A review. Curr. Agri. Res. J. 3, 42-54. [ Links ]
Shapiro, S.S. & Wilk, M.B., 1965. An analysis of Variance Test for Normality (complete samples), Biometrika 52, 591-611. [ Links ]
Somkuwar, R.G. & Ramteke, S.D., 2006. Yield and quality in relation to different crop loads on Tas-A-Ganesh table grapes. J. Plant Sci. 1, 176-181. [ Links ]
Teixeira, A.H. de C., Bastiaanssen, W.G.M., & Bassoi, L.H., 2007. Crop water parameters of irrigated wine and table grapes to support water productivity analysis in the Säo Francisco river basin, Brazil. Agr. Wat. Manage. 94, 31-42. [ Links ]
Van Beek, C.L., Elias, E., Selassie, Y.G., Gebresamuel, G., Tsegaye, A., Hundessa, F., Tolla, M., Mamuye, M., Yemane, G. & Mengistu, S., 2018. Soil organic matter depletion as a major threat to agricultural intensification in the highlands of Ethiopia. Ethiop. J. Sci. & Tech. 11, 271-285. [ Links ]
Williams, C.M.J., Maier, N.A. & Bartlett, L., 2004. Effect of molybdenum foliar sprays on yield, berry size, seed formation and petiolar nutrient composition of 'Merlot' grapevines. J. Plant Nutr. 24, 1891-1916. [ Links ]
Yu, O.Y., Raichle, B. & Sink, S., 2013. Impact of biochar on the water holding capacity loamy sand soil. Int. J. Energy Environ. Eng. http://www.journal-ijeee.com/content/4/1/44. [ Links ]
Zúñiga-Espinoza, C., Aspillaga, C., Ferreyra, R. & Selles, G., 2015. Response of table grape to irrigation water in the Aconcagua Valley, Chile. Agron. 5, 405-417. [ Links ]
Submitted for publication: November 2022
Accepted for publication: December 2023
Acknowledgements: The ARC for infrastructure and other resources, Mrs. M Van der Rijst for statistical analyses and PG Kriel worker's trust for permission to work in their vineyards, as well as technical support
* Corresponding author: E-mail address: howellc@arc.agric.za

