


Services on Demand
Article
 English (pdf)
 Article in xml format
 Article references
Indicators

Related links
-
 Cited by Google
 -
 Similars in Google
Share

 Permalink
South African Journal of Enology and Viticulture
On-line version ISSN 2224-7904
Print version ISSN 0253-939X
S. Afr. J. Enol. Vitic. vol.44 n.1 Stellenbosch 2023
http://dx.doi.org/10.21548/44-1-5428
ARTICLES
Evolution of the Polyphenolic Content of Moravian White Grape Variety Wines of Different Vintages During Storage
R. VaškováI; L. SnopekI, II; J. MlčekI, *
IDepartment of Food Analysis and Chemistry, Faculty of Technology, Tomas Bata University in Zlin, Zlin, Czech Republic
IIDepartment of Environmental Security, Faculty of Logistics and Crisis Management, Tomas Bata University in Zlin, Uherske Hradiste, Czech Republic
ABSTRACT
Wine is known as a source of bioactive compounds and is one of the alcoholic beverages with the highest phenolic content. There has been growing interest in the composition of wine due to its beneficial properties for human health. This work focuses on biologically active and sensory attributes of white wine and presents research on wine chemical profiles in relation to their geographical origin, varieties and storage. The aim of this study was to investigate the phenolic compound evolution of 35 selected white wine varieties from the Moravian region in the Czech Republic. To separate and identify individual phenolic compounds in the wines, the high-performance liquid chromatographic method was used. A spectrophotometric method was applied for the determination of total polyphenol and total flavonoid content. This research presents results for the total benzoic and cinnamic acid derivatives, flavonols, flavanols and stilbene content of Moravian white grape varieties. Differences were found in the content of these compounds, and the results show that the phenolic concentrations depend on grape variety and storage time.
Key words: White wine, phenolic compounds, phenolic evolution, wine analysis, HPLC-DAD
INTRODUCTION
The relationship between wine and its characteristics has been investigated by many researchers (Kadlec, 2002; Casassa & Harbertson, 2014; Valášek et al., 2014; Fic, 2015). This relationship is produced by the alcoholic fermentation of grape juice or must, resulting in the total or partial conversion of sugars into ethanol and CO2. Wine production and storage processes lead to compositional changes. The methods of transforming grapes into wine are constantly evolving, and the technological processes involved vary according to location, type of cultivated varieties, technical possibilities, traditions, and customs. The production itself starts with harvesting, followed by delivering to the winery, sorting, processing the grapes into must, fermentation of must into young wine, maturation, and further ageing. The last part of the production is the final treatment of the wine, which includes fining, filtration and hot or cold stabilisation, bottling and marketing (Kadlec, 2002).
An important component of wine is water, which comprises approximately 86% (w/w) of the wine. In addition, alcohol (ethanol) comprises about 11 w. %, while 3% are other substances, viz. carbohydrates (sugars), organic acids, aromatic compounds, minerals, nitrogenous substances and polyphenolic compounds. The content of the above-mentioned individual components varies, and is determined by a number of factors, such as grape variety, climatic and geological conditions, diseases and pests, viticulture practices, and the technological processes of wine production and storage (Kadlec, 2002; Fic, 2015).
Besides the most abundant component, which is water, the sugars present in wine are important from a sensory point of view because they co-create the taste of the wine, together with the organic acids and alcohol. The aroma of wine, which creates the first impression for consumers, also plays an important role in the consumer's choice of wine. The aromatic substances in wine may be primarily from the grapes, or can be formed during the fermentation or maturation of the wine. All these parameters are important elements in the assessment of wine from a chemical and sensory point of view (Kadlec, 2002; Fic, 2015).
Polyphenolic compounds are another important group of substances for wine evaluation. They contribute to the organoleptic properties of wine. Several thousand phenolic compounds have been identified in plant material (Casassa & Harbertson, 2014; Fic, 2015). Furthermore, polyphenols are one of the most represented groups of compounds in grapes, and therefore also in wines (Robles et al., 2019).
Polyphenolic compounds are a group of substances synthesised during plant growth and in response to UV radiation (Aleixandre-Tudo & Du Toit, 2020). The importance of this group of compounds in some of the quality attributes of wine leads to increasing demand for phenolic analysis during winemaking (Aleixandre-Tudo & Du Toit, 2020). The main groups of polyphenols present in wine are phenolic acids and flavonoids. Phenolic acids include benzoic acid, cinnamic acids and their derivatives. Flavonoid subclasses are flavanols (catechins and related compounds), flavonols (quercetin and their related glycosides), flavones (apigenin and luteolin), flavanones (naringenin) and isoflavones (genistein and daidzein) (Escarpa & González, 2001; Manach et al., 2004; Rosa et al., 2010). Condensed flavanols are referred to as tannins or procyanidins and form an important group of polyphenolic compounds in wine, and are present in grape seeds and grape skins. These compounds contribute to the bitterness and astringency of wine. In wine, catechin, epicatechin and epigallocatechin occur as flavanols. All these compounds have a common structure containing one or more aromatic nuclei substituted by a hydroxyl group (Fic, 2015). These compounds play an important role in plants, where they act as protectors against UV radiation and are essential components of pigments (Hurtado-Fernández et al., 2010). Flavanols contribute to the oxidative stability and organoleptic properties (e.g. bitterness and astringency) of wine (Hurtado-Fernández et al., 2010).
Flavanols have multiple biological properties, e.g. cardioprotective, anti-inflammatory, antiallergenic, antiviral, antibacterial and anticarcinogenic. These characteristics can be attributed mainly to their strong antioxidant and antiradiation activity (Seruga et al., 2011), which is related to the redox properties of polyphenols. The total required daily intake of polyphenols is estimated at 1 g, which is higher than the intake of antioxidant vitamins. Due to their high antioxidant activity, they play an essential role in reducing and neutralising free radicals (Casella et al., 2007; Fic, 2015). Their use is widespread in the food industry, pharmacy and cosmetics (Kovachev et al., 2010).
As already mentioned, phenolic compounds contribute to the organoleptic properties of wine, as well as to their taste and colour. These attributes are affected by grape variety, viticultural practices, grape ripeness, vinification and ageing. Chemical reactions occur during the ageing of wines in wooden barrels, which change the chemical composition of the wine. This results in changes in the organoleptic properties of the wine, which can improve their sensory perception (Chira et al., 2011). Coloured compounds stabilise, and there is a decrease in astringency, while spontaneous clarification occurs and the aroma of substances released from wood are enriched (Apetrei et al., 2007).
The phenolic compounds present in wines are primarily benzoic acid and cinnamic acid, as well as stilbenes and flavonoids. These compounds form complexes through condensation, glycosylation and polymerisation during wine maturation, and this can lead to polyphenolic structures, in which the relevant contributors are gallic acid polymers, anthocyanins (3-O-glucoside derivatives of anthocyanins), stilbene dimers (viniferin and pallidol), esters of tartaric acid from cinnamic acid, and proanthocyanidins (condensed tannins resulting from condensation reactions of flavanols, anthocyanins and/or phenolic acid monomers) (Bravo, 1998; Manach et al., 2004; Cheynier, 2005; Monagas et al.,, 2005; Jackson, 2008). Precursors of these compounds are found mainly in the seeds and epidermal cells of grapes (Pandey & Rizvi, 2009; Kim & Hwang, 2014; Zhang et al., 2014). Their content depends on the grape variety, climatic conditions, soil type and viticultural practices. The normal value of total polyphenols in red wine ranges from 1.8 to 4.06 g/L, while in white wine it ranges from 0.16 to 0.33 g/L (Granero et al., 2010). White wines do not have large quantities of polyphenols because white wines are usually made from free-running juice without grape must and skin contact (Robles et al., 2019).
Recent studies have investigated the polyphenol content of wine, as well as the changes in polyphenol content during storage; however, in these studies, conclusions are often evaluated based on a small number of wines made from the same batch of grapes under experimental conditions (Sun et al., 2011; Gambuti et al., 2013; Bimpilas et al., 2015; Aleixandre-Tudo & Du Toit, 2020).
The aim of this study was to monitor the evolution of the phenolic content of selected white wine samples from Moravia during wine storage of one, six and 12 months. The idea was that this study could provide useful benefits for wine producers, potentially extending knowledge of the content and evolution of the phenolic compounds of different white wine grape varieties.
MATERIALS AND METHODS
Wine samples
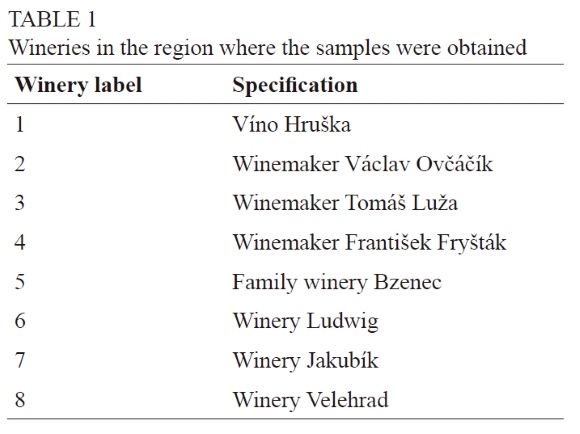
Samples of 13 different white grape wine varieties were selected from eight commercial wine cellars in the subregions Slovácká and Velkopavlovická (region Moravia). Wine samples were obtained from the wineries listed in Table 1. All these wineries followed the same winemaking protocol. The Moravia region of the Czech Republic is characterised by suitable conditions for vine growing and wine production; it represents approximately 96% of the registered vineyards in the country. The average annual minimum temperature is 8.36°C, the average annual rainfall is 510 mm, and the average annual duration of sunshine is 93.5 days (Setka et al., 2018). Thirty-five wine samples (13 varieties from eight wineries) were selected for the analysis. The characteristics of the samples are given in Table 2.
Reagents and chemicals
The chemicals used for the analyses were of analytical grade quality. The appropriate standards and solvents that were needed were purchased. The following chemicals and reagents were used: acetic acid (Merck KGaA, Darmstadt, Germany), acetonitrile (Merck KGaA, Darmstadt, Germany), Folin-Ciocalteau reagent (Penta, Prague, Czech Republic), sodium carbonate (Penta, Prague, Czech Republic), ethanol (Penta, Prague, Czech Republic), sodium nitrite (Penta, Prague, Czech Republic), aluminium chloride hexahydrate (Ing. Petr Lukeš, Uherský Brod, Czech Republic), and sodium hydroxide (Ing. Petr Lukeš, Uherský Brod, Czech Republic). Reference standards include catechin derivatives, vanillic acid (Extrasynthesis, France), syringic acid, coumaric acid, resveratrol (TCI, Tokyo Chemical Industry), rutin trihydrate (Carl Roth, Dr Ehrenstorfer, Germany), 4-hydroxybenzoic acid (Fluka, Germany), and other phenolic substances (Aldrich/Merck, Germany).
Sampling
For the wine sampling, the standard ČSN 56 0216 method of testing for wine made from grape juice, Tokay wine and malt wine was used. This Czech technical standard applies to the sampling and testing of natural, sparkling, dessert and spicy grape wines, Tokay wines and malt wines of domestic and foreign origin. The ČSN standard comprises standardised methods and describes the procedure for performing standardised tests. The standard sets out the procedures for carrying out certain tests (methods) to detect and/or verify quality characteristics relevant to nutritional hygiene. For wines in consumer packaging, a sample is taken from the sampled unit by random selection. According to the ČSN 56 0216, as many packages (bottles) are taken as needed to perform the tests, and one batch of each wine is always taken. The laboratory sample used a volume of 700 mL, which is the standard volume of one bottle of wine. Sampling took place at the cellars. The wine bottles were stored under the prescribed conditions in the wine cellars, with controlled temperatures that were recorded. The temperature was measured continuously and was set at 12°C. It was constant throughout the measurement, with a deviation of up to 5%. At the analysis facility, individual bottles were opened as needed, and the corresponding analyses were carried out immediately to avoid unnecessary and lengthy handling of the wine.
Wine analysis
The biologically active and sensorily important substances and their changes during storage were monitored. The control wine samples (zero months) were analysed immediately after opening, and the analyses were repeated after one, six and 12 months of storage. The 2018 wines were analysed only at one and six months due to time constraints.
Determination of individual phenolic compounds
High-performance liquid chromatography with a diode array detector (HPLC-DAD) was used to separate and identify individual phenolic compounds in the wines.
Before the measurement, the wine samples were diluted with distilled water (DW) in a ratio of 1:10 (wine:DW) and then filtered through nylon microfilters (0.45 μm nylon syringe filter). The determination was performed by reverse-phase high-performance liquid chromatography (RP-HPLC) on an UltiMate® 3000 instrument (Dionex, Sunnyvale, CA, USA) with a DAD using a Kinetex C-18 column (150 mm x 4.6 mm; 2.6 μm) (Phenomenex, Torrance, CA, USA). Gradient elution was performed using mobile phases comprising eluent A - distilled water/acetic acid (99:1, v/v) and eluent B - distilled water/acetonitrile/acetic acid (67:32:1, v/v/v). The gradient programme was 0 to 10 min: 90% A + 10% B; 10 to 16 min: 80% A + 20% B; 16 to 20 min: 60% A + 40% B; 20 to 25 min: 50% A + 50% B; 25 to 27 min: 60% A + 40% B; 27 to 35 min: 90% A + 10% B. The flow rate was 1 mL/min, with an injection volume of 10 μL, and the analysis time 35 min. Detector responses were recorded at 275 nm as described by De Quirós et al. (2009). Twenty-two individual phenolic compounds were separated and identified. However, only groups of selected substances are described in the text and in the results. Due to the large scope of analysis, the listing of individual phenolic compounds for each sample would mean a disproportionate extension of this scientific work.
• Phenolic acids
- Benzoic acid derivatives (expressed as the sum of gallic, vanilla, syringic, protocatechuic, ellagic and 4-hydroxybenzoic acid, and protocatechuic acid ethyl esters)
- Cinnamic acid derivatives (expressed as the sum of trans-cinnamic, ferulic, caffeic, hydroxycinnamic, chlorogenic, neochlorogenic, sinapic and p-coumaric acids)
• Flavonoids
- Flavonols (expressed as the sum of quercetin, rutin and kaempferol)
- Flavanols (expressed as the sum of epigallocatechin, epicatechin and catechin)
• Stilbenes
- (expressed as resveratrol)
Qualitative evaluation was performed on the standards analysis of individual polyphenolic compounds. Quantitative evaluation, in which the final value is determined as the average of six measurements (n = 6), was performed using a calibration curve and the subsequent calculation of the concentration of the substance in the sample. The individual polyphenol content was expressed as the equivalent concentration of mg of standard in 1 L of the sample.
Determination of total phenolic content
To determine the total phenolic content, a spectrophotometric method using Folin-Ciocalteau reagent was applied. This method is based on the reduction of a complex mixture of phosphoric-tungstic acid and phosphoric-molybdic acid with phenolic substances in an alkaline medium. A modified method was used for analysis (Singleton & Rossi, 1965; Sumczynski et al., 2015). The determination was performed at a wavelength of 765 nm after 30 min of incubation.
The volume of 0.5 mL of the sample and 5 mL of distilled water was pipetted into a 10 mL volumetric flask, followed by 0.5 mL of Folin-Ciocalteu reagent and 1.5 mL of 20% sodium carbonate. Finally, the volumetric flask was filled with distilled water to a volume of 10 mL. This was followed by incubation at 20°C for 30 min. The resulting colour reaction product (blue) was measured with a Lambda 25 UV/VIS spectrometer (PerkinElmer, Waltham, MA, USA). The blank consisted of 5 mL of distilled water, 0.5 mL of Folin-Ciocalteu reagent and 1.5 mL of 20% sodium carbonate The above mixture was used as a blank, where the sample was replaced with water. The total polyphenol content was evaluated by recalculation from the calibration curve to the gallic acid standard. The results were expressed in mg of gallic acid equivalent (GAE)/L of the sample.
Determination of total flavonoid content
The determination of the total flavonoid content was performed spectrophotometrically according to a modified method by Li et al. (2009) and Saeed et al. (2012).
A volume of 0.425 mL of wine sample and 4.25 mL of 20% ethanol was pipetted into a test tube. Then 0.19 mL of 0.5 M NaNO2 was added to the mixture. Into this mixture, 0.19 mL of 0.3 M AlCl3.6H2O was added after 5 min, and the solution was incubated at 20°C for 5 min. This process was followed by the addition of 1.25 mL of 1 M NaOH. The mixture was allowed to stand for 10 min. Subsequently, the solution was measured at a wavelength of 506 nm on a Lambda 25 spectrometer.
For evaluation, the calibration curve method to the routine standard was used. The results were expressed in mg of rutin equivalent (RE/L) of the sample.
Statistical evaluation
The data obtained was expressed as arithmetic mean ± standard deviation. All analyses were performed twice in triplicate. The values of the Pearson correlation coefficients (r) and the methods described by Snedecor and Cochran (1994) were calculated to detect the linear dependencies between different quantities determined by different methods. The statistical methods used included the analysis of variance (ANOVA, α = 0.05), which examines whether there is a statistically significant difference between at least two mean values.
RESULTS AND DISCUSSION
Identification and determination of individual phenolic compounds
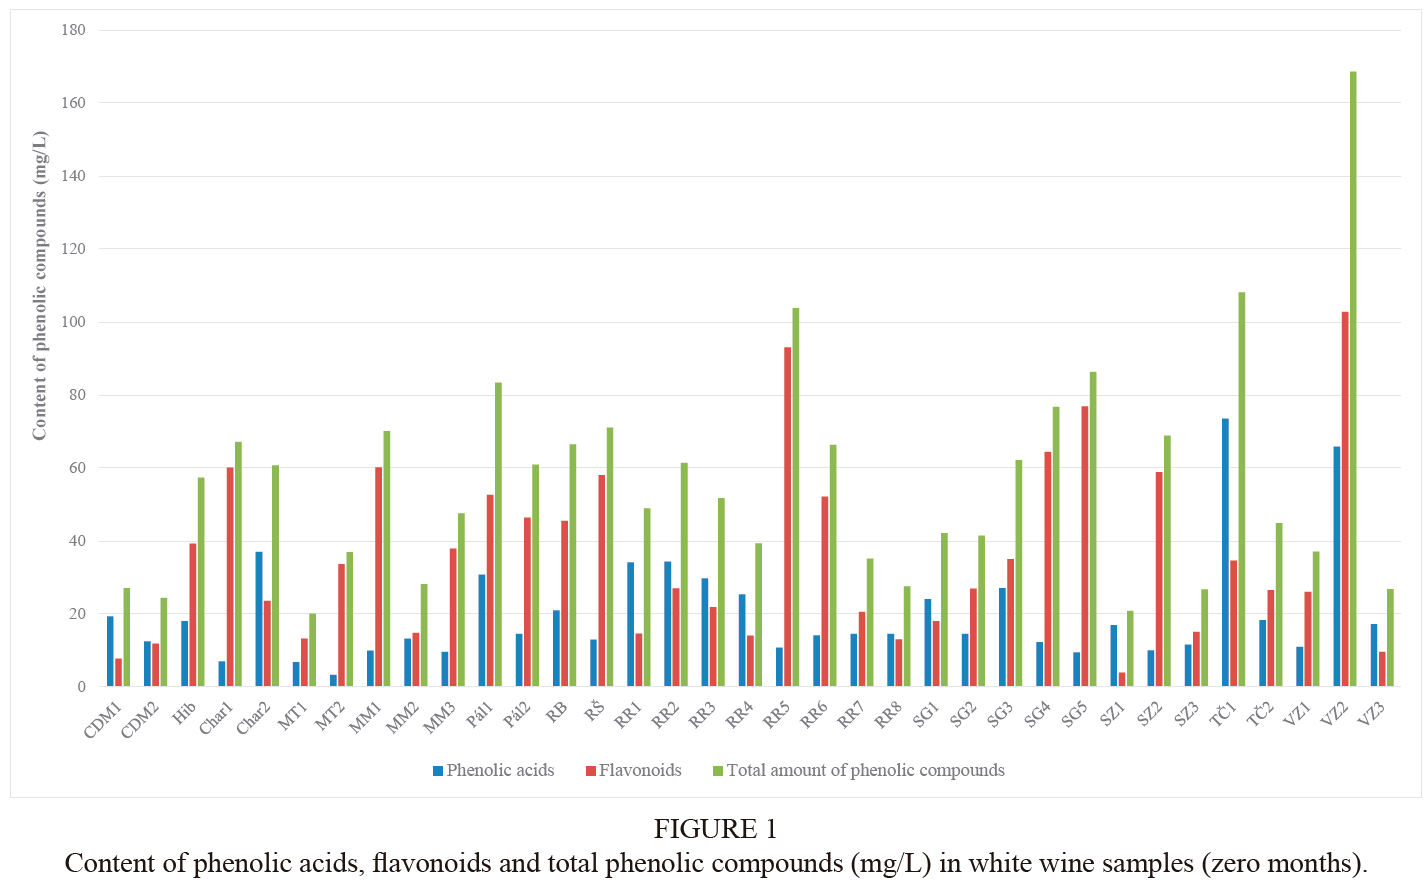
The total concentration of individual phenolic compounds detected in the white wines ranged from 20.08 mg/L to 168.62 mg/L, of which phenolic acids accounted for 3.29 mg/L to 65.87 mg/L and flavonoids 3.94 mg/L to 102.75 mg/L. The order of individual groups according to their content in wine was as follows: flavanols > benzoic acid derivatives > cinnamic acid derivatives > flavonols > stilbenes.
The average content of phenolic compounds in the white wine samples was 56.18 mg/L, with an average of 51.71 mg/L. VZ2 (2016) wines had the highest concentration of phenolic compounds. Among the samples of the given variety, VZ2 contained up to five times the value of the total content of phenolic compounds (this is the sum of the compounds listed in Table 3). Thus, 35% fewer phenolic compounds (108.11 mg/L) were found in the TČ1 samples (2003). The third sample that exceeded the content limit of one hundred was RR5 (2015). All these samples - VZ2, TČ1 and RR5 - came from the Slovácko winegrowing subregion, and the last two, TČ1 and RR5, were from neighbouring winegrowing villages. The lowest concentration of phenolic compounds was found in samples MT1 of 2015 and SZ1 of 2014, which contained only 11.91% to 12.38% of the highest measured content and only 36% of the calculated average content.
In the group of phenolic acids, including benzoic and cinnamic acid derivatives, a wide range of concentrations were found, viz. 3.29 mg/L to 73.49 mg/L, with an average value of 20.16 mg/L and a low average of 14.53 mg/L. The highest concentration was detected in sample TČ1 (73.49 mg/L), followed by the VZ2 sample (65.87 mg/L). The next sample in the order with a high quantity was Char2, which was up to 50% lower in phenolic acid content than the best-rated TČ1 wine. The lowest concentration of phenolic acids was found in the MT variety in both samples.
Flavonoids (including flavonols and flavanols) occurred in the white wine samples with an average content of 36.00 mg/L and a lowest average of 27.02 mg/L. Therefore, flavanols were the most abundant phenolic compounds with the highest specified contents, which was a trend seen in all tested samples. The highest flavonoid content was determined in sample VZ2 (102.75 mg/L). Flavanols were highest, at 100.48 mg/L, and flavonols were only 1/50 of the content (2.27 mg/L). It is interesting to note that sample VZ2 contained five to 10 times more flavonoids among samples of the same variety (VZ1, VZ3). Sample RR5 had a flavonoid content of 93.03 mg/L. The lowest value was determined in sample SZ1 (3.94 mg/L).
In the group of flavonoids, epigallocatechin levels were the highest. For all wine samples, this was in the order of tens of mg/L of epigallocatechin. The highest content of epigallocatechin was determined in sample RR5 (86.81 mg/L). Another flavanol was catechin, with a concentration of units up to tens of mg/L. The highest concentration was determined in sample VZ2 (46.73 mg/L). Quercetin, rutin and kaempferol from the group of flavonols, and epicatechin from the group of flavanols were the least present in the samples, with concentrations of up to tenths of mg/L.
From the group of phenolic acids, the most common in the wines were benzoic acid derivatives (tens of mg/L), with gallic acid > protocatechuic acid > syringic acid > 4-hydroxybenzoic acid > protocatechuic acid ethyl ester > ellagic acid > vanillic acid. The average content of benzoic acid derivatives was 11.65 mg/L, with a lowest median of 7.43 mg/L. A decreased average of 8.51 mg/L, with a similar median, was determined for cinnamic acid derivatives. Kapusta et al. (2018) analysed the phenolic content of Hibernal grapes and reported an average of 0.82 mg/L, which is lower than the quantity in the samples examined in this investigation, viz. 1.34 mg/L, although the phenolic content of wine may be affected by grape variety, climatic and geological conditions, diseases and pests, viticultural practices, vinification processes and maturation. Of the cinnamic acid derivatives, caffeic acid and p-coumaric acid were the most abundant in the samples. The remaining acids, viz. t-cinnamic, hydroxycinnamic, ferulic, chlorogenic and neochlorogenic acids, were below the limit of detection.
Stilbenes were determined in 16 out of 35 samples. Its content was only in hundredths of mg/L. The stilbenes were represented more in the RR1 and RR3 samples, at 0.09 mg/L and 0.15 mg/L respectively, Char2 (0.08 mg/L) and MM2 (0.08 mg/L). The values of resveratrol were comparable to those reported by Leblanc et al. (2008) and Natividade et al. (2013), who found the concentration of this compound in white wine from different cultivars and regions of origin and processed by different processes to range from below the limit of detection to 0.44 mg/L.
A concentration of 0.03 mg/L of stilbene was determined in the cuvée samples of the varieties CDM1 and CDM2. The Muškát moravský variety can be considered as its source, because this compound was determined in the samples MM2 and MM3, in contrast to other samples in which it was not detected. Another factor for its presence may be the origin of the given variety; it was a wine produced by one winery (winery 1, Slovácko subregion).
The best-rated sample, i.e. the one with the highest content of phenolic compounds, was VZ2 2016. It reached up to five times higher values of total phenolic content compared to the identical varieties, viz. VZ. The values determined for this sample were up to 1/3 higher than the other best-rated samples, viz. TČ1 (2003) and RR5 (2015).
The average content of phenolic compounds in the white wine samples was 56.18 mg/L, with a decrease after six months of storage to 51.07 mg/L and after one year of storage to 42.27 mg/L. The average decrease in phenolic compounds in the white wines was 24.75% after 12 months of storage. The decrease also depended on the variety, with the lowest reduction determined for the Sauvignon blanc variety, viz. 17.5%, while the most significant decrease was for the Müller Thurgau variety, at 46%.
Table 3 shows the content of benzoic and cinnamic acid derivatives, flavonols, flavanols and stilbenes in the wines. Sample VZ2 was highest in benzoic acid derivatives and flavanols. The sample TČ1 had the highest concentration of the sum of benzoic and cinnamic acids. This sample also had the second-highest content of phenolic compounds. Sample SG5 had the third highest concentration of total phenolics, mostly due to flavanols. Table 3 lists the stilbenes quantified in the wine samples. Sample RR1 had the highest concentration of stilbenes. The remaining samples were below the limit of detection or about 10-fold lower than sample RR1. The graphical representation of the important groups of cumulative phenolic compounds in the samples is shown in Fig. 1. An overview of the concentration of individual phenolic compounds in the wine samples is presented in Tables 4 to 7.
Determination of the total polyphenols content
The values of the total polyphenol content in the selected samples are listed in Table 8. At zero months, the average total polyphenol content in the 35 samples was 286.71 mg GAE/L, with a similar median. The highest concentration was determined in sample TČ1, at 503.7 mg GAE/L, which is more than 1.3 times the value of sample SG3. Only sample TČ1 maintained higher values up to one year of storage compared to the rest of the samples. Sample SZ1 was higher in total polyphenols at after 12 months of storage than sample SG3. Within the varieties, the samples of Tramin červený (TČ1 and TČ2) had the highest average, while the lowest average was measured for Ryzlink (RR1 to RR8). Overall, the lowest polyphenol contents were found in sample SZ3.
Paixao et al. (2007) evaluated the total polyphenol content in Portuguese white wines and found an average content of 369 mg GAE/L. A study by Hurtado et al. (1997) reported the average content in white wines as 292 mg GAE/L. These published values are comparable with the contents measured in this study. The results of the work of Ricci et al. (2017) for Sauvignon grape varieties with a reported value of 222 mg GAE/L are similar to the values reported in this study for SG2 and SG3, which were 260.82 mg GAE/L and 373.39 mg GAE/L, respectively.
These results show a decreasing trend in the measured intervals (zero, one, six and 12 months) for total polyphenols. Between zero months and one month, the content of polyphenols decreased by an average of 3.2%, and between one month and six months, the value decreased by 3.79%. After six months, all wine samples showed an average decrease of 6.87% compared to the control samples (zero months). From six to 12 months, the content decreased by an average of 5.46% and, overall, the total polyphenol concentration after one year of storage was 11.96% lower on average than that of the control samples or the levels at one or six months. The graphical representation of these changes is shown in Fig. 2.
The highest decrease in total polyphenols occurred during storage from six to 12 months in samples CDM1 (15.13%), Hib (11.41%), RR4 (24.66%), RR5 (15.13%) and RR7 (18.61%). Samples Char1 (1.86%), Pál1 (2.36%), RR1 (1.82%) and RR3 (2.40%) had the lowest decrease in total polyphenols between six and 12 months. The largest difference in the decrease in total polyphenol content between the same varieties was found in the samples of Pálava (Pál1 by 9.42%, Pál2 by up to 20.95%).
For the tested wines of 2018, there was a decrease in total polyphenol content by up to 10% (6.69% to 9.57%) when only an interval of six months was measured. In comparison, a decrease of up to 13% occurred in wines of the 2011 vintage, viz. 5.93% to 12.75%.
Determination of the total flavonol content
The values of the total flavonol content in the samples and their changes are shown in Table 9. At the beginning of the measurement, the average quantity of flavonols in the samples was 281.44 mg RE/L, with a median of 273.24 mg RE/L.
The highest concentration at zero months was measured in sample MM3 (496.21 mg RE/L), which is almost four times the flavonol value of wine with the lowest content -RR4 (120.81 mg RE/L).
Li et al. (2009) reported a flavonol value in samples of white wines originating from China in the range of 31 mg RE/L to 242 mg RE/L. The highest published values are similar to the average value determined in the current study, but the published average of 87.23 mg RE/L represents approximately 1/3 of our average values. Ivanova et al. (2010) reported an average flavonoid content in the Ryzlink variety of 71.00 mg RE/L, which represents a third of the content found in our results. This may be due to the differences in production methods and regional practices, as these wines were produced in the Balkans, specifically in Macedonia. The nature and concentration of flavonols in wine can also be affected by the grape variety and the disruption (grinding, crushing, etc.) of the grapes at the time of harvest (Rupasinghe & Clegg, 2007).
Flavonoid contents were also affected by storage. After one month, the levels decreased by 3.69%, in the next six months by 8.57%, and after 12 months it had decreased by 9.89% below the initial value. The graphical representation of these differences is shown in Fig. 3.
The best-rated sample, viz. MM3, had the highest concentration of flavonols, and the lowest concentration was found in sample RR4. The storage effect was most pronounced in the Müller Thurgau (MT2) variety, with the largest decrease among the samples of 20.86%, followed by sample MT1, with a decrease of 20.45%. The variety with the least reduction in flavonols was Ryzlink (RR1 to RR8), where the RR2 sample decreased by only 2.52%, which is the least of all the samples. On average, this variety had an annual decrease of 9.86% and an average value of 241.88 mg RE/L, which correlates with the average decrease of all samples. This was followed by the variety Tramín červený, which was represented by only two samples (TČ1 and TČ2), but the average annual decrease was 6.81%, the least among the monitored varieties.
CONCLUSIONS
In this study, different commercial white wine varieties from the Slovácko and Velkopavlovická winegrowing subregions were revealed to be a source of phenolic compounds, which form an essential part of wine organoleptic and antioxidant properties. The results obtained show that the content of individual phenolic compounds in the white wines depended on the variety and the duration of storage.
In general, no significant differences were observed in the phenolic composition of the samples. The highest total concentration of individual phenolic compounds was detected in the Veltlínské zelené wine variety, followed by Tramín červený and Ryzlink rýnský. Most of the phenolic compounds were formed by flavonoids, especially flavanols, which had the highest contents in all samples. The concentration of total polyphenols and total flavonoids in the samples gradually decreased after one, six and 12 months 1 The results obtained show that the concentration of the phenolics measured is dependent on the variety and the storage period. On the other hand, it should be noted that all samples used in the survey originated from one region. The findings of this study are therefore restricted to a specific region and grape variety. It is recommended that wines from different regions, but from the same grape variety, are analysed to compare the effect of bottle ageing on the concentration of phenolic compounds.
LITERATURE CITED
Aleixandre-Tudo, J.L. & Du Toit, W., 2020. Evolution of phenolic composition during barrel and bottle aging. S. Afr. J. Enol. Vitic. 41(2), 233-237. [ Links ]
Apetrei, C., Apetrei, I.M., Nevares, I., Del Alamo, M., Parra, V., Rodríguez-Méndez, M.L. & De Saja, J.A., 2007. Using an e-tongue based on voltammetric electrodes to discriminate among red wines aged in oak barrels or aged using alternative methods: Correlation between electrochemical signals and analytical parameters. Electrochim. Acta 52(7), 2588-2594. [ Links ]
Bimpilas, A., Tsimogiannis, D., Balta-Brouma, K., Lymperopoulou, T. & Oreopoulou, V., 2015. Evolution of phenolic compounds and metal content of wine during alcoholic fermentation and storage. Food Chem. 178, 164-171. [ Links ]
Bravo, L., 1998. Polyphenols: Chemistry, dietary sources, metabolism, and nutritional significance. Nutr. Rev. 56(11), 317-333. [ Links ]
Casassa, F.L. & Harbertson, J.F., 2014. Extraction, evolution, and sensory impact of phenolic compounds during red wine maceration. Annu. Rev. Food Sci. Technol. 5(1), 83-109. [ Links ]
Casella, I.G., Colonna, C. & Contursi, M., 2007. Electroanalytical determination of some phenolic acids by high-performance liquid chromatography at gold electrodes. Electroanalysis 19(4), 1503-1508. [ Links ]
Cheynier, V., 2005. Polyphenols in foods are more complex than often thought. Am. J. Clin. Nutr. 81(1 Suppl), 223S-229S. [ Links ]
Chira, K., Pacella, N., Jourdes, M. & Teissedre, P.L., 2011. Chemical and sensory evaluation of Bordeaux wines (Cabernet-Sauvignon and Merlot) and correlation with wine age. Food Chem. 126(4), 1971-1977. [ Links ]
De Quirós, A., Lage-Yusty, R.B. & López-Hernández, M.A., 2009. HPLC analysis of polyphenolic compounds in Spanish white wines and determination of their antioxidant activity by radical scavenging assay. Food Res. Int. 42(8), 1018-1022. [ Links ]
Escarpa, A. & González, M.C., 2001. An overview of analytical chemistry of phenolic compounds in foods. Crit. Rev. Anal. Chem. 31, 57-139. [ Links ]
Fic, V., 2015. Wine: Analysis, technology, gastronomy [In Czech]. 2 Theta, Ceský Tësín, Czech Republic. [ Links ]
Gambuti, A., Rinaldi, A., Ugliano, M. & Moio, L., 2013. Evolution of phenolic compounds and astringency during aging of red wine: Effect of oxygen exposure before and after bottling. J. Agric. Food Chem. 61(8), 1618-1627. [ Links ]
Granero, A.M., Fernández, H., Agostini, E. & Zón, M.A., 2010. An amperometric biosensor based on peroxidases from Brassica napus for the determination of the total polyphenolic content in wine and tea samples. Talanta 83(1), 249-255. [ Links ]
Hurtado, I., Caldu, P., Gonzalo, A., Ramon, J.M., Minguez, S. & Fiol, C., 1997. Antioxidative capacity of wine on human LDL oxidation in vitro: Effect of skin contact in winemaking of white wine. J. Agric. Food Chem. 45(4), 1283-1289. [ Links ]
Hurtado-Fernández, E., Gómez-Roero, M., Carrasco-Pancorbo, A. & Fernández-Gutiérrez, A., 2010. Application and potential of capillary electroseparation methods to determine antioxidant phenolic compounds from plant food material. J. Pharm. Biomed. Anal. 53(5), 1130-1160. [ Links ]
Ivanova, V., Stefova, M. & Chinnici, F., 2010. Determination of the polyphenol contents in Macedonian grapes and wines by standardized spectrophotometric methods. J. Serbian Chem. Soc. 75(1), 45-59. [ Links ]
Jackson, R.S., 2008 (3rd ed). Wine science: Principles and applications. Elsevier, Burlington, NJ, USA. [ Links ]
Kadlec, P., 2002. Food technology. University of Chemical Technology, Prague, Czech Republic. [ Links ]
Kapusta, I., Cebulak, T. & Oszmiański, J., 2018. Characterization of Polish wines produced from the interspecific hybrid grapes grown in south-east Poland. Eur. Food Res. Technol. 244, 441-455. [ Links ]
Kim, D.S. & Hwang, B.K., 2014. An important role of the pepper phenylalanine ammonia-lyase gene (PAL1) in salicylic acid-dependent signalling of the defence response to microbial pathogens. J. Exp. Bot. 65(9), 2295-2306. [ Links ]
Kovachev, N., Canals, A. & Escarpa, A., 2010. Fast and selective microfluidic chips for electrochemical antioxidant sensing in complex samples. Anal. Chem. 82(7), 2925-2931. [ Links ]
Leblanc, M.R., Johnson, C.E. & Wilson, P.W., 2008. Influence of pressing method on juice stilbene content in Muscadine and bunch grapes. J. Food Sci. 73(4), 58-62. [ Links ]
Li, H., Wang, X., Li, Y., Li, P. & Wang, H., 2009. Polyphenolic compounds and antioxidant properties of selected China wines. Food Chem. 112(2), 454-460. [ Links ]
Manach, C., Scalbert, A., Morand, C., Rémésy, C. & Jiénez, L., 2004. Polyphenols: Food sources and bioavailability. Am. J. Clin. Nutr. 79(5), 727-747. [ Links ]
Monagas, M., Bartolomé, B. & Gómez-Cordovés, C., 2005. Updated knowledge about the presence of phenolic compounds in wine. Crit. Rev. Food Sci. Nutr. 45(2), 85-118. [ Links ]
Natividade, M.M.P., Correa, L.C., De Souza, S.V.C., Pereira, G.E. & De Oliveira Lima, L.C., 2013. Simultaneous analysis of 25 phenolic compounds in grape juice for HPLC: Method validation and characterization of São Francisco Valley samples. Microchem. J. 110, 665-674. [ Links ]
Paixao, N., Perestrelo, R., Marques J.C. & Camara, J.S., 2007. Relationship between antioxidant capacity and total phenolic content of red, rosé and white wines. Food Chem. 105(1), 204-214. [ Links ]
Pandey, K.B. & Rizvi, S.I., 2009. Plant polyphenols as dietary antioxidants in human health and disease. Oxid. Med. Cell. Longev. 2(5), 270-278. [ Links ]
Ricci, A., Parpinello, G.P. & Versari, A., 2017. Modelling the evolution of oxidative browning during storage of white wines: Effects of packaging and closures. Int. J. Food Sci. Tech. 52(2), 472-479. [ Links ]
Robles, A.D., Fabjanowicz, M., Płotka-Wasylka, J. & Konieczka P., 2019. Organic acids and polyphenols determination in Polish wines by ultrasound-assisted solvent extraction of porous membrane-packed liquid samples. Molecules 24, 1420-3049. [ Links ]
Rosa, L.A., Alvarez-Parrilla, E. & González-Aguilar, G., 2010. Fruit and vegetable phytochemicals: Chemistry, nutritional value and stability. Wiley-Blackwell, Ames, IA, USA. [ Links ]
Rupasinghe, H.P.V. & Clegg, S., 2007. Total antioxidant capacity, total phenolic content, mineral elements, and histamine concentrations in wines of different fruit sources. J. Food Comp. Anal. 20(2), 133-137. [ Links ]
Saeed, N., Khan, M.R. & Shabir, M., 2012. Antioxidant activity, total phenolic and total flavonoid contents of whole plant extracts Torilis leptophylla L. BMC Complement. Altern. Med. 12, 221. [ Links ]
Singleton, V.L. & Rossi, J.A., 1965. Colorimetry of total phenolics with phosphomolybdic-phosphotungstic acid reagents. Am. J. Enol. Vitic. 16, 144-158. [ Links ]
Snedecor, G.W. & Cochran, W.G., 1994 (8th ed). Statistical methods. Iowa State University Press, Ames, IA, USA. [ Links ]
Sumczynski, D., Bubelova, Z., Sneyd, J., Erb-Weber, S. & Mlcek, J., 2015. Total phenolics, flavonoids, antioxidant activity, crude fibre and digestibility in non-traditional wheat flakes and muesli. Food Chem. 174, 319-325. [ Links ]
Sun, B., Neves, A.C., Fernandes, T.A., Fernandes, A.L., Mateus, N., De Freitas, V., Leandro, C. & Spranger, M.I., 2011. Evolution of phenolic composition of red wine during vinification and storage and its contribution to wine sensory properties and antioxidant activity. J. Agric. Food Chem. 61(8), 1618-1627. [ Links ]
Seruga, M., Novak, I. & Jakobek, L., 2011. Determination of polyphenols content and antioxidant activity of some red wines by differential pulse voltammetry, HPLC and spectrophotometric methods. Food Chem. 124(3), 1208-1216. [ Links ]
Setka, M., Dvorak, I., Pfibyl, J., Novotný, J. & Süss, R., 2018. The best wines of the Czech Republic - Guide 2018/2019. WINE & Degustation, Czech Republic. [ Links ]
Valášek, P., Mlček, J., Fišera, M., Fiserová, L., Sochor, J., Baroň, M. & Juríková, T., 2014. Effect of various sulphur dioxide additions on amount of dissolved oxygen, total antioxidant capacity and sensory properties of white wines. Mitt. Klosterneuburg 64(4), 193-200. [ Links ]
Zhang, W.W., Li, J., Xu, F., Tang, Y., Cheng, S. & Cao, F., 2014. Isolation and characterization of a phenylalanine ammonia-lyase gene (PAL) promoter from Ginkgo biloba and its regulation of gene expression in transgenic tobacco plants. Plant Omics 7(5), 353-360. [ Links ]
Submitted for publication: September 2022
Accepted for publication: November 2022
* Corresponding author: mlcek@utb.cz
Acknowledgements: This study was funded by a project of the Internal Grant Agency of Tomas Bata University in Zlin, number IGA/FT/2023/003. The authors also gratefully acknowledge all the winemakers who provided the samples

