


Serviços Personalizados
Artigo
 Inglês (pdf)
 Artigo em XML
 Referências do artigo
Indicadores

Links relacionados
-
 Citado por Google
 -
 Similares em Google
Compartilhar

 Permalink
South African Journal of Enology and Viticulture
versão On-line ISSN 2224-7904
versão impressa ISSN 0253-939X
S. Afr. J. Enol. Vitic. vol.43 no.1 Stellenbosch 2022
http://dx.doi.org/10.21548/43-1-4960
ARTICLES
Data-driven Determination of Disease Markers' Threshold Values in Rot-affected Wine Grapes
Cornelissen R.J.I, IV; Kidd M.II; Aleixandre Tudo J.L.III, V; Nieuwoudt H.H.I, *
ISouth African Grape and Wine Research Institute, Stellenbosch University, Private Bag X1, Matieland, 7602, South Africa
IICentre for Statistical Consultation, Stellenbosch University, Private Bag X1, Matieland, 7602, South Africa
IIIDepartment of Viticulture and Oenology, Stellenbosch University, Private Bag X1, Matieland, 7602, South Africa
IVNamaqua Wines, P.O. Box 75, Vredendal, 8160, South Africa
VInstituto de Ingeniería de Alimentos para el Desarrollo (IIAD), Departamento de Tecnología de Alimentos (DTA), Unversitat Politecnica de Valencia (UPV), Valencia, Spain
ABSTRACT
Grapevine bunch rot is detrimental to grape and wine quality. Traditionally, detecting and quantifying the severity of rot infection is executed visually. This study aimed at defining local, area-specific threshold values of rot-associated disease markers. This is a first step towards making informed decisions about the quality of grapes delivered at winery intake. Viticulturists visually assessed on-vine rot infection in nine white wine grape cultivars. Results showed that severity ratings were consistent between assessors. Chemical analyses of the grape must from these assessed samples were done. Multiple factor analysis (MFA) showed that rot severity was positively correlated with glycerol, alcohol, gluconic acid and acetic acid concentrations. As severity increased, gluconic acid, glycerol, alcohol, Brix, acetic acid and total titratable acidity (TA) concentrations also increased. Following the probability chosen for sensitivity and specificity, grape rot indicators' threshold values in white grape must are as follow: Alcohol > 0.10 %v/v; acetic acid > 0.17 g/L; glycerol > 0.79 g/L; gluconic acid > 0.99 g/L; TA > 8.86 g/L. Statistical determined threshold values differentiating between rot-affected and healthy grape must, would eliminate the subjectivity and bias associated with visual assessments.
Keywords: sour rot, Botrytis cinerea, severity, disease markers, wine grapes, data-driven determination, threshold
INTRODUCTION
Rot infection of wine grapes
Grapevine bunches are prone to be attacked by several types of rot that pose a serious threat to the quality of the wine produced from affected grapes (Steel et al., 2013). Based on the dominant microbial pathogens associated with bunch rot, three main groups can be distinguished: Botrytis grape-rotting fungi, non-Botrytis grape-rotting fungi which include moulds and yeasts, and bacteria (Barata et al., 2008; Navarro et al., 2013; Ciliberti et al., 2015). However, the causes of rot can rarely be ascribed to a single microbial pathogen. In the natural environment, it is microbial co-habitation that most often leads to the berry chemical compositional changes associated with bunch rot (Lorenzini et al., 2018).
The metabolic-induced chemical changes in rot-affected grape berries are potential disease markers and could be present in the berries, grape must and wine. Glycerol formation from grape sugars has previously been shown as a key metabolic pathway induced in grapes upon Botrytis cinerea (B. cinerea) infection (Ravji et al., 1988). Ethanol formation is associated with the presence of yeasts in rot-affected grapes. Yeasts carry out alcoholic fermentation through utilisation of the grape sugars (Goold et al., 2017). In addition to ethanol production, oxidative yeasts, for example Aureobasidium, Candida, Pichia and Hanseniaspora species, can metabolise glucose to gluconic acid (Barata et al., 2008; Cañete-Rodríguez et al., 2016). The bacterial genera Acetobacter and Gluconobacter can further oxidise ethanol to acetaldehyde as an intermediary compound and eventually to acetic acid (Qiu et al., 2021). Acetic acid bacteria also synthesise acetic acid from glucose (Qiu et al., 2021) and produce gluconic acid, as well as SO2 binding products in botrytis-infected grape must (Barbe et al., 2001; Sainz et al., 2016).
Cultivar susceptibility to rot infections is influenced by genetic factors (Molitor et al, 2012; Weiller et al., 2021). For example, thin-skinned cultivars like Chardonnay (Winkler et al, 1974) and Kovérszóló (Furdíková et al, 2019), as well as tightly clustered cultivars like Chardonnay, Chenin blanc and Sauvignon blanc (Tello & Ibáñex, 2018) are particularly susceptible to rot infections. However, climate and vineyard canopy management practices influence the seasonal intensity of rot infections. Vigorous and dense canopies are inducive to rot infection (Valdés-Gómez et al., 2008; VanderWeide et al., 2019). Extended wet periods after precipitation create a humid microclimate around bunches, which favours rot.
Detection of rot infection in wine grapes
Traditionally, rot detection and severity quantification are estimated by visual inspection in the vineyard or at intake of harvested grape loads at the winery weighbridge (Longbottom et al., 2013; Beghi et al., 2017). However, visual assessment has several disadvantages. Routine visits by viticulturists to examine vineyards for rot infection are not a practically and/ or sustainable solution for large wineries. Latent infections could also go unnoticed, even if the chemical composition of the grapes has been affected (Versari et al., 2008). Furthermore, assessment of grape loads at winery intake is complex, especially for mechanically harvested grapes (Versari et al., 2008). Mechanical harvesting damage the structural integrity of grape berries. Grape loads are delivered as shapeless masses consisting of juice, berry skins and pulp, which complicates the visual assessment accuracy.
In contrast to the traditional subjective method of grape rot assessment, more recent research explores objective, faster, cost-effective, and more sustainable approaches. In the limited existent body of published literature on this topic, spectroscopic methods feature strongly. Beghi et al. (2017) used visible/near-infrared (Vis/NIR) spectroscopy to discriminate between healthy and rot-affected bunches at winery intake. Dambergs et al. (2018) explored the detection of rot infection on individual berries and bunches using hyperspectral imaging.
Subjective grape rot assessments lead to mistrust and disputes between grape producers and wineries. Standardised and objective assessment methods, delivering quantifiable and repeatable results, will increase transparency and the confidence that assessments are applied fairly (Longbottom et al, 2013).
Local data-driven determination of grapevine bunch rot infection
An industry-specific challenge relates to determining a threshold value above which rot infection has detrimental effects on grape quality. The use of must chemical composition for evaluating grape quality at harvest was explored previously. A so-called global grape sanitary index (Foss, 2002) based on Fourier transform infrared (FTIR) spectroscopy (WineScan FT 120 instrument, Foss Analytical, Denmark) was evaluated on grapes at winery intake (Fischer & Berger, 2007; Barata et al., 2011). However, the global and generic index could not be modified or adjusted to fit users' local conditions, thereby limiting its applicability. These findings underpin the need for a data-driven strategy where the ruling climate, specific cultivars, and natural conditions under which rot infection develops have been considered.
The study aimed to define local, area-specific threshold values of rot-associated disease markers as a first step towards the informed management of grape quality at winery intake.
MATERIALS AND METHODS
Sample collection and grape rot severity assessment
Grape samples were sourced from 2013 to 2019 from a producer winery's commercial vineyards in the Olifants River and Cape Coastal Wine of Origin regions, Western Cape, South Africa. Single cultivar vineyard blocks where rot occurred naturally were selected, as identified during pre-harvest visits by the winery's viticulturists. With the overall aim to define area-specific threshold values, grapes from various cultivars grown in the area under investigation and different berry ripening stages were sampled.
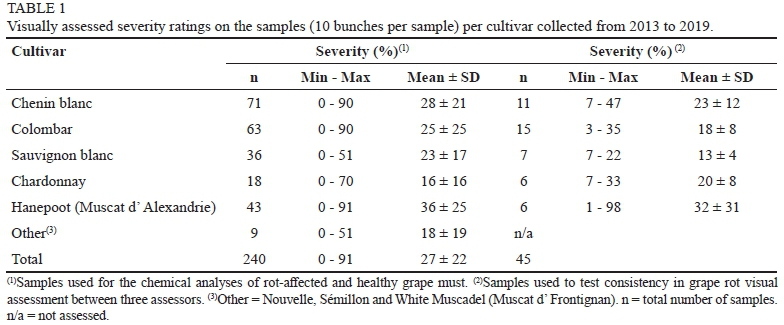
The main cultivars included in this study were Chenin blanc (SN), Colombar (CO), Sauvignon blanc (SB), Chardonnay (CY) and Hanepoot (Muscat d' Alexandrie) (HP). Samples designated Other (in Table 1) referring to other cultivars not specified, were also included, albeit at low numbers. The dataset included rot-affected, as well as healthy samples which did not display visual disease symptoms. Only white wine grape cultivars were selected because these cultivars account for approximately 85% of the participating regions' production and 72% of the regions' total hectares (SAWIS, 2019).
The berry ripening stages were identified according to the modified Eichhorn-Lorenz (E-L) system described by Coombe (1995). Samples were collected at any of three E-L berry developmental stages; 36, 37 or 38. Briefly, Stage 36 denotes berries with intermediate sugar levels (just after veraison), Stage 37 describes berries as not quite ripe, and Stage 38, berries are harvest-ready. It is important to note that the harvest-readiness of grapes is determined by the intended wine style (Poni et al, 2018). For example, for low alcohol wines (9 %v/v), grapes could be harvest-ready between Stages 36 and 37, or as the grapes reach Stage 37. In contrast, a full-bodied cultivar wine is harvest-ready only when Stage 38 is reached. Furthermore, early harvesting (before Stage 38) is sometimes employed to stop the spread of rot to other parts of the vineyard block or adjacent blocks (Molitor et al., 2016). Hence, the collection of samples at various ripening stages was done in this study to include different scenarios encountered under industrial conditions.
One viticulturist randomly selected grape bunches from two vineyard rows per block. Grape rot severity appraisal was completed in-field by the same viticulturist collecting the sample. Visually, botrytis rot is characterised on affected bunches by Botrytis mycelium on the berry surface, dehydration of berries, and occurrence of so-called slip-skins on the berries (Hill et al., 2010; Hill et al., 2017). Slip-skin refers to the berry skin that easily slips from the pulp when touched. Sour rot is distinguished by a tan to reddish discolouration of rotten berries and juice dripping from affected berries onto ones positioned lower in the bunch. The presence of fruit flies also indicates sour rot (Hall et al., 2017).
Each bunch was assessed as rot-affected or healthy. To determine the severity of rot infection, the viticulturist inspected the whole bunch, and the percentage area that was visually affected was visually estimated and recorded. The severity per sample was calculated as described by Hill et al. (2010): S = ESi/n, where Si = severity for the ith bunch and n = the total number of bunches assessed. Viticulturists had at least five years of industrial experience assessing grape quality, including the assessment of rot infection severity. No additional severity assessment training was provided.
A workflow similar to the internal winery procedures for testing sugar concentration per vineyard block was followed. One sample consisted of ten pooled grape bunches, hand-picked from both sides of the canopy, using a secateur. Two hundred and eighty-five samples (2 850 individual bunches) were collected (Table 1). Industrial datasets present challenges. One such challenge was the inconsistent participation of viticulturists through the vintages. With this in mind, 45 samples with varying degrees of rot infection were collected with the specific objective of testing consistency in grape rot visual assessment between assessors (Table 1).
Chemical analyses of grape must
Samples were placed in plastic bags, kept below 20°C and transported back to the on-site winery chemical laboratory to be processed by a standardised workflow for chemical analyses. Upon receipt at the laboratory, the grape samples (consisting of 10 bunches each) were immediately pressed by hand. The juice, from here referred to as grape must, was separated from the skins and pips. Same-day chemical analyses were performed to prevent storage-induced chemical changes to the grape must (Baiano et al., 2012).
Maturity parameters
The grape maturity analyses were done according to International Organisation of Vine and Wine (OIV) standards and included sugar concentration, also known as total soluble solids (TSS, measured as °Brix), pH and total titratable acidity (TA), expressed as g/L tartaric acid.
The digital refractometers used in the laboratory for °Brix determination were Atago® Palette PR-32a (catalogue number 3405, Japan) and Bellingham+Stanley Ltd DR-103L (code number 44-903, Kent, England). Both refractometers had automatic temperature compensation and an accuracy of ±0.2°Brix. Daily quality control (QC) checks were performed against a 20°Brix sucrose solution.
pH and TA were measured with a CRISON compact automatic titrator (SN 01714, software version 5.6, CRISON Instruments, Barcelona, Spain) equipped with a combination electrode (CRISON, catalogue no. 4473624, Lasec, Cape Town, South Africa). TA was determined by potentiometric titration with standardised 0.33N sodium hydroxide (Wynland Laboratories, Wellington, South Africa) to an endpoint of pH 7.00. Daily QC checks included the calibration of the pH electrode with certified pH 4.01 and pH 7.00 buffer solutions (CRISON Instruments) and the analysis of 5 g/L, 7 g/L and 10 g/L standard L(+)tartaric acid solutions (Merck (Pty) Ltd., Modderfontein, South Africa).
Quantification of selected disease markers
Alcohol content
Grape musts were centrifuged for three minutes at 6000 rpm (Hermle Z206A compact centrifuge, HERMLE Labortechnik GmbH, Wehingen, Germany) and the supernatants (100 ml aliquots) distilled (Distillation unit Glasschem, Stellenbosch, South Africa). Following cooling to 20°C in an ice bucket, the distillates' alcohol contents were measured with an Alcolyzer Wine M instrument fitted with automatic temperature control (Anton Paar GmbH, Graz, Austria). This instrument has an accuracy of 0.1%, v/v, and repeatability of 0.01%, v/v. Quality control checks included daily measurements of 3 %v/v and 15 %v/v ethanol/water solutions (Ethanol absolute from Merck, Modderfontein, South Africa).
Enzyme-linked spectrophotometry assays
Commercial assay kits (Megazyme International Ireland Limited, Wicklow, Ireland) were used for the quantification of acetic acid (ACS/CS format) (catalogue no. K-ACET), glycerol (catalogue no. K-GCROL), gluconic acid (catalogue no. K-GATE), fructose and glucose (catalogue no. K-FRUGL), and PAN (catalogue no. K-PANOPA) (www. megazyme.com). Non-automated analyses were completed in duplicate. Internal standards supplied with the assay kits were used as QC checks.
Prior to enzymatic analysis, the grape must supernatants were once more centrifuged (6000 rpm for three minutes), and if tiny particles were still visible, samples were filtered through a glass microfibre 1.6-micron binder-free filter (GF 50 047) (Hahnemuhle, Dassel, Germany).
Absorbance was measured at 340 nm with a Cecil CE 1011 spectrophotometer (CECIL Instruments Limited, Cambridge, England). The photometric accuracy of the instrument is 1 % or 0.005 A, whichever is greater. The instrument was zeroed with air and without a cuvette in the light path.
Grape must spectrophotometric readings were entered on the online calculator (Mega-CalcTM software tool). Calculated results with negative values were recorded as zero. A negative result means that the analyte concentration is below the limit of detection (LOD) (Megazyme Technical support team, Personal communication, 2018).
Statistical analysis
Inter-assessor reliability statistical tests evaluated the consistency between assessors' visual assessments of grape rot severity. The "Irr" Package in R version 3.6.1 (The R Foundation for Statistical Computing, 2019) was used to determine the intraclass correlation coefficient (ICC), standard error of measurement (SEM), and least squares means (LSM) between the three assessors' severity (%) assessments. The level of significance used for the analyses was p < 0.05 with 95% confidence intervals.
To test the challenge of different viticulturists executing assessments between vintages, mixed model ANOVA was used (STATISTICA software version 13.3, TIBCO Software Inc., 2017). Assessors were used as the random effect, assuming that they were randomly selected from a population of assessors.
Multiple factor analysis (MFA) simultaneously analyses all the variables on each observation with results displayed on a correlation plot ("FactoMineR" Package in R Version 3.6.1, The R Foundation for Statistical Computing, 2019). Multiple factor analysis was done to illustrate the importance of association of the variables with each other, and their contribution to the dataset variance (Abdi et al, 2013). Positively correlated variables locate together, and negatively correlated variables locate on opposite sides of the plot. The distance between the variable point and the origin provides a measure of the quality of the variable on the plot (Pages, 2004). Variable points that are far away from the origin contribute strongly to the specific dimension.
To elucidate the effect of severity on the chemical composition of grape must, Pearson correlations coefficients (r) were determined between the rot-associated disease markers and severity (%) (STATISTICA software version 13.3, TIBCO Software Inc., 2017). The degree of correlation could be strong or weak, either positive (two variables increase of decrease similarly in the same direction) or negative (moving in opposite directions). The correlation coefficient (r) varies between -1 and 1, with 0 indicating no correlation between the two variables (Emerson, 2015). Furthermore, the probability value (p-value) (Lakens, 2021) and correlation coefficient (r) were used to evaluate the null hypothesis. With a p-value > 0.05, the result could be interpreted as a failure to demonstrate an effect (Smith, 2020).
Diagnostic analysis was used to determine the statistical threshold value of grape rot-associated disease markers differentiating between healthy and rot-affected grape musts. Receiver operating curves (ROC) are used in the assessment of the performance of a diagnostic test over the range of possible values of a predictor variable (Mandrekar, 2010). The ROC curve shows the sensitivity (true-positive) of a test measurement plotted against 1-specificity (false-positive) for various cut-off values of the test measurement constructed from the results (Peat, 2011). Different cut points or chosen thresholds lead to tests with varying levels of misclassification rates (Hseih, 2008). Sensitivity (true -positive) indicates the proportion of samples in percentage (%) of disease positive subjects, that will be correctly diagnosed by a positive test (Peat, 2011). On the other hand, specificity (true-negative) is a measurement (%) of disease negative samples that will be classified by a negative test. An increase in sensitivity will be accompanied by a decrease in specificity and, conversely, thus influencing the probability that a sample belongs to one class rather to the other. The area under the curve (AUC) is calculated from the ROC curve and is a measure of test accuracy (Hseih, 2008). The larger the area under the ROC, the more reliable the measurement is for distinguishing between disease and non-disease groups (Peat, 2011). An AUC of 1.0 indicates a perfect test. An AUC of 0.5 indicates that the diagnostic test has no discriminating power (Mandrekar, 2010). AUC upper and lower 95% measures the certainty or imprecision of the statistics with a 95% confidence interval (Peat, 2011). The AUC p-value tests the hypothesis whether AUC differs significantly from 0.5 (Mandrekar, 2010). R Version 3.6.1 "pROC" Package (The R Foundation for Statistical Computing, 2019) was used to determine the ROC and AUC.
RESULTS AND DISCUSSION
Grape rot severity assessments
In this study, a smaller set of 45 samples were used to evaluate the consistency, also referred to as repeatability or reliability (Peat, 2011). Each sample consisted of10 grape bunches. Each of the three assessors individually and separately evaluated each of the bunches. Sample severity was calculated as the mean over ten grape bunches.
The inter-assessor correlations were high, with an ICC (absolute agreement) > 0.78 (Table 2). An ICC value of 1.00 indicates that no variance is present (Peat, 2011). The standard error of measurement (SEM) described by Peat (2011) was used to assess the absolute range in which a subject's "true" measure was expected to occur. A perfectly reliable test has a SEM value = 0. The inter-assessor SEM for the viticulturists ranged from 4% to 7%. The high ICC (absolute agreement) and low SEM indicated consistency in visual severity assessment.
However, several viticulturists participated in grape rot assessments during the vintages under investigation, and verification of viticulturists' consistency was a requirement to provide confidence in their assessments. Using the above set of three viticulturists as a random sample representing the bigger population of assessors, overall mean severities between assessors were consistent (p < 0.01) (data not shown).
The effect of rot infection on grape must chemical composition
Chemical parameters of rot-affected grape must Healthy, as well as naturally rot infected grapes were collected from vineyards from 2013 to 2019. Sample severities ranged from healthy with no visual symptoms of rot infection to 91% severity (Table 1). Samples were collected at varying stages of maturity. The rationale for selected disease markers (Table 3) included in this study was based on the published literature, as well as those chemical compounds for which the on-site winery laboratory had the relevant required instrumentation.
Exploring the variance in the dataset, alcohol > 0.27 %v/v and acetic acid > 1.51 g/L were found as extreme values (Table 3). These high concentrations are associated with sour rot infection (Hall et al., 2017). Maximum alcohol of 0.35 %v/v (Table 3) is lower compared to 0.48 %v/v reported by Hall et al. (2017). However, acetic acid is converted to ethanol, thus ethanol concentration could vary significantly depending on the conversion rate by acetic acid bacteria.
Maximum glycerol concentrations were analysed in rot-affected samples from Chenin blanc and Hanepoot samples (Table 3). These glycerol concentrations of 17 to 18 g/L agree with concentrations reported in noble rot-affected grape must (Furdikova et al., 2019). However, high glycerol could also indicate an extended period of grey rot infection (Fischer & Bergh, 2007). Maximum gluconic acid of 32.26 g/L (Table 3) were analysed in grape must with a severity of 91%. Zoecklein et al. (2000) reported gluconic acid of 2.30 g/L in White Riesling grape must with a severity of > 25% sour rot infection.
Seventy-five percent of the samples in the dataset have glycerol:gluconic acid ratio of < 0.87. The glycerol:gluconic acid ratio is a measure of the quality of rotten berries by differentiating between noble rot and grey rot (Hausinger et al., 2015). Typically, lower ratios indicate the presence of grey rot. Noble rot infection could have glycerol:gluconic acid ratios > 8.00 g/L (Hausinger et al., 2015). Interestingly, although Chardonnay samples do not have high glycerol concentrations compared to Chenin blanc and Hanepoot, Chardonnay has the highest glycerol:gluconic acid ratio of 6.84 g/L (Table 3). Furthermore, visually assessed, only 10% severity was observed in this specific Chardonnay sample, demonstrating the presence of noble rot infection.
Rot infections could create a stressful environment for yeasts during alcoholic fermentation. Yeast and bacteria consume glucose, leading to a decrease in the glucose: fructose ratio. Alcoholic fermentation starting with a glucose:fructose < 1.00 could lead to problematic fermentations since glucose is preferred to fructose as energy source during fermentation (Jolly et al, 2015). Furthermore, yeast assimilable nitrogen (YAN) is critical in the management of wine fermentations (Ugliano et al., 2007). Grape nitrogen is decreased by rot infection. The most convenient measurement of YAN relates to the free or primary amino acids (PAN), of which 70 - 140 mg/L is required during fermentation (Ribereau-Gayon et al., 2006). Table 3 shows the variance in the beforementioned parameters.
Relationship between grape must chemical composition and grape rot severity
MFA results showed that the first two dimensions explain a total of 52.4% of the variability contained in the 14 analysed variables (Fig. 1). Grape rot severity, glycerol, alcohol, gluconic acid and acetic acid are positively correlated in dimension 1. The maturity parameters Brix:TA, pH, glucose, and fructose were positively correlated in dimension 2. Sugar concentration contributed to variability in dimension 1 (r = 0.62) and dimension 2 (r = 0.51). TA is the most important contributor to variability in dimension 2 (r = -0.77).
Pearson correlation coefficients identified the linear statistically relationships between severity and individual chemical variables (Table 3). In agreement with Cinquanta et al. (2015), gluconic acid and glycerol increased as severity increased (r = 0.7, p < 0.01). Alcohol and sugar concentration also exhibited strong positive correlations with severity (r > 0.5; p < 0.01). The respective correlations of acetic acid and TA with severity, were weak (r = 0.3). However, the low p-values (p < 0.01) casted doubt on the null hypothesis, indicating that acetic acid and TA also increased as severity of rot infection increased. Weak positive correlations were observed between severity and glucose, and glucose:fructose, respectively (r = 0.2; p < 0.05). The beforementioned results can be explained by characteristics associated with botrytis and sour rot infections. Yeasts convert grape sugar to ethanol, which in turn, could be oxidised by bacteria to acetic acid (Hall et al, 2018). Acidity is increased by berry dehydration, as well as due to production of gluconic acid and acetic acid (Barata et al, 2011; Cinquanta et al, 2015). In addition, dehydration of berries also leads to the concentration of grape sugars (Zoecklein et al., 2000).
Primary amino nitrogen has a weak negative correlation with severity (r = -0.2; p < 0.05). Botrytis rot could deplete nitrogen levels in grapes (Jackson, 2014). Increased severity did not significantly (p > 0.05) influence fructose, pH and the ratios of glycerol:gluconic acid or Brix:TA.
Statistical threshold values of grape rot indicators
Alcohol, acetic acid, glycerol, gluconic acid and TA were evaluated as grape rot indicators because of strong correlations with severity (Table 3). Although also showing a strong positive correlation with severity, sugar concentration was excluded. Increased sugar concentration could associate with increased final wine alcohol percentage and thus wine style, and not necessarily severity of rot infection.
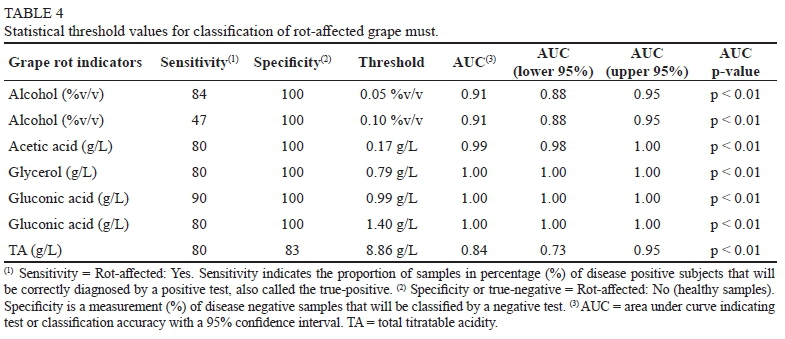
Identifying grape loads with rot infection is paramount to winery quality management. However, an effect in a dependent variable will not occur until a certain level (threshold) has been reached in an independent variable (Vogt, 2005). Hill et al. (2013) reported an industrial threshold of 3% to 5% severity for price penalties of botrytis rot-affected wine grapes. Steel et al. (2020) quantified that severity of 5% botrytis rot infection has a significant detrimental influence on wine quality. In this study, ROC's were used to determine grape rot indicator threshold values (concentrations), differentiating between healthy and rot-affected grape must. Using gluconic acid as an example: The optimal cut-off point which maximises the rate of sensitivity (true-positive) and minimises the rate of 1-specificity (false positive) is 0.16 g/L gluconic acid (Figure 2).
However, threshold values were selected according to the probability of a sample belonging to one class rather to the other, and not necessarily based on the optimal cutoff point. As discussed by Beghi et al. (2017), choosing to evaluate the presence of grape rot at winery intake with low sensitivity and high specificity, only highly infected loads will be identified. High specificity percentages tend to cancel out the false-positive samples avoiding unnecessary downgrades of healthy grapes. In the present study, a conservative probability was chosen using lower sensitivity (80%) and higher specificity (100%) (Table 4).
Yeasts produce small amounts of acetic acid during fermentation as a byproduct of their metabolism (Albertin et al., 2014). Volatile acidity production during alcohol fermentation could be as high as 0.50 g/L (Drysdale & Fleet, 1988). A legal limit of 0.80 g/L volatile acidity is enforced for bulk wine export (South African Liquor Products Act 60 of 1989). A threshold value of 0.17 g/L (Table 4) for the contribution of acetic acid from grapes at the start of winemaking would ensure that the final wine conforms to legal requirements.
A glycerol concentration of 0.79 g/L would differentiate between healthy and rot-affected grape must with 80% sensitivity (Table 4). The value agrees with glycerol of 0.8 g/L at the severity at which botrytis rot infection significantly influences wine quality (Steel et al., 2020). As previously discussed, noble rot infected samples are not abundant in this dataset. Thus, 0.79 g/L glycerol could be considered as an indicator of grey rot infection before the progressive development of noble rot infection.
Fischer & Berger (2007) assigned a gluconic acid > 1.0 g/L as the threshold value indicating botrytis rot-affected grape must. Gluconic acid production is primarily associated with sour rot infection. The present study's probability threshold value of 1.40 g/L agreed with gluconic acid concentrations obtained from a combination of grey and sour rot infections (Hausinger et al., 2015). If the threshold value in the present study decreased from 1.40 g/L to 0.99 g/L, sensitivity increased from 80% to 90% (Table 4). Thus 90% of rot-affected samples would be classified correctly, compared to the previous 80%, which would have a positive effect on grape quality. Furthermore, decreasing the threshold value would also ensure that botrytis rot-affected grape must was identified even if secondary sour rot infection was not present.
The alcohol threshold value of 0.05 %v/v is extremely low (Table 4). The reference instrument used for the determination of the alcohol content has an accuracy of 0.10 %v/v. Considering the instrument specification, specificity must decrease to 47% to increase the threshold value to 0.10 %v/v. This would mean that the probability of classification would change to only 47% sensitivity.
According to Hseih's (2008) AUC classification accuracy values, acetic acid, glycerol and gluconic acid have excellent classification accuracy (Table 4). By also considering the lower AUC (95%) of 0.73, TA has fair to good classification accuracy with AUC of 0.84 (p < 0.01) (Table 4). Comparing the specificity of alcohol, acetic acid, glycerol and D-gluconic acid, TA has a specificity of only 83%. Ideally, using a combination of grape rot indicators, TA will have a lower contribution value in detecting rot infection compared to acetic acid, glycerol and gluconic acid.
CONCLUSIONS
Due to the detrimental effect of botrytis and sour rot infections on wine quality, detecting rot infection in grape loads at winery intake would be of economic benefit to wineries. Data-driven determination differentiating between rot-affected and healthy grape must will eliminate the subjectivity and bias associated with visual assessments. Our results showed that the chemical composition of grape must could disclose the presence of rot infection. The grape rot-associated disease markers, glycerol, gluconic acid and alcohol show strong positive relationships with the severity of rot infection. However, only 52.4% of the variability contained in the dataset could be explained. A reason for this low extraction of information could be that only traditional wet chemistry methods were used. Furthermore, as a first step towards the assessment of grape quality at winery intake, our results provide statistical threshold values of grape rot indicators in rot-affected grape must. However, each winery needs to validate the statistical threshold values with empirical results, upon which an implementation strategy could be chosen. Based on the sensitivity and specificity (probability) chosen, decision-making could depend either on a single grape rot indicator's threshold value, e.g. with both high sensitivity and specificity, or multiple assessment incorporating more than one threshold values, following a more conservative approach. Furthermore, instrument specification also needs to be taken into consideration. Although geographically bounded, conditions in the study area represent three macroclimatic regions, namely regions III, IV and V, according to the Winkler growing degree index. To the best of the authors' knowledge, this is the first investigation into the effect of rot infection on the chemical composition of grape must under local (South African) conditions. The study significantly contributes to the existing knowledge by identifying statistical threshold values detecting rot-affected grape must. Furthermore, naturally infected vineyards (grapes) were used, representing industrial conditions and the natural development of rot infections in the vineyard. However, since a single generic model is being investigated consisting for different cultivars, the effect of severity on chemical analyses of grape must were tested over the total dataset, and not per individual cultivar. Future work could include focusing on individual cultivars and investigate if the relationships between severity and chemical parameters is close to results obtained with the single generic model. Research that will follow this study include using spectroscopic methods for rapid quantification of the chemical parameters in Table 3. Furthermore, spectral classification to differentiate between healthy and rot-affected grape must will also be explored.
LITERATURE CITED
Abdi, H., Williams, L.J. & Valentin, D., 2013. Multiple factor analysis: Principal component analysis for multitable and multiblock data sets. Wiley Interdiscip. Rev. Comput. Stat. Comput. Stat. 5(2), 149-179. doi: 10.1002/ wics.1246. https://personal.utdallas.edu/~herve/abdi-WiresCS-mfa-2013.pdf Date of access:_05.01.2020. [ Links ]
Albertin, W., Miot-Sertier, C., Bely, M., Marullo, P., Coulon, J., Moine, V., Colonna-Ceccaldi, B. & Masneuf-Pomarede, I., 2014. Oenological prefermentation practices strongly impact yeast population dynamics and alcoholic fermentation kinetics in Chardonnay grape must. Int. J. Food Microbiol. 178, 87-97. [ Links ]
Baiano, A., Terracone, C., Longobardi, F., Ventrella, A., Agostiano, A. & Del Nobile, M.A., 2012. Effects of different vinification technologies on physical and chemical characteristics of Sauvignon blanc wines. Food Chem. 135(4), 2694-2701. [ Links ]
Barata, A., González, S., Malfeito-Ferreira, M., Querol, A. & Loureiro, V., 2008. Sour rot-damaged grapes are sources of wine spoilage yeasts. FEMS Yeast Res. 8(7), 1008-1017. [ Links ]
Barata, A., Pais, A., Malfeito-Ferreira, M. & Loureiro, V., 2011. Influence of sour rotten grapes on the chemical composition and quality of grape must and wine. Eur. Food Res. Technol. 233(2), 183-194. [ Links ]
Barbe, J.C., De Revel, G., Joyeux, A., Bertrand, A. & Lonvaud-Funel, A., 2001. Role of botrytized grape micro-organisms in SO2 binding phenomena. J. Appl. Microbiol. 90(1), 34-42. [ Links ]
Beghi, R., Giovenzana, V., Brancadoro, L. & Guideti, R., 2017. Rapid evaluation of grape phytosanitary status directly at the check point station entering the winery by using visible/near infrared spectroscopy. J Food Eng. 204, 46-54. [ Links ]
Cañete-Rodríguez, A.M. Santos-Dueñas, I.M., Jiménez-Hornero, J.E., Ehrenreich, A., Liebl, W. & García-García, I., 2016. Gluconic acid: Properties, production methods and applications-An excellent opportunity for agro-industrial by-products and waste bio-valorization. Process Biochem. 51(12), 1891-1903. [ Links ]
Ciliberti, N., Fermaud, M., Roudet, J. & Rossi, V., 2015. Environmental conditions affect Botrytis cinérea infection of mature grape berries more than the strain or transposon genotype. Phytophathology 105(8), 1090-1096. [ Links ]
Cinquanta, L., Albanese, D., De Curtis, F., Malvano, F., Crescitelli, A. & Di Matteo, M., 2015. Rapid assessment of gray mold (Botrytis cinérea) infection in grapes with a biosensor system. Am. J. Enol. Vitic. 66(4), 502508. [ Links ]
Coombe, B.G., 1995. Growth stages of the grapevine: Adoption of a system for identifying grapevine growth stages. Aust. J. Grape Wine Res. 1(2), 104110. [ Links ]
Dambergs, B., Nordestgaard, S., Jiang, M., Wilkes, E., Petrie, P., 2018. Hyperspectral imaging of botrytis in grapes. Wine Vitic. J. 33(3), 22-24. [ Links ]
Drysdale, G.S. & Fleet, G.H., 1988. Acetic acid bacteria in winemaking: A review. Am. J. Enol. Vitic. 39(2), 143-154. [ Links ]
Emerson, R., 2015. Causation and Pearson's correlation coefficient. Journal of Visual Impairment and Blindness 109(3), 242-244. https://journals-sagepub-com.ez.sun.ac.za/doi/pdf/10.1177/0145482X1510900311 [ Links ]
Fischer, U. & Berger, T. 2007. Objective measurement of grape soundness. Focus 31(1), 18-21. [ Links ]
FOSS (2002). GrapeScan calibration. Must-sanitary state, Application Note 212, Issue 1 GB, P/N 1025544. Foss Electric, Hilleroed. [ Links ]
Furdikova, K., Machynakova, A., Drtilova, T., Klempova, T., Durcanska, K. & Spanik, I., 2019. Comparison of volatiles in noble-rotten and healthy grape berries of Tokaj. LWT - Food Sci. Technol. 105, 37-47. [ Links ]
Goold, H.D., Kroukamp, H., Williams, T.C., Paulsen, I.T., Varela, C. & Pretorius, I.S., 2017. Yeast's balancing act between ethanol and glycerol production in low-alcohol wines. Microb. Biotechnol. 10(2), 264-278. [ Links ]
Hall, M., Loeb, G. & Wilcox, W., 2017. Sour rot: Etiology, biology, and management. Internet J. Enol. Vitic. 6(1), 1-8. https://www.infowine.com/intranet/libretti/0/libretto16557-01-1.pdf Date of access: 04.01.2020. [ Links ]
Hall, M.E., Loeb, G.M., Cadle-Davidson, L., Evans, K.J. & Wilcox, W.F., 2018. Grape sour rot: A four-way interaction involving the host, yeast, acetic acid bacteria, and insects. Phytopathology 108(12), 1429-1442. [ Links ]
Hausinger, K., Lipps, M., Raddatz, H., Rosch, A., Scholten, G. & Schrenk, D., 2015. Automated optical grape-sorting of rotten grapes: effects of rot infections on gluconic acid concentration and glycerol/gluconic acid ratios in must and wine. J. Wine Res. 26(1), 18-28. [ Links ]
Hill, G.N., Beresford, R.M. & Evans, K.J., 2010. Tools for accurate assessment of botrytis bunch rot (Botrytis cinerea) on wine grapes. New Zeal. Plant Prot. 63, 174-181. [ Links ]
Hill, G.N., Evans, K.J., Beresford, R.M. & Dambergs, R.G., 2013. Near and mid-infrared spectroscopy for the quantification of botrytis bunch rot in white wine grapes. J. Near Infrard Spectrosc. 21(6), 467-475. [ Links ]
Hill, G.N., Henshall, W.R. & Beresford, R.M., 2017. Manipulating rainfall to study symptom expression of Botrytis cinerea infection in wine grapes. Kiwifruit & Grape Pathology 70, 301-309. [ Links ]
Hommel, R.K., 2014. Acetobacter. In: Encycl. Food Microbiol. Second Ed., 3-10. DOI: 10.1016/B978-0-12-384730-0.00001-X. [ Links ]
Hsieh, J.J., 2008. Receiver operating characteristic curve (ROC) In: Encyclopedia of Epidemiology. SAGE Publications, Inc., Thousand Oaks, 896-898. [ Links ]
International Organisation of Vine and Wine. Compendium of international methods of analysis of wines and must (2 vol). http://www.oiv.int/en/technical-standards-and-documents/methods-of-analysis/compendium-of-international-methods-of-analysis-of-wines-and-musts-2-vol Date of access: 25.01.2020. [ Links ]
Jackson, R.S., 2014. Botrytis. Encycl. Food Microbiol. Second Ed. (1), 288296. http://dx.doi.org/10.1016/B978-0-12-384730-0.00042-2 [ Links ]
Jolly, N., Smit, H. & Coetzee, L., 2015. Fermentasie en glucose-fruktose vlakke. Winetech Tegnies 312, 88-91. [ Links ]
Lakens, D., 2021. The practical alternative to the p value is the correctly used p value. Perspect. Psychol. Sci. 16(3), 639-648. [ Links ]
Longbottom, M., Simos, C., Krstic, M. & Johnson, D., 2013. Grape quality assessments: a survey of current practice. Wine Vitic. J. 28(3), 33-37. [ Links ]
Loureiro, V. & Malfeito-Ferreira, M., 2003. Spoilage yeasts in the wine industry. Int. J. Food Microbiol. 86, 23-50. [ Links ]
Lorenzini, M., Simonato, B., Favati, F., Bernardi, P., Sbarbati, A. & Zapparoli, G., 2018. Filamentous fungi associated with natural infection of noble rot on withered grapes. Int. J. Food Microbiol. 272, 83-86. [ Links ]
Lovato, A., Zenoni, S., Tornielli, G.B., Colombo, T., Vandelle, E. & Polverari, A., 2019. Specific molecular interactions between Vitis vinifera and Botrytis cinerea are required for noble rot development in grape berries. Postharvest Biol. Technol. 156, 1-15. [ Links ]
Mandrekar, J.N., 2010. Receiver operating characteristic curve in diagnostic test assessment. J. Thorac. Oncol. 5(9), 1315-1315. [ Links ]
Molitor, D., Behr, M., Hoffman, L. & Evers, D., 2012. Impact of grape cluster division on cluster morphology and bunch rot epidemic. Am. J. Enol. Vitic. 63(4), 508-514. [ Links ]
Molitor, D., Baus, O., Hoffman, L. & Beyer, M., 2016. Meteorological conditions determine the thermal-temporal position of the annual Botrytis bunch rot epidemic on Vitis vinifera L. cv. Riesling grapes. Oeno One 50(4), 231-244. [ Links ]
Navarro, D., Mateo, E., Torija, M. & Mas, A., 2013. Acetic acid bacteria in grape must. Acetic Acid Bact. 2(1s), 19-23. [ Links ]
Nisiotou, A.A. & Nychas, G-JE., 2007. Yeast populations residing on healthy or botrytis-infected grapes from a vineyard in Attica, Greece. Appl. Environ. Microbiol. 73(8), 2765-2768. [ Links ]
Pages, J., 2004. Multiple factor analysis: Main features and applications to sensory data. Rev. Colomb. Estad. 27(1), 1-26. [ Links ]
Peat, J.K., 2011. Reporting the results In: Health Science Research. SAGE Publications, Ltd, London. 203-266. [ Links ]
Poni, S., Gatti, M., Palliotti, A., Dai, Z., Duchene, E., Truong, T.T., Ferrara, G., Matarrese, A.M.S., Gallotta, A., Bellincontro, A., Mencarelli, F. & Tombesi, S., 2018. Grapevine quality: A multiple choice issue. Sci. Hortic 234, 445-462. [ Links ]
Qiu, X. Zhang, Y. & Hong, H., 2021. Classification of acetic acid bacteria and their acid resistant mechanism. AMB Express 11(29), doi. 10.1186/s13568-021-01189-6. [ Links ]
Ravji, R.G., Rodriguez, S.B. & Thornton, R.J., 1988. Glycerol production by four common grape molds. Am. J. Enol. Vitic. 39(1), 77-82. [ Links ]
Ribereau-Gayon, P., Dubourdieu, D., Donenech, B. & Lonvaud, A., 2006. Handbook of Enology Volume 1 The microbiology of wine and vinification. (2nd ed.). Vol. 1. John Wiley & Sons, Ltd, Chichester, UK. [ Links ]
Sainz, F., Navarro, D., Mateo, E., Torija, M.J. & Mas, A., 2016. Comparison of D-gluconic acid production in selected strains of acetic acid bacteria. Int. J. Food Microbiol. 222, 40-47. [ Links ]
SAWIS, 2019. Status of wine-grape vines as on 31 December 2019. http://www.sawis.co.za/info/download/vineyard_status_booklet_2019_final_2.pdf Date of access: 23.12.2020. [ Links ]
Smith, R.J., 2020. P >.05: The incorrect interpretation of "not significant" results is a significant problem. Am. J. Phys. Anthropol. 172(4), 521-527. [ Links ]
Steel, C.C., Blackman, J.W. & Schmidtke, L.M., 2013. Grapevine bunch rots: Impacts on wine composition, quality and potential procedures for the removal of wine faults. J. Agric. Food Chem. 61 (22), 5189-5206. [ Links ]
Steel, C.C., Schwarz, L.J., Qiu, Y., Schueuermann, C., Blackman, J.W., Clark, A.C. & Schmidtke, L.M., 2020. Thresholds for Botrytis bunch rot contamination of Chardonnay grapes based on the measurement of the fungal sterol, ergosterol. Aust. J. Grape Wine Res. 26(1), 79-89. [ Links ]
Tello, J. & Ibanez, J., 2018. What do we know about grapevine bunch compactness? A state-of-the-art review. Aust. J. Grape Wine Res. 24(1), 6-23. [ Links ]
Ugliano, M., Henschke, P.A., Herderich, M.J. & Pretorius, I.S., 2007. Nitrogen management is critical for wine flavour and style. Aust. New. Zeal. Wine Ind. J. 22(6), 24-30. [ Links ]
Valdes-Gomez, H., Fermaud, M., Roudet, J., Calonnec, A. & Gary, C., 2008. Grey mould incidence is reduced in grapevines with lower vegetative and reproductive growth. Crop Prot. 27, 1174-1186. [ Links ]
VanderWeide, J., Frioni, T., Ma, Z., Stoll, M., Poni, S. & Sabbatini, P., 2019. Early leaf removal as a strategy to improve ripening and lower cluster rot in cool climate (Vitis vinifera L.) Pinot Grigio. Am. J. Enol. Vitic. DOI: 10.5344/ajev.2019.19042. [ Links ]
Versari, A., Parpinello, G.P., Mattioli, A.U. Galassi, S., 2008. Determination of grape quality at harvest using Fourier-Transform Mid-Infrared spectroscopy and multivariate analysis. Am. J. Enol. Vitic. 59(3), 317-322. [ Links ]
Vogt,W. P., 2005. Dictionary ofstatistics& methodology (Vols. 1-0). Thousand Oaks, CA: SAGE Publications, Inc. DOI: 10.4135/9781412983907. [ Links ]
Weiller, F., Schuckel, J., Willats, W.G.T., Driouich, A., Vivier, M.A. & Moore, J.P., 2021. Tracking cell wall changes in wine and table grapes undergoing Botrytis cinerea infection using glycan microarrays. Ann. Bot. 128(5), 527-543. [ Links ]
Winkler, A. J., Cook, J. A., Kliewer, W. M., Lider, L. A., 1974. General Viticulture, 2nd ed. University of California Press: Davis, CA, USA, p710. [ Links ]
Zoecklein, B.W., Williams, J.M. & Duncan, S.E., 2000. Effect of sour rot on the composition of White Riesling (Vitis Vinifera L.) grapes, Small Fruits Rev. 1(1), 63-77. [ Links ]
Submitted for publication: November 2021
Accepted for publication: April 2022
* Corresponding author: E-mail address: hhn@sun.ac.za
R.J. Cornelissen: Current E-mail address: marina@namaquawines.com
Acknowledgements: Funding of the research by South African Grape and Wine Research Institute, Stellenbosch University, South Africa, the National Research Foundation (NRF) of South Africa, and Namaqua Wines, South Africa. Technical assistance from the viticulturists and laboratory analysts of Namaqua Wines, Vredendal, South Africa.

