


Services on Demand
Article
 English (pdf)
 Article in xml format
 Article references
Indicators

Related links
-
 Cited by Google
 -
 Similars in Google
Share

 Permalink
South African Journal of Enology and Viticulture
On-line version ISSN 2224-7904
Print version ISSN 0253-939X
S. Afr. J. Enol. Vitic. vol.43 n.1 Stellenbosch 2022
http://dx.doi.org/10.21548/43-1-4812
ARTICLES
Attempted Identification of Causal Constituents of Pink Discolouration in White Wines
Nel A.P.I; du Toit W.J.II; van Jaarsveld F.P.III
ICape Peninsula University of Technology, Hexberg Road, Wellington Campus, Wellington 7655, Western Cape, South Africa
IIDepartment of Viticulture and Oenology, Stellenbosch University, Private Bag X1, Matieland 7062, South Africa
IIIPost-harvest and Agro-processing Technologies Division, ARC Infruitec-Nietvoorbij (The Fruit, Vine and Wine Institute of the Agricultural Research Council), Private Bag X5026, Stellenbosch 7599, South Africa
ABSTRACT
The pinking phenomenon has been known in the wine world for the past 50 years. The phenomenon occurs when a white wine turns pink under certain conditions. Since then, a Portuguese study found malvidin-3-O-glucoside in Siria grapes making a connection to anthocyanin as the causing agent. Control (K), naturally pinked (NP) and pink induced (PI) Sauvignon blanc wine samples were analysed by LC-MS and WineScanTM (Fourier Transform Infrared - FTIR) after Solid Phase Extraction. The monomeric anthocyanins were analysed by a pH differential method, and CieLab was used to differentiate colour differences between the control and pinked samples. It was found that malvidin-3-O-glucoside was below the threshold values to facilitate pinking in Sauvignon blanc wines. Petunidin-3-O-glucoside showed a slight peak in the LC-MS analysis, and together with the malvidin-3-O-glucoside, the potential to pink the white wines increased. FTIR results showed that phenols and anthocyanins absorption could not be distinguished and that there were possibly other compounds involved in the pinking of white wines. Analysis by CieLab expressed the PI wines as a darker pink colour than the control wine and the absorbency value at 500 nm was at least three times higher for PI than the control, showing the aggressive oxidative nature of H2O2 on wine.
Keywords: Pinking, Sauvignon blanc, malvidin, CieLab
INTRODUCTION
Pinking in wine is a phenomenon that was first described by Singleton and Esau in 1969. Andrea-Silva et al. (2014) found traces of malvidin-3-O-glucoside after cleaning a pinked Siria wine with PVPP (Polyclar V) and analysing it with electrospray ionization mass spectrometry (ESI-MS). At a workshop held in Italy, Andrea-Silva reported lenticel-type structures that formed on Siria grapes and presumed these to be patches of anthocyanins forming on the skin of the grape and responsible for the pink colour (data presented at an Italian workshop on pinking, 2018). Siria is not the only cultivar that is prone to pinking phenomena. Other cultivars such as Sauvignon blanc, Thompson Seedless, Chardonnay, Chenin blanc, Crouchen, Muscat Gordo Blanco, Palomino, Riesling, Semillon and Sultana are also prone to this pinking phenomenon (Simpson, 1977a; Andrea-Silva et al., 2014).
White wine can turn pink for different reasons. White grapes could be contaminated with red grapes or a small amount of red wine could come in contact with white wine (Tobe, 1983). The result in both cases would be white wine with a pinkish tint. White wines can also turn pink because of an oxidation reaction where sensitive cultivars (like Sauvignon blanc) turns pink during certain winemaking processes (Tobe, 1983). Another possibility is that the genes for anthocyanin production in the vine are turned on because of external environmental conditions (Boss et al., 1996). Whatever the reason might be, the result presents a challenge and unnecessary expense for the winemaker to rectify.
The pinking phenomenon has been known since the 1960s, as described by Singleton and Esau (1969), but about 50 years later the compounds causing pinking are still unknown. It is known that the precursor to pinking appears to be present at low concentrations (Singleton et al., 1979), is thermally unstable (Simpson et al., 1982) and is slightly affected by SO2 additions or changes in wine pH (Simpson et al., 1982). Pinking is postulated to be the result of several reasons, namely 1) Oxidative enzymes, for example, polyphenol oxidase (PPO), could be linked to pinking (Vaimakis & Roussis, 1993). 2) The rapid conversion of accumulated flavones may lead to red flavylium salts and a pinkish colour (Zoecklein et al., 1995).
3) 2-S-glutathionyl-caftaric acid (Grape Reaction Product -GRP) derivatives may be linked to pink chromophores (van Wyk et al., 1976). 4) Jones (1989:61) reported that at least 10 different compounds and polymeric compounds, forming a heterogeneous group of varying composition and polarity, could be linked to pinking, while Tobe (1983) narrowed it down to about four compounds (astilbin, quercitrin, engeletin and rutin). 5) Certain amino acids (e.g. cysteine) form compounds with thiosulfinates to form pink chromophores (Kubec et al., 2004b; Imai et al., 2006; Kubec & Velisek, 2007; Lee et al., 2010; Kucerova et al., 2011 & Kubec et al., 2015). The first attempt to identify the compound causing pinking was done in 2014 with a follow-up confirmation of malvidin-3-O-glucoside. This was done on a Portuguese cultivar, Siria. This study will attempt to confirm the said study (null hypothesis) or will try to point to another potential causative compound(s) that can cause pinking in Sauvignon blanc wines.
MATERIALS AND METHODS
Grape and wine samples
White grapes and white wines from Vitis vinifera L. cv. Sauvignon blanc were used in this study. The grapes used in this study were from the vintages 2019 and 2020, harvested in the ward of Constantia, Coastal region, Western Cape, South Africa. This ward and region are characterized by an altitude ranging between 50 and 420 m above sea level. The soils consist of decomposed granite with high clay content. Grapes were manually harvested at optimum maturity (± 24°Brix) and transported to the winery. They were immediately destemmed and crushed, and the grape juice was treated with sulphur dioxide (40 mg/L) to avoid must oxidation. The crushed grapes were then pressed at a maximum pressure of 1.5 bar in a pneumatic press machine. Grape juice was clarified by pumping to 4.5 L glass fermentation bottles and left for 24 h at 10°C before racking to 4.5 L fermentation bottles. The alcoholic fermentation was started using active dry yeasts (Vin 13, Anchor Yeast, South Africa), carried out at controlled temperature (14°C), and finished when residual sugars were <2 g/L. After alcoholic fermentation, the wine was racked, and the free sulphur dioxide was adjusted (~40 mg/L). All conventional analytical methods were performed according to OIV methods and the South African Wine Laboratory Association Manual (SAWLA, 2002; OIV, 2012). The described wines were used for the LC-MS and Fourier Transform Infrared analyses.
Wine samples selected had high pinking potential. Control samples (4 L) were kept refrigerated in closed bottles with no airspace. In addition to the control samples, two treatments were applied to the remaining wine. The treatments were as follows: Four litres of wine were left with airspace in the open for three days until the sample pinked naturally (showing a visible pink colour - NP). Hydrogen peroxide (H2O2) was added to another batch of 4 L of wine and left overnight until the wine turned pink (pink induced - PI).
Visible absorption spectra and wine chromatic characteristics
The visible absorption spectra were acquired in a 4 cm path length glass cell from 380 to 780 nm. The spectra were converted to a 1 cm path length, and the chromatic characteristics of the wines according to CIELab were calculated by using the Method OIV-MA-AS2-11 of the OIV compendium (OIV, 2012). All analyses were performed in triplicate.
Isolation of the pinking compounds from Sauvignon blanc wines by PVPP column chromatography
The method describe by Andrea-Silva et al. (2014) were followed. To a white wine (1 L) presenting natural pinking (NP), pink induced (PI) and a control (C) 0.8 g of PVPP (Polyclar V, Laffort, South Africa) was added, and the suspension was filtered through a cheesecloth and washed with 100 mL of water followed by 100 mL of ethanol 95%. After this washing, the PVPP, presenting a pink colour, was loaded on an empty SPE cartridge (without the silica-based sorbents) (Waters Corporation, South Africa) with frits and eluted sequentially with 3 mL of (1) acetonitrile, (2) acetone, (3) aqueous solution of 1% HCl, (4) ethanol, and (5) 0.1 M NH3 in ethanol (all chemicals from Sigma-Aldrich, South Africa). Each eluent was separately collected, the solvent was removed by centrifugal evaporation and the solution was reconstituted with 0.2 mL of a methanol/water (1:1 v/v) solution before analysis by HPLC-LC-MS. All analyses were performed in triplicate.
Determination of total monomelic anthocyanins.
Total monomeric anthocyanins were determined using the pH differential method AOAC Official Method with a minor modification (Lee, 2005). Due to the low concentration of anthocyanins present in pinking white wines, for the an-thocyanin determination by the pH differential method the absorbance was measured at 520 and 700 nm using a 1 cm path length glass cell. Total monomeric anthocyanins were expressed as milligrams of malvidin-3-O-glucoside per litre (molar extinction coefficient of 28000 L/cm/mol and molecular weight of 493.43 g/mol). All analyses were performed in triplicate.
Isolation of pinking compounds by reversed-phase solid-phase extraction
The method described by Andrea-Silva et al. (2014) were followed. The pinking compounds present in the samples were purified and concentrated by reversed-phase (C-18) solid-phase extraction (Oasis HLB SPE cartridge with 6 mL volume). Briefly, 1 g of C-18 SPE column was conditioned by applying four times 5 mL of methanol and 4 times 5 mL of a 0.1 M HCl solution. Then, the samples were applied: 100 mL of white wines from Sauvignon blanc grape variety as well as a pinked sample, adjusted to pH 1 with 3 M HCl. After application of the sample, the column was washed four times with 5 mL of the 0.1 M HCl solution, and the compounds retained were eluted four times with 5 mL of methanol. The fractions were pooled, and the methanol was removed by rotary evaporation at 35°C. The dried residue was dissolved in 2 mL of a methanol/water (1:1 v/v) solution and analysed by LC-MS. All analyses were performed in triplicate.
Liquid chromatography Mass Spectroscopy
For this experiment, Sauvignon blanc wine with high pinking potential was taken. Half of the wine was kept under a blanket of CO2 gas to exclude oxygen from the wine and the other half was left open for a couple of days to pink naturally. Solid-phase extraction (SPE) was used with a 24-posi-tion SPE vacuum manifold from Supelco. The SPE procedure used was similar for each kind of cartridge. The cartridges were activated with 5 mL methanol and conditioned with 5 mL 5% methanol solution. Two hundred and fifty millilitres of samples were loaded into the cartridges and, before elution, sorbents were washed with 5 mL ultrapure water and eluted with 15 mL methanol. The eluted samples were concentrated with N2 gas up to 0.5 mL. Concentrated samples were kept in a 1 mL Eppendorf tube and directly taken for LC-MS analysis.
Anthocyanins
A Waters Synapt G2 quadrupole time-of-flight (TOF) mass spectrometer (Waters Corporation, Milford, MA, USA), fitted with a Waters Acquity UPLC and photodiode array detector (PDA), was used for LC-MS analyses. The separation was achieved on a Waters BEH Amide UPLC column (2.1 x 100 mm, 1.7 µm) at 35°C. Solvent A consisted of 10 mM ammonium acetate in water; solvent B consisted of 10 mM ammonium acetate in 95% acetonitrile. The gradient consisted of a flow rate 0.25 mL/min, starting with 95% B to 40% B over 9 min, applying gradient curve 7, followed by re-equilibration to initial conditions over 5 min. Electrospray ionisation was applied in the negative mode, using a capillary voltage of 2.5 kV, a cone voltage of 15 V, desolvation temperature of 250°C and desolvation gas (N2) flow of 650 L/hr. The rest of the MS settings were optimised for best sensitivity. Data were acquired in MSE mode, consisting of a scan using low collision energy and a scan using a collision energy ramp from 25 to 60 V, which has the added advantage of acquiring low energy molecular ion data as well as fragmentation data for all analytes all the time. Data were scanned using a scan rate of 0.2 s over the range m/z 100-1000. Leucine enkephalin was used as lock mass for accurate mass determination on the fly using a lock mass flow rate of 0.002 mL/min, acquiring lock mass data every 20 s. Sodium formate was used to calibrate the instrument. The PDA detector was set to scan over the range of 220-450 nm.
Phenols
A Waters Synapt G2 quadrupole time-of-flight (TOF) mass spectrometer was used for LC-MS analysis, fitted with a Waters Ultra pressure liquid chromatography and photodiode array detection. The separation was achieved on a Waters HSS T3 column (2.1 x 100 mm with 1.7 µm particles). A gradient was applied using 0.1% formic acid (solvent A) and acetonitrile (solvent B). The gradient started at 100% solvent A for 1 minute and changed to 50% B over 22 minutes in a linear way. It then went to 100% B after 23 minutes where it was held until 24.5 minutes, followed by re-equilibration to initial conditions for 4 minutes. The flow rate was 0.25 mL/ min and the column was kept at 60°C. The injection volume was 3 µL. Data were acquired in MSE mode which consisted of a low collision energy scan (6 V) from m/z 150 to 1500 and a high collision energy scan from m/z 40 to 1500. The high collision energy scan was done using a collision energy ramp of 30-60 V. The photodiode array detector was set to scan from 220-600 nm. The mass spectrometer was optimized for best sensitivity, a cone voltage of15 V, desolvation gas (N2) at 650 L/hr and desolvation temperature 275°C. The instrument was operated with an electrospray ionization probe in the negative mode. Sodium formate was used for calibration and leucine encephalin was infused in the background as lock mass for accurate mass determinations.
Fourier Transform Infrared (WineScanTM) analysis
Using Fourier Transform Infrared technology (FT2 WineScan™, Foss electric, Hille-roed, DK), the spectra were recorded in a range from 929 to 4992 cm-1 with a spectral resolution of 14 cm-1. Spectra were recorded at a sample temperature of 40°C. Measurements were carried out in transmission at a defined optical path length of 37 lm using a CaF2 cuvette. Sampling was conducted with an auto-sampler, using about 30 mL of sample for a double measurement, including pre-flushing of the system. The sample transmittance spectrum is then divided by the background transmittance spectrum obtained in the standard measurement. Background measurements were taken against double-distilled water. Background measurements were taken every 20 min and the system was flushed automatically every 20 min or after 15 samples. In this instrument, the interferometer system is encapsulated to minimize the disturbance by water vapour and other gases like CO2 in the optical pathway. Collection of data from the entire spectrum allows the analysis of many parameters in a short period. The whole spectral range (929-4992 cm-1) is stored for each sample. There are certain ranges of frequencies, which are eliminated to prevent noise being included in the calculations. The following spectral ranges: 965-1582, 1698-2006 and 2701-2971 cm-1 are advised to be used. Two regions contain water absorption bands which also taken out of the spectral range, i.e. 1582-1698 and 2971-3627 cm-1 (Patz et al., 2004). Therefore, for routine wine analysis, only about 30 data points are used to quantify the following parameters: pH, volatile acidity, titratable acidity, malic acid, lactic acid, glucose, fructose, glycerol and alcohol. There is thus a whole range of data points that are not used and which could be used to identify unknown compounds (Palma & Barroso, 2002; Patz et al., 2004; Bevin et al., 2006).
Statistical analysis
Analysis of variance (ANOVA) was conducted according to the experimental design using SAS statistical software (Version 9.4, SAS Institute Inc., Cary, NC, USA). Shapiro-Wilk test was performed on the standardized residuals from the model to test for deviation from normality (Shapiro & Wilk, 1965). This was done for the visible absorption spectra, isolation of pinking and determination of monomelic anthocyanins. Fisher's least significant difference was calculated at the 5% level to compare treatment means. A probability level of 5% was considered significant for all significance tests. Multivariate analyses were performed using XLSTAT, version 2016 (Addinsoft, Paris, France).
AUC (Area Under the Curve) and ROC (Receiver Operating Characteristics) curve or as it is also written, AUROC (Area Under the Receiver Operating Characteristics) were used to detect the spectral differences between the control and pinked samples (Fawcett, 2006). This was done for the LC-MS and FTIR data. The t-test was used to determine the means of the two sets of data showing the significant difference from each other (Pfanzagl & Sheynin, 1996).
RESULTS AND DISCUSSION
Visible absorption spectra and wine chromatic characteristics
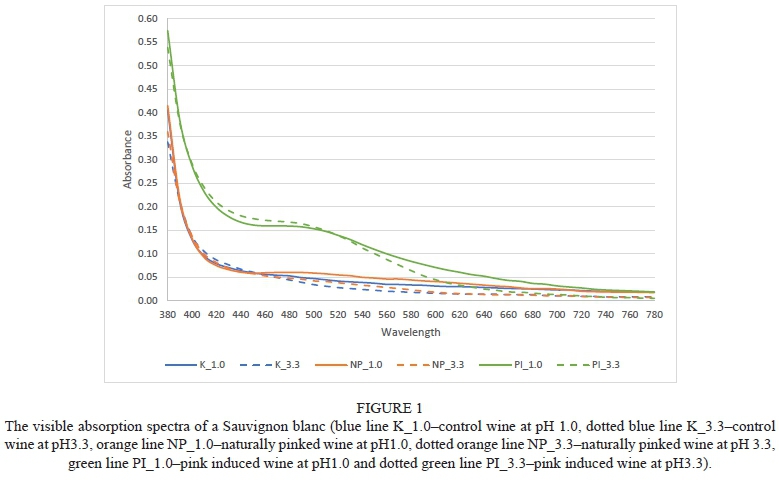
Sauvignon blanc, from Constantia ward, with a potential to pink was used. The wine was divided into two batches, of which each batch was further divided into a control (K), naturally pinked (NP), and a pink induced (PI) wine. The pH of the wine (K, NP & PI) was 3.3. To test the findings of Simpson (1977a) that pH does not influence pinked wines, the second batch (K, NP & PI) were acidified to a pH 1.0 before testing it chromatographically. Figure 1 presents the visible absorption spectra of the Sauvignon blanc's control wine (blue line at pH 1.0 and blue dotted line at pH 3.3), the same white wine where the wine pinked naturally (the orange line at pH 1.0 and orange dotted line at pH 3.3) and the same wine that was pink induced by hydrogen peroxide (green line at pH 1.0 and green dotted line at pH 3.3). The control wine showed no visible peak at 500 nm at either pH 3.3 or pH 1.0 as the wine had a normal white wine colour. There were definitive differences between naturally pinked and pinked induced wines. The pinkish discolouration was more evident for the pink induced wines, while the naturally pinked wines had a light pinkish colour, which showed the oxidation effect of H2O2 on the wine components.
The difference between NP and PI wine is also shown in Figure 1. The PI wine has a much higher peak at 500 nm than the NP wines. This could be explained by the H2O2 mode of action which was more aggressive and therefore the colour change in the wine was more prominent (Giguere, 1983). Although the PI wine showed a higher absorbance peak than the NP wine, the difference between PI10 and PI3.3 is non-significant. The pH does not influence the pink discolouration of PI wines as much as it does the NP wines as there was only a slight increase in absorbance at 500 nm between NP1.0 and NP3.3
The L* a* b* values describe a three-dimensional colour space. The vertical axis L* is a measure of lightness, from completely opaque (0) to completely transparent (100), while on the hue-circle a* is a measure of redness (or -a* of greenness), and b* of yellowness (or -b* of blueness) (Bakker et al., 1986). The Sauvignon blanc was divided in two pH groups (pH 3.3 and pH 1.0). Each of these two pH groups were further divided in a control (K), natural pink (NP) and pink induced (PI) wine. The control wine of pH 3.3 (L* = 97.9; a* = -0.6564; b* = 5.4816) and pH 1.0 (L* = 96.6; a* = -0.0438; b* = 3.4173) had a pale yellow colour. The natural pink wine at pH 3.3 (L* = 97.3; a* = 0.6380; b* = 4.2334) showed a slight pinkish colour, while the NP wine at pH 1.0 (L* = 95.8; a* = 0.9385; b* = 2.0723) was not much darker according to visual perception. The large colour difference was perceived with the PI wine. Between the two pH levels of the PI samples, there was a slight visual difference. The pH 3.3 (L* = 91.7; a* = 6.1628; b* = 11.3448) and pH 1.0 (L* = 90.8; a* = 4.4952; b* = 8.2376) changed to a deeper salmon pink after the addition of H2O2. The colorimetric differences between the control wine at both pH levels and the natural pink at wine ph showed no visible differences (AE* for KpHl.0 and NPpH3.3 is 2.5 and 1.9 respectively). The biggest visible difference can be seen between the NPpHl.0, PIpH3.3 and the PIpHl.0 (AE* = 4.3, 10.9 and 9.2 respectively). This indicates that pinking can be seen if it occurs naturally, but the colour difference are more prominent when pinking are induced.
The experiment was repeated with five wines from the Coastal wine region. These wines, which corresponds to 0.01, 0.02, 0.03, 0.04 and 0.05 absorbancy units (AU) on a spectrophotometer were compared to a Rosé also from the Robertson wine area. The aim of this experiment as to see at what absorbancy unit a pinked wine is visable to a consumer. The measurement for lightness (L*), redness (a*) and yellowness (b*) for the five wines were: 0.01 AU (L* = 96.8; a* = -0.6537; b* = 8.1180), 0.02 AU (L* = 96.1; a* = 0.3329; b* = 8.3125), 0.03 AU (L* = 95.3; a* = 1.0500, b* = 8.2546), 0.04 AU (L* = 95.1; a* = 1.8385, b* = 8.2639) and 0.05 AU (L* = 94.5; a* = 2.8065; b* = 8.1913). The Rosé wine was (L* = 90.7; a* = 9.3774; b* = 8.7410). The 0.01 Au wine compares with the control wine (L* = 97.9; a* = -0.6564; b* = 5.4816) as both these wines are in the green spectrum with both negative values in a*. The AE* between the control wine and the 0.01 AU wine equals 2.9, which falls in the range stated by Martínez et al. (2001). The conclusion can be made that there is no percievness in colour between these two wines. As the absorbancy units increases, so is there an increase in the red spectrum. The AE* increased from 2.9 (0.01 AU) to 5.6 (0.05 AU) measured against the control wines.
The absorbance at 500 nm showed that the NP wine was just over the limit of 0.05 AU, which is regarded as the cut-off point for pinking susceptibility (Simpson, 1977a; SAW-LA, 2002). Comparing the NP wine at the two pH levels at 500 nm, showed that there is a slight increase in absorbance when the pH level was lowered to pH 1.0. The absorbance of the PI wine was about three times higher than the NP wine. The addition of H2O2, which form part of the reactive oxygen species (ROS), reacts more aggressively with hydroxyl substrates leading to a darker hue of pink (Oliveira et al., 2011). In his epic study, Simpson (1977a) proved that there is no colour difference by reducing the pH of pink wine. He concluded that, if there is no colour difference after reducing the pH, anthocyanins were not the cause of pinking.
When a white wine pinked in a bottle, a definite pinkish or salmon-red discolouration can be observed. This study showed that there were no significant differences between treatment at wine pH and its corresponding pH 1.0. This can lead to a conclusion that a decrease in pH does not influence the colour of a pinked wine, which support the findings of Simpson (1977a). The darker discolouration observed with the addition of H2O2 showed a strong oxidising effect on oxidisable wine components.
Isolation of the pinking compounds from Sauvignon blanc wines by PVPP column chromatography
In rare cases, pinking is observed after bottling. A small percentage are perceived by members of the Wine and Spirit Board tasting and are then rejected (unpublished SAWIS data). The strategy of most winemakers is to work preven-tatively by adding polyvinylpolypyrrolidone (PVPP) to their wine during the blending and/or fining stage. For this reason, PVPP was used for the following experiment. To 1 L of wine, 0.8 g/L PVPP was added to the control, NP and PI wine samples. The PVPP was filtered out and loaded to empty SPE cartridges before eluted with 3 mL of acetonitrile, acetone, an aqueous solution of 1% HCl, ethanol and 0.1 M NH3 in ethanol sequentially. All the eluted samples had a clear liquid except for the PI samples that were eluted with 0.1 M NH3, which had a darker pink/red colour. A low-intensity peak was observed at 479.083 g/mol ([m+H]) for the PI samples of all 0.1 M NH3 eluates. There were 62 compounds listed on Metfrag and corresponds to the molar mass of which petunidin-3-O-glucoside, petunidin-3-O-galactoside and 4-O-methyldelphinidin-3-glucoside best-fit anthocyanins that could contribute to a pinkish colour in the wine. Only the petunidin-3-O-glucoside corresponds to anthocyanins found by Andrea-Silva et al. (2014) and Cosme et al. (2019). Flavonoid concentrations in the NP and K samples were too low to be detected. There was nothing to detect in the other eluents.
Although malvidin was found in Siria, it seems that pe-tunidin cannot be excluded in Sauvignon blanc wines. Further research is needed in analysing Sauvignon blanc wines to ensure the effect of any monomeric anthocyanins and their influence on the pinking susceptibility of the wines.
Determination of total monomeric anthocyanins
Monomeric anthocyanins were measured in the control (K), NP and PI wines according to the AOAC method (Lee, 2005). The control and NP wines had very low quantities of monomeric anthocyanins (40 and 10 µg/L, respectively), while the PI wines had more than twice the concentration of monomeric anthocyanins (90 µg/L). This confirms the study done by Arapitsas et al. (2015), that there are trace amounts of monomeric anthocyanins in white cultivars. The concentrations measured are well below the limit determined by Andrea-Silva et al. (2014) of 300 µg/L for pinking to become detectable in Siria wine. The research of Andrea-Silva et al. (2014) and Arapitsas et al. (2015) showed the possibilities of anthocyanin formation in white cultivars and the different concentrations that can be found in different white cultivars. Arapitsas et al. (2015) showed the concentrations for the 2011 harvest year for Sauvignon blanc (55.44 µg/kg), Riesling (138.99 µg/kg), Gewurztraminer (1094.90 µg/kg), Chardonnay (37.05 µg/kg) and Moscateller (922.00 µg/kg). Although this study confirms the possibility of anthocyanins present in white grape cultivars, it also is shown that the quantities are below the concentration to induce pinking in, especially, Sauvignon blanc. Several studies have shown that white grape cultivars possess the VvmybA1 gene for anthocyanin expression, but that these genes are recessive (Jeong et al., 2006; Azuma et al., 2007; This et al., 2007; Mitani et al., 2009; Terrier et al., 2009; Fournier-Level et al., 2010).
Liquid chromatography-mass spectrometry (LC-MS) analysis
Anthocyanins
Anthocyanins have a very distinct fingerprint in red wines and these fingerprints can be used to distinguish between different cultivars (Garcia-Beneytez et al., 2003). Although that may be the case for red cultivars, finding anthocyanins in white wine even if the wine has pinked, can be problematic. Analysis of anthocyanins by LC-MS throughout this study always showed anthocyanins to be non-detectable, reflecting either concentrations less than the detection limit of 1 mg/L or the absence of anthocyanins in the samples. LC-MS results confirmed FT-MIR results, showing no or non-detectable levels of anthocyanins. Although anthocyanin is known to only be present in coloured grape berries, a study done by Arapitsas et al. (2015) showed trace amounts of delphinidin-3-O-glucoside, cyanidin-3-O-glucoside, peoni-din-3-O-glucoside, petunidin-3-O-glucoside and malvidin-3-O-glucoside (ng/kg) in white grape cultivars Chardonnay, Riesling, Gewurztraminer, Moscateller and Sauvignon blanc after analyses with UPLC-MS-MS. In analysing our pinked samples and their corresponding control samples (non-pinked Sauvignon blanc wines) with LC-MS, no clear differences in spectra were evident between the samples analysed. This also led to the conclusion that anthocyanins were not detected, and probably, therefore, had no influence on pinking in our wine.
Phenols
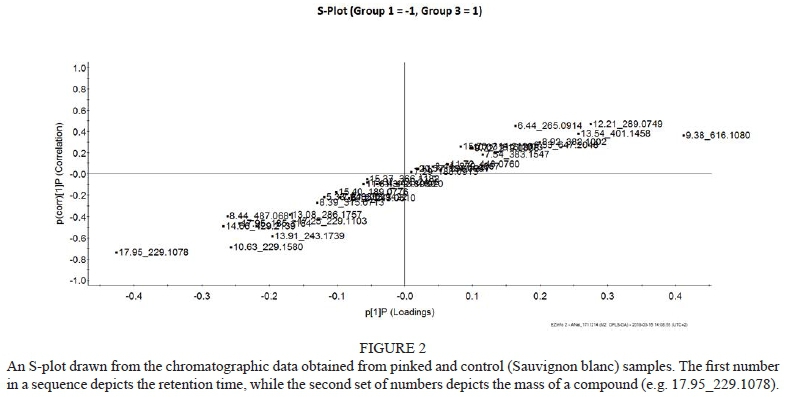
An untargeted LC-MS analysis of the control and pinked sample showed peaks corresponding to phenolic compounds normally found in white wines. The difficulty with using the LC-MS became evident when peaks could be seen, but the compounds corresponding to the given mass could not be identified. The internal library of the LC-MS was more calibrated for pharmaceuticals, with numerous compounds added continuously to the MS library for wine metabolites to represent the chemical complexity of wines. A different approach was necessary to evaluate the impact of the different masses found and S-plots were constructed from the LC-MS raw data (Figure 2). The S-plots are a screening tool that can be used to identify possible masses contributing to the difference between the control and pinked wines. The potential distinctive timemass numbers are distributed on the S-plot (upper right and lower left of the S-plot). A list of timemass compounds, which may influence the pink wine, was generated. In Table 1 the masses of compounds with the most influences, to either the control or pinked samples, with their retention times in brackets, are depicted.
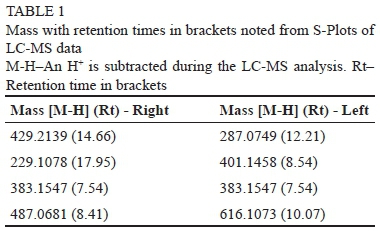
From this S-plot (Figure 2) the timemass compounds considered to be the main contributors, but not the only ones, driving the differences between the matrices were 429 (14.66), 229 (17.95), 383 (7.54) and 487 (8.41) on the left side of the S-plot and 287 (12.21), 401 (8.54), 383 (7.54) and 616 (10.07) on the top of the S-plot. The only compound which could be positively identified, with regards to the LC-MS in Table 2, is GRP which correlates with a mass of 616.1073. The closest phenolic compounds that fit the masses in Table 2 are Daidzein 4'-O-glucuronide (429.2139 - not found in wine), dihydro-resveratrol (229.1078), 5-(3',5'-dihydroxyphenyl)-valerolactone-3-O-glucuronide (383.1547 - not found in wine), 6"-O-acetylglycitin (487.0681 - not found in wine), phlorin (287.0749 - not found in wine), 5-heneicosenylresorcinol (401.1458 - not found in wine). These compounds are plant metabolites and are associated with water stress (De Sanctis et al., 2012) or the response of plants against fungal attack.
In all the analyses that were done on pinked wine in this study, the data generated indicates either low levels (non-detected) or no signs of the presence of phenolic substances that could cause pinking in white wines. A new theory was hypothesised that phenols may not lead to pinking but that another type of compound plays a role. This new theory took an interesting turn in the discovery of a series of articles written on pinking in onions. In these articles, the authors showed that certain amino acids (the most common one is L-cysteine) which react with thiosulfinates to form compounds that turn onions and garlic pink in the presence of oxygen (Shannon et al., 1967; Kubec et al., 2004a, b; Dong et al., 2010; Kubec & Velisek, 2007; Kucerová et al., 2011; Kubec et al., 2015). This opens a new path in further research for the pinking compound.
Grape reaction product (GRP)
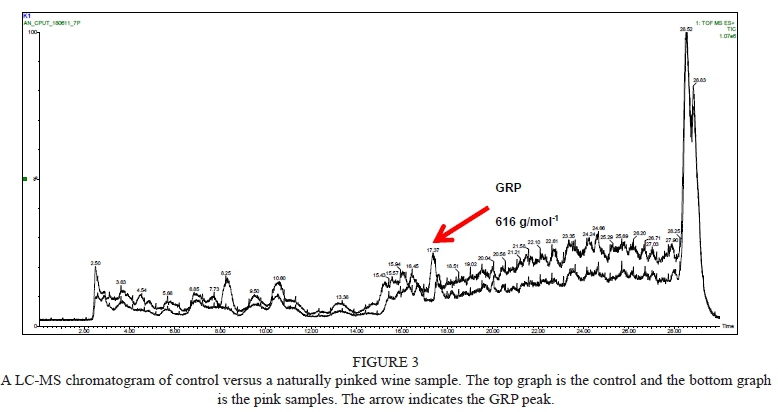
Glutathione (GSH) is a natural tripeptide present in grapes and wines. Its antioxidant properties are particularly useful during winemaking with white varieties like Sauvignon blanc (Kritzinger et al., 2013; Pons et al., 2015). Glutathione is normally found in the pulp and skins of grape cultivars, especially Sauvignon blanc. An increase in skin contact time for this cultivar could increase the glutathione concentration by as much as 55% (Pons et al., 2015). Polyphenol oxidase (PPO) has the ability to oxidise caftaric acid and/or coutaric acid to form o-diphenols (Kritzinger et al., 2013). Glutathione reacts with these o-diphenols to form 2-S-glutathionylcaftaric acid (GRP) which cannot be oxidised by PPO. Laccase, from Botrytis cinerea, can oxidise GRP back to o-diphenols, which in turn can lead to browning of white wines (du Toit et al., 2007; Cejudo-Bastante et al., 2010; Roland et al., 2010; Kritzinger et al., 2013; Gambuti et al., 2016). GRP present in must and wine is formed by the chemical or enzymatic oxidation of caftaric acid to its quinone, and reduction of caftaric acid quinone by glutathione. During must oxidation, glutathione concentration decreases while the GRP concentration increases, and will continue to increase until the glutathione pool is exhausted (Vallverdu-Queralt et al., 2015). In Figure 3, the GRP concentration of the control sample is much higher than the pink sample. The control samples was kept under a blanket of CO2 gas to exclude oxygen from the wine; the pink sample was left open for a couple of days to pink naturally. Under oxidation conditions, after depletion of the glutathione, quinones can oxidise other substrates, like GRP or other phenolic compounds, which can lead to a decrease in GRP concentrations (Fracassetti & Tirelli, 2015), explaining the lower GRP concentration in pinked samples. Also, with the formation of H2O2 in the wine, the H2O2 oxidised to hydroxyl radical with the help of Fe2+. This hydroxyl radical has then the potential to further oxidise the GRP to decrease its concentration (Cheynier et al., 1989; Li et al., 2008; Oliveira et al., 2011; Danilewicz & Standing, 2018).
Fourier Transform Infrared (WineScanTM) analysis
A Sauvignon blanc wine was naturally pinked by standing outside for three days and a control (K) sample was kept in a full bottle with no airspace. After pinking naturally (NP), the pinked and control sample was sent for FTIR analysis. The FTIR scans in the mid-infrared (MIR) spectrum from about 929-4880 cm-1. MIR forms part of the infrared spectrum which can be divided into near-infrared (NIR), mid-infrared (MIR) and far-infrared (FIR). In between the ultraviolet (UV) spectrum and IR is the visible light (Vis) spectrum that is mostly used by spectrophotometers. Therefore, the ranges that are available for researchers are 280-400 nm (UV), 400700 nm (Vis), 700-2 500 nm (NIR), 2 500-5 000 nm (MIR) and 5 000-1 000 000 nm (FIR). The initial research done by Kaffka and Norris (1976) on the use of infrared spectra to analyse wine components, opened up a whole new field of research and studies was done to correlate total soluble solids (Cao et al., 2010), alcohols (Baumgarten, 1987; Yano et al., 1997; Li et al., 1999), volatile acids (Yano et al., 1997), esters (Ribéreau-Gayon et al., 2001), aroma compounds (Vianna & Ebeler, 2001; Díaz-Maroto et al., 2005; Lorenzo et al., 2009), anthocyanins (Janik et al., 2007; Hernández-Hierro et al., 2013) and phenolic compounds (Cozzolino et al., 2004; Cozzolino, et al., 2008) with conventional analytical methods. Using the whole range of MIR spectra, it is possible to see at what ranges significant differences can be observed between a control wine and a pinked wine. Two regions containing strong water absorption, 1582-1698 and 2971-3627 cm-1 and the region from 3627 cm-1 onwards is eliminated because it contains very little useful information (Nieuwoudt et al., 2004; Patz et al., 2004).
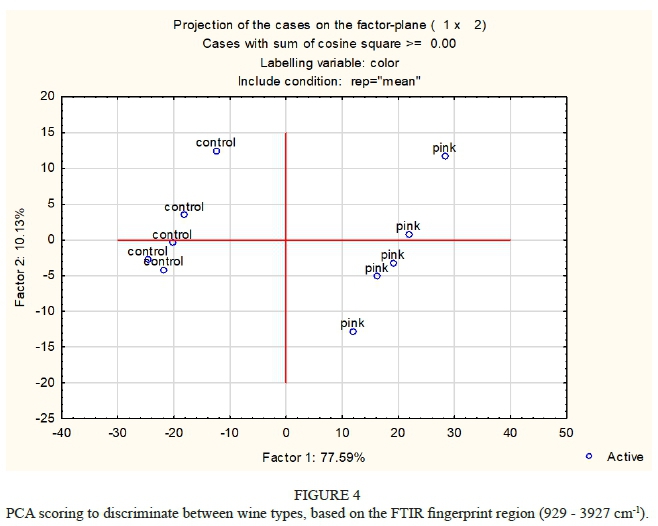
Area Under the Curve (AUC) and Receiver Operating Characteristics (ROC) were used to look at each wavenumber. For each wavenumber, an optimal cut-off value was calculated. On each of these wavenumbers, a student t-test was done to discriminate the significant difference between the control and pink samples. The principal component analysis (PCA) graph explained 87.72% of the variation of the spectra between the control and the pinked samples (Figure 4) indicating distinct groupings of the control and pink samples.
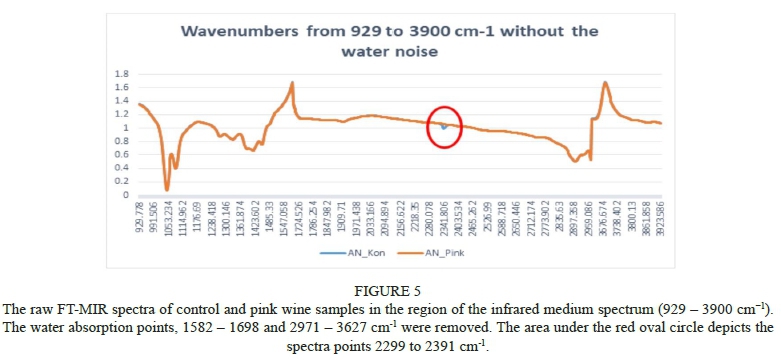
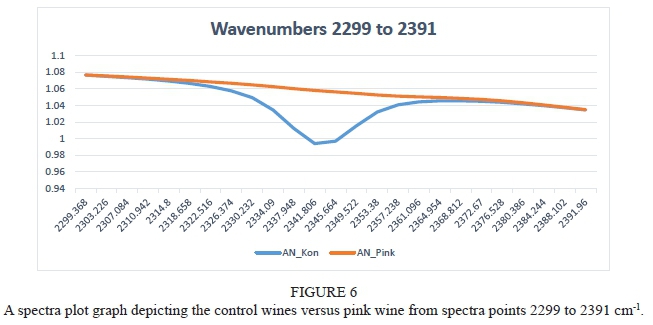
Figure 5 depicts the raw FT-MIR spectra of control and pink wine samples in the region of the infrared medium spectrum (929-3900 cm-1). The water absorption points, 1582-1698 and 2971-3627 cm-1 were removed. The area under the red oval circle depicts the spectra points 2299 to 23 1 cm-1. While there were significant differences from other spectra (as will be depicted later), this area (2299 to 2391 cm-1) showed a definitive difference between the pink and control wine samples, favouring the pink samples (meaning higher spectra values than the control). Figure 6 depicts the spectra between the control and pink wine samples of wavenumbers 2299-2391 cm1. False-positive bands could be identified in this region due to atmospheric CO2 in poorly adjusted and old equipment (2350 cm-1). Samples stored at low temperatures with dissolved CO2 can show a false positive band (2325 cm-1), as well as absorption of gaseous N2 (2330 cm-1) (Socrates, 2001). Compounds fitting the absorption bands of 2299 to 2391 cm-1, could be amines with -NH2+, -NH+ and C=NH+ (2250 - 2700 cm-1) as well as mercaptans (2280 - 2330 cm-1) (Socrates, 2001). This possible absorption of amines could indicate to compounds found in pinking of onions where amino acids bind with thiosulfates (Shannon et al., 1967; Kubec et al., 2004a, b; Dong et al., 2010; Kubec & Velisek, 2007; Kucerová et al., 2011; Kubec et al., 2015). In an extensive study done by Fragoso et al. (2011a, b), the possibility to use FT-MIR in the identification of phenolic compounds was investigated. Grape juice of different phenolic ripeness was analysed, and after the addition of catechin, gallic acid, tannic acid and malvidin-3-O-glucoside, absorptions between 1168-1457 cm-1 (gallic acid), 1133-1160 cm-1 (tannic acid) and 1238-1322 cm-1 (catechin) and 1373-1457 cm-1 (catechin), were noticed. The team of Fragoso (2011a, b) also noticed that with an increase in malvidin-3-O-glucoside concentrations the spectra ranges could not be identified, and therefore suggested that the range for anthocyanins would probably fall between 11081457 cm-1. This was confirmed by Culbert et al. (2015) after studying total phenolic compounds which absorbed between 900-1500 cm-1. Statistical analysis showed a spectral difference between wavenumbers 1096-1373 cm-1, which favours the control samples. The total phenolic concentration analysed by HPLC (data not shown) showed that the control samples had a higher concentration of phenols than the pink samples. Therefore, a logical deduction could be made that total phenolic compounds do not influence the pinking of the wine samples. Janik et al., (2007) showed that pigmented compounds like anthocyanins are in the visible spectrum range between 400-700 nm (25000-14285 cm1). This could explain why no indication of anthocyanins was found as it falls outside of the spectra range used for this study.
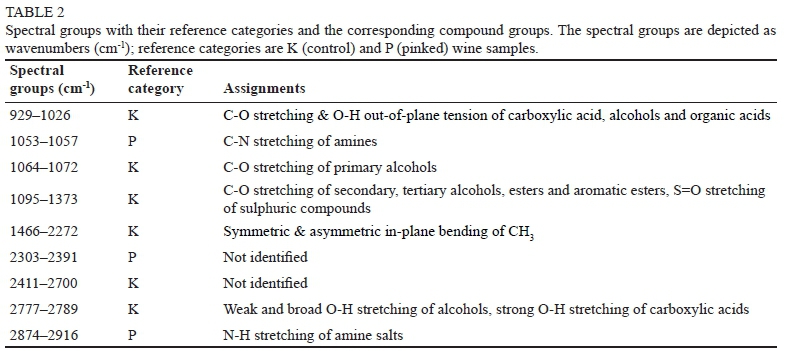
The AUC analysis indicated that 486 wavenumbers showed significant differences between the control and pinked samples. This could be grouped into nine groups of wavenumbers (Table 1) which differ in the number of spectral points in each group. Each of these groups also differs in their sensitivity to reference groups (either control or pink). By using the AUC's optimal cut-off point and testing the sensitivity and specificity of each wavenumber, these spectral groups can be identified as favouring the control samples or the pinked samples (Table 2).
Identification of specific compounds using the frequencies is nearly impossible (Liu, 2006), although certain stretching and vibrating overtones of groups and functional groups are known. The frequency bands of 929-1026 cm-1 shown in Table 2, are associated with C=C bending of alkenes (Sigma-Aldrich), C-O stretching and O-H out-of-plane tension of carboxylic acid, alcohols and organic acids (Cocciardi et al., 2005). These bands favour the control sample and the difference could be a slight difference between alcohol and organic acids of the control and pinked samples. Frequency bands 1053-1057 cm-1 are associated with C-N stretching of amines (Sigma-Aldrich). These bands favour the pinked samples and could show that amino acids may play a role in the pinking of white wines. The frequency bands of 1064-1072 cm-1 are more associated with C-O stretching of primary alcohols (Sigma-Aldrich). Frequency bands 1095-1373 cm-1 encompass a broad range and it can be associated with a whole range of stretching, like C-O stretching of secondary and tertiary alcohols, esters and aromatic esters or S=O stretching of sulphuric compounds (Sigma-Aldrich . The frequency bands of 1466-2272 cm-1 are also a broad range ofbands that can associate with a whole range of compounds, like the C=O stretching of acid halides, acetaldehyde and aliphatic ketones, as well as medium C-H bending of alkenes (Sigma-Aldrich) and symmetric and asymmetric in-plane bending of CH3 (Silva et al., 2014). The spectral group corresponding to 2303-2391 cm-1 is the only spectral group that showed a distinct differentiation between the control and pinked samples (Figure 6). The C-N triple bond of nitriles can, in most cases, peak (with varying intensity) around 2349 cm-1. These C-N triple bonds can be associated with amines, amides, pyridines, nitriles and pyrroles, which is a constituent of 3-3'-dithio-2,2-dipyrrole which led to pinking in Allium species of garlic and onions (Hu et al., 2010). The frequency bands of 2777-2789 cm1 are more associated with strong O-H stretching of carboxylic acids or a weaker O-H stretching of alcohols (Sigma-Aldrich) which favours the control sample. The last frequency ranges of 2874-2916 cm-1 favour the pinking samples and are associated with C-H stretching of alkenes and strong N-H stretching of amine salts. This range, in conjunction with range 1053-1057 cm-1, could also indicate an association with amino acids that may influence the pinking of white wines.
CONCLUSIONS
Changes in the visible absorption spectra with increased absorption at 500 nm, and in CIELab chromatographic characteristics with pinking, indicate a transformation in the presence of oxygen of some specific chemical compound(s) in susceptible varieties like Sauvignon blanc. The ÂE* showed that the consumer can definitely distinguished between a control wine and a pink wine which corresponds to 0.02 and 0.03 AU on a spectrophotometer and that pinking is visible for a consumer. Slight increases in absorbance with acidification of wines, and LC-MS analysis of PVPP and solid phase extracted pinked Sauvignon blanc wines indicate the possibility of monomeric anthocyanins and more particularly petunidin present in Sauvignon blanc, albeit at very low concentration. Although petunidin is the anthocyanin in Sauvignon blanc, malvidin has been reported to cause pinking in Siria. Follow-up investigations need to incorporate the anthocyanin expression of the recessive VvmybA1 gene, present in white grape cultivars including Sauvignon blanc, as well as the role of amino acids and GRP. FTIR and LC-MS analyses in this study showed differences in amines and GRP of pinked and un-pinked wines. Amines could indicate amino acids. In onions, certain amino acids (i.e. L-cysteine) (containing an amine group) can bind to thiosulfonates to form S-allylcysteine sulfoxides compounds that induce pinking in onions and garlic. Although amino acids have been extensively researched in wine, thiosulfonates and their forming compounds are unknown in wine and need further investigation. This investigation opened up more possibilities in the ongoing search for compounds responsible for pinking in Sauvignon blanc.
LITERATURE CITED
Andrea-Silva J., Cosme, F., Ribeiro, L.F., Moreira, A.S.P., Malheiro, A.C., Coimbra M.A., Domingues, M.R.M. & Nunes, F.M., 2014. Origin of the pinking phenomenon of white wines. J. Agric. Food Chem. 62, 5651-5659. [ Links ]
Arapitsas, P., Oliveira, J. & Mattivi, F., 2015. Do white grapes really exist? Food Res. Inter. 69, 21-25. [ Links ]
Azuma, A., Kobayashi, S., Yakushiji, H., Yamada, M., Mitani, N. & Sato, A., 2007. VvmybAl genotype determines grape skin color. Vitis. 46 (3), 154-155. [ Links ]
Baumgarten, G.F., 1987. The determination of alcohol in wines by means of near-infrared technology. S. Afr. J. Enol. Vitic. 8 (2), 75-77. [ Links ]
Bevin, C.J., Fergusson, A.J., Perry, W.B., Janik, L.J. & Cozzolino, D., 2006 Development of a rapid "fingerprinting" system for wine authenticity by mid-infrared spectroscopy. J. Agric. Food Chem. 54 (26), 9713-9718. [ Links ]
Boss, P.K., Davies, C. & Robinson, S.P., 1996. Anthocyanin composition and anthocyanin pathway gene expression in grapevine sports differing in berry skin colour. Aust. J. Grape Wine Res. 2, 163-170. [ Links ]
Cao, F., Wu, D. & He, Y., 2010. Soluble solids content and pH prediction and varieties discrimination of grapes based on visible-near infrared spec-troscopy. Comp. Electr. Agric. 71S: S15-S18. [ Links ]
Cejudo-Bastante, M.J., Perez-Coello, M.S. & Hermosin-Cutierrez, I., 2010. Identification of new derivatives of 2-S-glutathionylcaftaric acid in aged white wines by HPLC-DAD-ESI-MS. J. Agric. Food Chem. 58 (21), 1148311492. [ Links ]
Cheynier, V., Souquet, J.M. & Moutounet, M., 1989. Glutathione content and glutathione to hydroxycinnamic acid ratio in Vitis vinifera grapes and musts. Am. J. Enol. Vitic. 40 (4), 320-324. [ Links ]
Cocciardi, R.A., Ismail, A.A. & Sedman, J., 2005. Investigation of the potential utility of single-bounce attenuated total reflectance Fourier Transform Infrared spectroscopy in the analysis of distilled liquors and wines. J. Agric. Food Chem. 53 (8), 2803-2809. [ Links ]
Cosme, F. andrea-Silva, J., Filipe-Ribeiro, L., Moreira, A.S.P., Malheiro, A.C., Coimbra, M.A., Domingues, M.R.M. & Nunes, F.M., 2019. The origin of pinking phenomena in white wines: An update. 41st World Congress of Vine and Wine. BIO Web of Conferences 12, 1-5. [ Links ]
Cozzolino, D., Cynkar, W.U., Dambergs, R.G., Mercurio, M.D. & Smith, P.A., 2008. Measurement of condensed tannins and dry matter in red grape homogenates using near infrared spectroscopy and partial least squares. J. Agric. Food Chem. 56, 7336-7631. [ Links ]
Cozzolino, D., Kwiatkowski, M.J., Parker, M., Cynkar, W.U., Dambergs, R.G. & Gishen, M., 2004. Prediction of phenolic compounds in red wine fermentations by visible and near infrared spectroscopy. Anal. Chim. Acta. 513, 73-80. [ Links ]
Culbert, J., Cozzolino, D., Ristic, R. & Wilkinson, K., 2015. Classification of sparkling wine style and quality by MIR spectroscopy. Mol. 20, 83418356. [ Links ]
Danilewicz, J.C. & Standing, M.J., 2018. Reaction mechanisms of oxygen and sulfite in red wine. Am. J. Enol. Vitic. 69 (3), 189-195. [ Links ]
De Sanctis, F., Silvestrini, M.G., Luneia, R., Botondi, R., Bellincontro, A. and Mencarelli, F., 2012. Postharvest dehydration of wine white grapes to increase genistein, daidzein and the main carotenoids. Food Chem. 135, 1619-1625. [ Links ]
Diaz-Maroto, M.C., Schneider, R., & Baumes, R., 2005. Formation pathways of ethyl esters of branched short-chain fatty acids during wine aging. J. Agric. Food Chem. 53, 3503-3509. [ Links ]
Dong, Y., Wang, D., Li, M., Hu, X. & Zhao, G., 2010. One new pathway for Allium discoloration. Food Chem. 119, 548-553. [ Links ]
Du Toit, W.J., Lisjak, K., Stander, M. & Prevoo, D., 2007. Using LC-MSMS to assess glutathione levels in South African white grape juices and wines made with different levels of oxygen. J. Agric. Food Chem. 55 (8), 27652769. [ Links ]
Fawcett, T. 2006. An introduction to ROC analysis. Pattern Recogn. Lett. 27, 861-874. [ Links ]
Fournier-Level, A., Lacombe, T., Le Cunff, L., Boursiquot, J-M. & This, P., 2010. Evolution of the VvMybA gene family, the major determinant of berry colour in cultivated grapevine (Vitis vinifera L.). Heredity. 104, 351-362. [ Links ]
Fracassetti, D. & Tirelli, A., 2015. Monitoring of glutathione concentration during winemaking by a reliable high-performance liquid chromatography analytical method. Austr. J. Grape Wine Res. 21, 389-395. [ Links ]
Fragoso, S., Aceña, L., Guasch, J., Busto, O. & Mestres, M., 2011a. Application of FT-MIR spectroscopy for fast control of red grape phenolic ripening. J. Agric. Food Chem. 59, 2175-2183. [ Links ]
Fragoso, S., Guasch, J., Aceña, L., Mestres, M. & Busto, O., 2011b. Prediction of red wine colour and phenolic parameters from the analysis of its grape extract. Int. J. Food Sci. Technol. 46, 2569-2575. [ Links ]
Gambuti, A., Rinaldi, A., Romano, R., Manzo, N. & Moio, L., 2016. Performance of a protein extracted from potatoes for fining of white musts. Food Chem. 190, 237-243. [ Links ]
García-Beneytez, E., Cabello, F. & Revilla, E., 2003. Analysis of grape and wine anthocyanins by HPLC-MS. J. Agric. Food Chem. 51 (19), 5622-5629. [ Links ]
Giguere, P.A., 1983. Molecular association and structure of hydrogen peroxide. Textbook Forum. 60 (5), 399-401. [ Links ]
Hernández-Hierro, J.M., Nogales-Bueno, J., Rodríguez-Pulido, F.J. & Heredia, F.J., 2013. Feasibility study on the use of Near-Infrared hyperspectral imaging for the screening of anthocyanins in intact grapes during ripening. J. Agric. Food Chem. 61, 9804 - 9809. [ Links ]
Hu, D., Zhang, J., Zhang, T., Dong, J., Leng, X. & Zhao, G., 2020. Characterization of yellow pigments formed on reaction of 2-(1H-pyrrolyl) carboxylic acids with pyruvic acid in garlic greening model systems. Food Res. Int. 43, 915-921. [ Links ]
Imai, S., Akita, K., Tomotake, M. & Sawada, H., 2006. Identification of Two Novel Pigment Precursors and a Reddish-Purple Pigment Involved in the Blue-Green Discoloration of Onion and Garlic. J. Agric. Food Chem. 54 (3), 843-847. [ Links ]
International Organisation of Vine and Wine (OIV), 2012. Compendium of international methods of wine and must analysis. Vol. 1. Paris. 1-488. [ Links ]
Janik, L.J., Cozzolino, D., Dambergs, R., Cynkar, W. & Gishen, M., 2007. The prediction of total anthocyanin concentration in red-grape homogenates using visible-near-infrared spectroscopy and artificial neural networks. An-alytica Chimica Acta. 594, 107-118. [ Links ]
Jeong, S-T., Goto-Yamamoto, N., Hashizume, K., Kobayashi, S. & Esaka, M., 2006. Expression of VvmybA1 gene and anthocyanin accumulation in various grape organs. Am. J. Enol. Vitic. 57 (4), 507-510. [ Links ]
Jones, T., 1989. Pinking of white table wines - further studies. Unpublished Master's thesis. University of California, Davis, CA, USA. [ Links ]
Kaffka, K.J. & Norris, K.H., 1976. Rapid instrumental analysis of composition of wine. Acta aliment. 5 (3), 267-279. [ Links ]
Kritzinger, E.C., Bauer, F.F. & du Toit, W.J., 2013. Role of glutathione in winemaking: A review. J. Agric. Food Chem. 61, 269-277. [ Links ]
Kubec, R., Hrbácocá, M., Musah, R.A. & Velísek, J., 2004a. Allium discoloration: Precursors involved in onion pinking and garlic greening. J. Agric. Food Chem. 52 (16), 5089-5094. [ Links ]
Kubec, R., Hrbácocá, M., Musah, R.A. & Velísek, J., 2004b. Allium discoloration: The nature of onion pinking and garlic greening. Czech J. Food Sci. 22 (Special Issue), 109-112. [ Links ]
Kubec, R. & Velísek, J., 2007. Allium discoloration: The color-forming potential of individual thiosulfinates and amino acids: Structural requirements for the color-developing precursors. J. Agric. Food Chem. 55 (9), 3491-3497. [ Links ]
Kubec, R., Urajova, P., Lacina, O., Hajslova, J., Kuzma, M. & Zápal, J., 2015. Allium discoloration: Color compounds formed during pinking of onion and leek. J. Agric. Food Chem. 63, 10192-10199. [ Links ]
Kucerová, P., Kubec, R., Simek, P., Václavík, L. & Schraml, J., 2011. Allium discoloration: The precursor and formation of the red pigment in giant onion (Allium giganteum Regel) and some other subgenus Melanocrommyum species. J. Agric. Food Chem. 59, 1821-1828 [ Links ]
Lee, E.J., Yoo, K.S. & Patil, B.S., 2010. Identification of candidate amino acids involved in the formation of pink-red pigments in onion (Allium cepa L.) juice and separation by HPLC. J. Food Sci. 75 (8), C684-C689. [ Links ]
Lee, J., 2005. Determination of total monomeric anthocyanin pigment content of fruit juices, beverages, natural colorants and wines by the pH differential method: collaborative study. J. AOAC Int. 88 (5), 1269-1278. [ Links ]
Li, Y., Brown, C.W. & Lo, S.-C., 1999. Near infrared spectroscopic determination of alcohols-solving non-linearity with linear and non-linear methods J. Near Infrared Spectrosc. 7, 55-62. [ Links ]
Li, H., Guo, A., & Wang, H., 2008. Mechanisms of oxidative browning of wine. Food Chem. 108, 1-13. [ Links ]
Liu, L., 2006. Geographical classification of wines using vis-NIR spectroscopy. Unpublished Master's thesis. School of Chemical Engineering. Shenyang Pharmaceutical University, China. [ Links ]
Lorenzo, C., Garde-Cerdán, T., Pedroza, M.A., Alonso, G.L. & Salinas, M.R., 2009. Determination of fermentative volatile compounds in aged red wines by near infrared spectroscopy. Food Res. Intern. 42, 1281-1286. [ Links ]
Martinez, J.A., Melgosa, M., Perez, M.M., Hita, E. and Negueruela, A.I.I., 2001. Visual and instrumental color evaluation in red wines. Food Sci. Technol. Int. 7 (5), 439-444. [ Links ]
Mitani, N., Azuma, A., Fukai, E., Hirochika, H. & Kobayashi, S., 2009. A retrotransposon-inserted VvmybA1a allele has been spread among cultivars of Vitis vinifera but not North American or East Asian Vitis species. Vitis. 48 (1), 55-56. [ Links ]
Monagas, M., Bartolomé, B. & Gómez-Cordovés, C., 2005. Updated knowledge about the presence of phenolic compounds in wine. Critical Reviews in Food Science and Nutrition, 45, 85-118. [ Links ]
Nieuwoudt, H.H., Prior, B.A., Pretorius, I.S., Manley, M. & Bauer, F.F., 2004. Principal component analysis applied to Fourier Transform Infrared Spectroscopy for the design of calibration sets for glycerol prediction models in wine and for the detection and classification of outlier samples. J. Agric. Food Chem. 52 (12), 3726-3735. [ Links ]
Oliveira, C.M., Ferreira, A.C.S., De Freitas, V. & Silva, A.M.S., 2011. Oxidation mechanisms occurring in wines. Food Res. Int. 44 (5), 1115-1126. [ Links ]
Palma, M. & Barroso, C.G., 2002. Application of FT-IR spectroscopy to the characterisation and classification of wines, brandies and other distilled drinks. Talanta 58, 265-271. [ Links ]
Patz, C.-D., Blieke, A., Ristow, R. & Dietrich, H., 2004. Application of FT-MIR spectrometry in wine analysis. Anal. Chim. Acta 513, 81-89. [ Links ]
Pfanzagl, J. & Sheynin, O., 1996. Studies in the history of probability and statistics XLIV A forerunner of the t-distribution. Biometrika. 83 (4), 891898. [ Links ]
Pons, A., Lavigne, V., Darriet, P. & Dubourdieu, D., 2015. Glutathione preservation during winemaking with Vitis Vinifera white varieties: Example of Sauvignon blanc grapes. Am. J. Enol. Vitic. 66 (2), 187-194. [ Links ]
Ribereau-Gayon, P., Glories, Y., Maujean, A., & Dubourdieu, D. (2001). In Handbook of Enology. The chemistry of wine stabilization and treatments (Vol. 2). Chichester: John Wiley & Sons Ltd. [ Links ]
Roland, A., Vialaret, J., Razungles, A., Rigou, P. & Schneider, R., 2010. Evolution of S-cysteinylated and S-glutathionylated thiol precursors during oxidation of Melon B. and Sauvignon blanc musts. J. Agric. Food Chem. 58 (7), 4406-4413. [ Links ]
Shannon, S., Yamaguchi, M. & Howard, F.D., 1967. Precursors involved in the formation of pink pigments in onion purees. J. Agri. Food Chem. 15 (3), 423-426. [ Links ]
Shapiro, S.S. & Wilk, M.B., 1965. An analysis of variance test for normality (complete samples). Biometrika. 52 (3/4), 591-611. [ Links ]
Silva, S.D., Feliciano, R.P., Boas, L.V. & Bronze, M.R., 2014. Application of FTIR-ATR to Moscatel dessert wines for prediction of total phenolic and flavonoid contents and antioxidant capacity. Food Chem. 150, 489-493. [ Links ]
Simpson, R.F., 1977a. Oxidative pinking in white wines. Vitis. 16, 286-294. [ Links ]
Simpson, R.F., 1977b. Pinking in Australian white table wines. Austr. Wine Brew Spirit Rev. 56-58. [ Links ]
Simpson, R.F., Miller, G.C. & Orr, G.L., 1982. Oxidative pinking of white wines: recent observations. Food Tech. Austr. 34 (1), 44-47. [ Links ]
Singleton, V.L. & Esau, P., 1969. Phenolic substances in grapes and wine and their significance. Adv. Food Res. Suppl. 1, 1-282. [ Links ]
Singleton, V.L., Trousdale, E. & Zaya, J., 1979. Oxidation of wines I. Young white wines periodically exposed to air. Am. J. Enol. Vitic. 30 (1), 49-54. [ Links ]
South African Wine Laboratory Association (SAWLA). 2002. Methods of analysis for wine laboratories. Stellenbosch. [ Links ]
Terrier, N., Torregrosa, L., Ageorges, A., Vialet, S., Verries, C., Cheynier, V. & Romieu, C., 2009. Ectopic expression of VvMybPA2 promotes proan-thocyanidin biosynthesis in grapevine and suggests additional targets in the pathway. Plant Physiology. 149, 1028-1041. [ Links ]
This, P., Lacombe, T., Cadle-Davidson, M. & Owens, C.L., 2007. Wine grape (Vitis vinifera L.) color associates with allelic variation in the domestication gene VvmybA1. Theor. Appl. Genet. 114, 723-730. [ Links ]
Tobe, S.J., 1983. Pinking in table wines from white grapes. Unpublished thesis. University of California Davis [ Links ]
Vaimakis, V. & Roussis, L., 1993. Must oxigination and polyphenoloxidase inhibition and the oxidation of white wine. Lebensm. Wiss. Technol. 26(2), 133-137. [ Links ]
Vallverdu-Queralt, A., Verbaere, A., Meudec, E., Cheynier, V. & Sommerer, N., 2015. Straightforward method to quantify GSH, GSSG, GRP and hy-droxycinnamic acids in wines by UPLC-MRM-MS. J. Agric. Food Chem. 63, 142-149. [ Links ]
Van Wyk, C., Louw, A. & Rabie, M., 1976. The effect of reductive wine making conditions on wine quality and composition. In Proceedings of the 11th International Oenological symposium, June 3-5, Sopron, Budapest, Hungary. 180-200. [ Links ]
Vianna, E. & Ebeler, S.E., 2001. Monitoring ester formation in grape juice fermentations using solid phase micro-extraction coupled with gas chromatography-mass spectrometry. J. Agric. Food Chem. 49, 589-595. [ Links ]
Yano, T., Aimi, T., Nakano, Y. & Tamai, M., 1997. Prediction of the concentrations of ethanol and acetic acid in the culture broth of a rice vinegar fermentation using near-infrared Spectroscopy. J. Ferm. Bioeng. 84 (5), 461-465. [ Links ]
Zoecklein, B., Fugelsang, K., Gump, B. & Nury, F., 1995. Phenolic compounds and wine color. In Wine analysis and production. New York: Chapman and Hall: 115-151. [ Links ]
Submitted for publication: September 2020
Accepted for publication: October 2021
* Corresponding author: nelap@cput.ac.za
Acknowledgements: This work was supported by the Agricultural Research Council, Winetech and the National Research Foundation (NRF), South Africa (grant number UID 96361). Opinions expressed and conclusions arrived at are those of the authors and are not necessarily to be attributed to the NRF

