


Services on Demand
Article
 English (pdf)
 Article in xml format
 Article references
Indicators

Related links
-
 Cited by Google
 -
 Similars in Google
Share

 Permalink
South African Journal of Enology and Viticulture
On-line version ISSN 2224-7904
Print version ISSN 0253-939X
S. Afr. J. Enol. Vitic. vol.42 n.2 Stellenbosch 2021
http://dx.doi.org/10.21548/42-2-4522
ARTICLES
Bottle Fermented Sparkling Wine: Cork or Crown Closures During the Second Fermentation?
N. JollyI, *; P. MinnaarI; M. BooyseII; P. GerberIII
IPost-Harvest and Agro-Processing Technologies, ARC Infruitec-Nietvoorbij, Agricultural Research Council, Private Bag X5026, Stellenbosch, 7600, South Africa
IIAgricultural Research Council, Biometry, Private Bag X5026, Stellenbosch 7600, South Africa
IIIColmant Cap Classique & Champagne, P.O. Box 602, Franschhoek, 7690, South Africa
ABSTRACT
Bottle-fermented sparkling wine producers are continuously striving to increase quality and produce niche products. One production tool that could be used is a cork closure instead of a crown cap closure during the second fermentation and maturation on yeast lees. Anecdotal evidence suggests that this leads to stylistic differences in the wine. Six pairs of South African bottle-fermented sparkling wines (Méthode Cap Classique), closed by either a cork or crown cap, were investigated. Analyses included bottle pressure, infrared spectroscopy, phenolic acids, sensory attributes and CO2 kinetics. Generally, there were differences between the cork-closed and crown-capped wines. Cork-closed wines tended to have lower pressure compared to crown-capped wines, albeit still well within legal requirements. Other differences were evident in the infrared spectral data and in the polyphenol profile of the analysed wines. Levels of gallic, caftaric, caffeic and /7-coumaric acids could be used collectively as marker compounds to differentiate between cork-closed and crown-capped wines. The effect of the cork was also evident in the sensory attributes and CO2 kinetics. Cork-closed wines were judged to have smaller bubbles and a longer aftertaste. It was also shown that the cork-closed wines tended to lose CO2 from the glass slower after being poured than their crown-capped counterparts. The data tentatively support the anecdotal evidence that cork can be used during the second fermentation and maturation on the yeast lees to change the style of bottle-fermented sparkling wine.
Key words: Bottle-fermented sparkling wines, cork, crown cap, liquid chromatography, Méthode Cap Classique
INTRODUCTION
The use of a crown cap closure during the second fermentation of bottle-fermented sparkling wine is a standard practice worldwide. This is due to the ease of automation on the bottling and disgorgement line. Prior to the use of crown caps, bottles were closed with a cork held in place with a metal staple (agrafe). The first crown caps were used commercially in 1960 (Comité Champagne, 2020). However, certain producers, notably some of the large Champagne houses in France, never switched to a crown cap during the second fermentation of their premium products and continued using the traditional method (cork) (Denis Bunner, House of Bollinger, personal communication, 2018). This is due to a perceived favourable sensory outcome, despite the risk of cork taint (2,4,6-trichloroanisole). Some of the prestige Champagnes, e.g. Dom Perignon Plénitude, can be in contact with cork while on the yeast lees for up to 15 years before release (Dom Perignon, 2021).
In South Africa, bottle-fermented sparkling wine is known as Méthode Cap Classique (MCC). This segment of the South African wine industry has grown from one producer in 1971, through nine producers during the early 1990s, to a current estimate of 250 producers, with 84 being members of the Cap Classique Producers Association (Cap Classique Producers Association, 2021a). In an increasingly competitive market, these MCC producers continuously attempt to increase quality and produce niche products to maintain market share. One of the tools that can be used is a cork closure instead of a crown cap during the second fermentation.
The use of cork as a closure, and its beneficial role in the maturation of still wines, is a well-researched topic. Compounds such as phenolics migrate from the cork into the still wine in the bottle (Varea et al., 2001; Fernandes et al., 2009; Azevedo et al., 2014; Gabrielli et al., 2016; Pinto et al., 2019). Phenolic compounds have the ability to bind with both proteins and peptides (Di Gaspero et al., 2020). The potential effect of the phenolic/protein interaction in the sparkling wine could theoretically influence the sensory attributes of the wine. However, it is not known if the high pressure in the sparkling wine bottle, and the use of a thin layer of natural cork (two-disc cork) as a closure rather than the traditional still wine cork, will result in the same effect as found in still wines.
Anecdotal evidence noted by MCC producers is that the use of a cork closure during the second fermentation leads to stylistic changes in the wines. These include improved foam stability and bubble retention time (slower loss of CO2 from the glass after pouring), improved bubble texture (smaller bubbles) and an increase in the perceived wine complexity (multiple identifiable sensory elements; Spence & Wang, 2018). It has also been observed that this beneficial 'cork effect' becomes more noticeable the longer the wine is in contact with the cork. However, there is limited published literature to guide South African producers in this practice. A thorough understanding of the effect of cork on sparkling wines can lead to tailoring MCC production to use cork as a beneficial winemaking tool to make stylistic changes to the wine's profile. Therefore, a selection of bottle-fermented experimental and commercial sparkling wines closed with corks and crown caps were investigated for physical, chemical and sensory differences.
MATERIALS AND METHODS
Experimental layout and project logistics
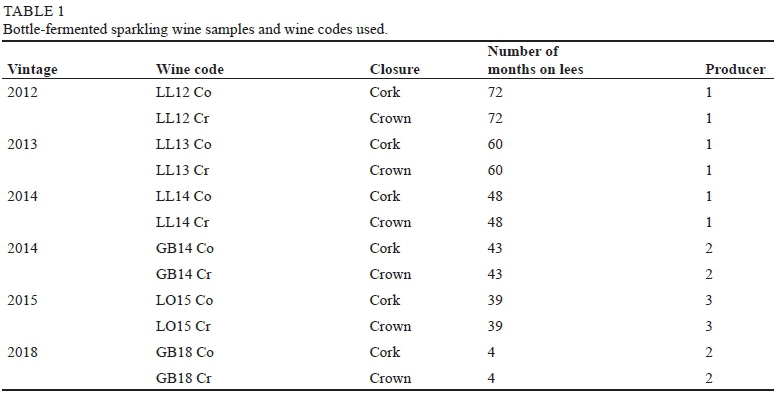
Six treatment pairs of commercial prepared bottle-fermented sparkling wines that had been in contact with the yeast lees for between four and 72 months were obtained for analyses (Table 1). These wines represented five vintages and three South African producers. For each sparkling wine treatment pair, the same wine had either a cork or crown-cap closure during fermentation and maturation on lees. Within each treatment, individual bottles with either a cork or a crown cap were considered replicates (three to five bottles, dependent on the analyses). Corks were secured by either an agrafe staple or wire cage (muselet). The bottles destined for chemical analyses had their lees intact, while wines for sensory analyses and CO2 kinetics were disgorged by the respective cellars and re-closed with crown caps just before the analyses. Disgorged wines received no dosage (sugar solution) or topping up, but ullages were similar for wine pairs. The wines were stored at 15°C until required for analysis.
Bottle opening and sample preparation
Bottle pressure (kPa), and dissolved O2 and CO2 measurements were taken of individual cork-closed and crown-capped bottles (n = 5 for each) using a CBoxQC and SFD filling system (Anton Paar, Austria). The pressure data were corrected to reflect the pressure at 20°C. As the CBoxQC instrument was not designed for use on bottles with corks held in place by an agrafe staple, those wines (LL12) and their accompanying crown-capped wines were first opened manually before measurements were taken. The treatment pair could still be compared, although pressure readings were performed post-opening.
After analysis, the opened wines were transferred to Erlenmeyer flasks and agitated before sampling for microbial analysis. Wines were subsequently clarified and degassed by centrifugation at 6 000 rpm for 10 minutes (Avanti, Beckman-Coulter, Johannesburg, South Africa). The clarified wine was used for chemical analysis.
Microbial and chemical analysis
An unclarified wine sample was used to determine total yeast cell counts using a microscope (400 x magnification) and counting chamber. A clarified wine sample was used for standard wine analyses: pH, malic acid, total acidity, alcohol level (%v/v) using infrared spectroscopy (ALPHA II™ FTIR spectrometer, Bruker, South Africa), residual sugar in °Balling (density meter DMA35, Anton Paar, Austria), yeast assimilable nitrogen (YAN) by the FORMOL titration method (South African Wine Laboratories Association [SAWLA], 2002), and total extract (Koelenhof Laboratory, Stellenbosch). The infrared spectral data with no data pre-processing were subjected to principal component analysis (PCA) with the OPUS software of the ALPHA II™
FTIR spectrometer. The phenolic classes (total phenolic acids, flavanols and flavonols) were determined by a spectrophotometric method (n = 3 bottles per treatment) (Minnaar et al., 2018), while individual levels of gallic acid, caftaric acid, caffeic acid and p-coumaric acid were determined by an HPLC method (n = 5 bottles per treatment) (Minnaar et al., 2017).
The chemical and microbial data were subjected to analysis of variance (ANOVA - continuous data in a completely randomised design) using the General Linear Models Procedure (PROC GLM) of SAS software (Version 9.4; SAS Institute Inc, Cary, USA). The Shapiro-Wilk test was performed on the standardised residuals from the model to verify normality (Shapiro & Wilk, 1965). Fisher's least significant difference was calculated at the 5% level to compare treatment means (Ott & Longnecker, 2016). A probability level of 5% was considered significant for all significance tests. Principal component analysis with a Pearson correlation matrix was performed to investigate the relationship between the different cork and crown treatments and the different variables for each cellar and vintage (XLSTAT software, Addinsoft, Version 2015, Paris, France).
Carbon dioxide kinetics
Carbon dioxide mass loss (with the exception of wines LL13 and LL14) was performed on aliquots of 100 mL ± 4 mL wine poured into standard ISO wine tasting glasses (the same set of glasses was used for all analyses). The method was adapted from Liger-Belair et al. (2009). The modified method used a home-made sparkling wine cradle pourer, enabling the bottle to be kept in a horizontal position while pouring the wine to minimise agitation of the contents of the bottle. The wine glasses were held at an angle of approximately 45° degrees (beer method) to minimise foaming. Four glasses per bottle of three replicate bottles were poured per cork or crown treatment. The average CO2 mass loss was calculated from the measurements of glasses numbers two, three and four on a two decimal balance (Kern PLE 4200-2N, Germany) at five-minute intervals for 20 minutes. The first glass was used to monitor changes in temperature (Crison 638 Pt digital thermometer, Spain) during the evaluation. Glasses were rinsed with hot water between replicates.
Bubble counts were carried out on wine poured into glasses from one bottle each of four cork-crown combinations (LL 12, GB 14, LO 15, GB 18) using a standardised photographic setup (Cannon EOS 600D, 18-megapixel camera with 18 mm to 55 mm zoom lens set to 24 mm; manual focus; sports setting; 20 cm between camera lens and glass surface). A single flute sparkling wine glass (cup dimensions: 130 x 45 mm diameter) was used for all measurements. The flute glass was filled (beer method) with 170 ± 4 mL wine up to approximately 35 mm from the top of the glass. The glass was photographed with back-lighting (LED 7 Watts, 665 Lumens, cool white globe through white material) at zero, ten and 20 minutes (three photos per time interval, representing sub-samples). After cropping the images with Microsoft Photos (Microsoft Corporation version 2019.1907.17920.0) to exclude the glass stem and foam collar, colony-counting software (Open CFU 3.9.0; Geissmann, 2013) was used to count the bubbles in each image using standardised settings (OpenCFU Settings: Threshold = regular, 5; Radius min = 1; Max = Auto-Max; ROls and mask = none) and averaged per image. The counting method did not distinguish between small and large bubble sizes. The same cleaning regime was followed as for the glasses used to measure mass loss. All measurements were done at an ambient temperature of approximately 22°C and started within two minutes of opening the bottle. To enable the data to be compared, the number of bubbles remaining in the glass after 10 and 20 minutes was calculated as a percentage of the original number of bubbles present directly after pouring (time zero).
Sensory analysis
The sensory analysis was carried out using the CATA (check-all-that-apply) method (Jaeger et al., 2015; Alexi et al., 2018) on all the wines, with the exception of the 2018 wines, which had not been on the yeast lees for the prescribed nine months (South African Wine Industry Information and Systems [SAWIS], 2020). A CATA tasting sheet was compiled with the input of sparkling wine producers regarding sensory descriptors. The tasting sheet included seven main descriptor categories (Appearance: bubbles; Appearance: colour; Bubble texture; Aroma & Flavour; Acidity; Mouthfeel/Body character; Aftertaste/Persistence), with 42 sub-categories (attributes). A tasting panel of 12 to 16 staff members (men and women, between the ages of 20 and 65 years), with five to 20 years' experience in wine evaluation (no collective training), were familiarised and trained in the CATA terminology and use of the CATA sheet over three sensory sessions. The logistics of the evaluation sessions were based on the guidelines given by Lawless and Heymann (2010). Evaluation of the cork-closed and crown-capped sparkling wines was done over five sessions with not more than six wines per session. Panellists were requested to check all attributes relevant to the wine sample. The sparkling wines (n = 3, and n = 2 for LL14 and GB14) were served blind as three digit-coded samples in clear ISO wine tasting glasses (ca. 110 mL aliquots) in a randomised manner per panellist. Still water and unsalted crackers were available for palate cleansing, and spittoons for expectoration. The panellists were seated at tables in a manner so that they could not influence or communicate with each other. Lighting was a combination of natural light and daylight-type fluorescent lights, and the ambient temperature in the sensory room was approximately 22°C. The wines were stored at 15°C and opened once the panellists were seated to maximise CO2 content in each glass. Glasses were poured by hand in a manner to minimise foaming.
The data from the CATA questions were analysed by correspondence analysis (CA) to produce a bi-dimensional representation (biplot) of the sparkling wine samples and the relationship between samples and the attributes of the CATA questions. The CA was performed using XLSTAT (Version 2015.1.03.15485, Addinsoft, Paris). A final selection of 25 attributes were used for the biplots. These were: Small bubbles (S_bubbles), Large bubbles (L_bubbles), Few bubbles (< Bubbles), Many bubbles (> Bubbles), No collar, Collar, Foamy, Bubbly, Intense, Shy, Fruity, Matured, Little or no autolysis character (< Autolysis), Pronounced autolysis character (> Autolysis), Yeasty, Toasty, Bruised apple, Low acidity, High acidity, Balanced acidity, Full bodied, Thin, Short aftertaste (Short a/taste), Medium-length aftertaste (Medium a/taste) and Long aftertaste (Long a/taste).
RESULTS AND DISCUSSIONS
This study investigated crown-capped and cork-closed wines from three commercial South African MCC producers (Table 1), representing different cultivar blends, vintages and cork and crown suppliers. The yeast lees contact time ranged from four to 72 months. However, each cork-crown wine pair originated from the same bottling tank, with the only variable being a cork or crown cap closure for the second fermentation and ageing on lees. Consequently, comparisons could be made within a cork-crown wine pair, with overall trends being deduced over the various pairs of wines.
Effect of closure type on pressure, dissolved CO2 and O2
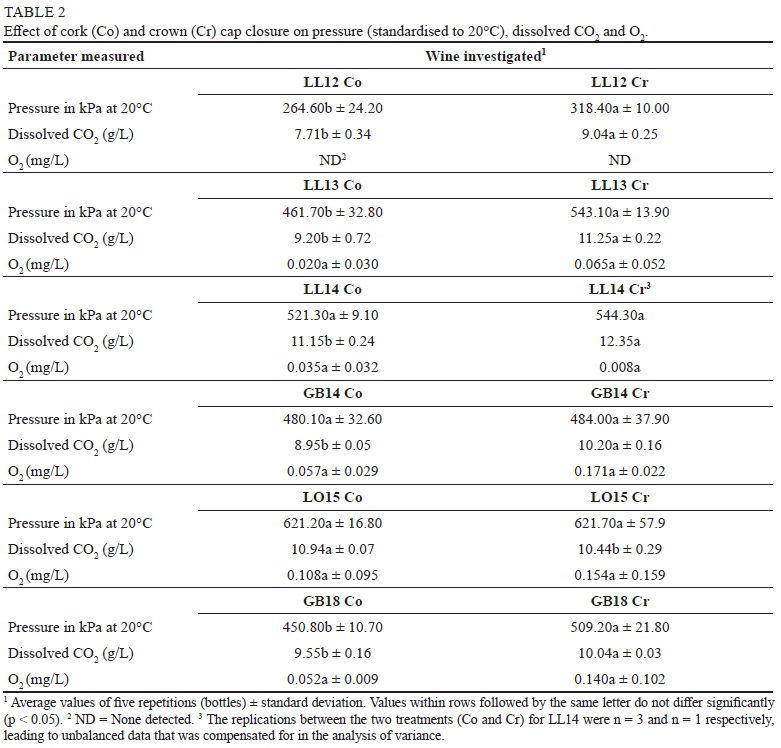
There was a variation in the bottle pressure within replicates of a cork-crown treatment but, overall, crown-capped wines tended to have higher pressures than their corked-closed counterparts, and this was significant for the LL12, LL13 and GB18 wines (Table 2). The dissolved CO2 measurements supported this observation and, with the exception of LO15, were all significantly lower in the cork-closed wine than the crown-capped wine. No significant differences were found in O2 content, although any O2 ingress would be taken up by the wine and not necessarily be reflected as a heightened O2 level. CO2 loss through the cork is not directly proportional to O2 ingress. Based on this dataset, it appears that a crown cap is a more effective barrier than a cork for maintaining the pressure within the bottle. Nevertheless, the final pressure of the cork wines was well within the legal limits (> 300 kPa) for the final product (with the exception of LL12, which was manually opened before the pressure was measured).
Standard wine chemical parameters, mid-infrared (MIR) spectroscopy and total yeast cell count
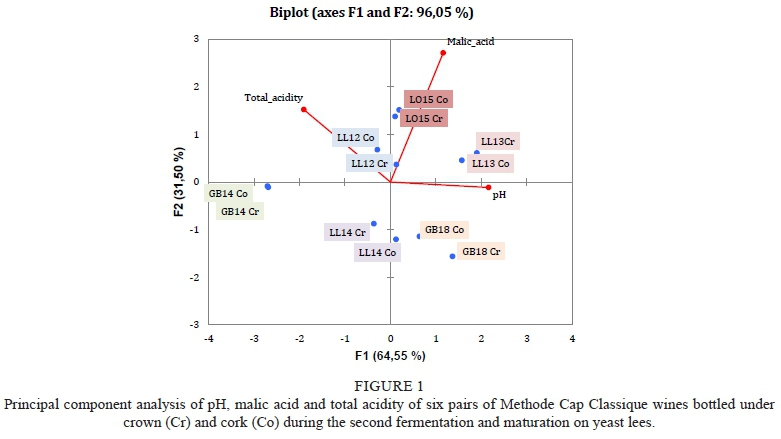
The results of the wine analyses can be divided between parameters that should be affected minimally by the second fermentation (pH, malic acid, total acidity), and those affected directly by the second fermentation (cell count, residual sugar, alcohol, YAN and total extract). Total acidity, pH and malic acid content are determined largely during the blending of the base wine before bottling for the second fermentation, and the second fermentation should have minimal effect on these parameters. The PCA biplot shows that each pair of cork-crown wines was grouped together, verifying the similarity of each wine pair (Fig. 1).
Mid-infrared spectroscopy measures the change in the absorption of energy by different functional groups within chemical compounds. A further application of the infrared spectral fingerprints of the wines generated by the Alpha instrument is that they can be used to determine if the wines differ from one another based on a PCA biplot (Fig. 2). A limitation of this application is that the nature underlying the differences cannot be deduced. However, it is a fast, inexpensive technique to establish differences, before continuing with more advanced and expensive analyses.
Each replicate bottle analysed within a treatment represented a single fermentation, therefore some degree of difference was expected. Despite this, analyses of the infrared spectral data showed varying degrees of separation between the cork-closed and crown-capped wines for the older vintages (Fig. 2a to 2e), and none for the youngest vintage (2018) (Fig. 2f). As the only difference between each pair of wines was the use of the cork versus a crown cap, this dataset supports the hypothesis that a cork can bring about a chemical change in the wine matrix. It also appears to indicate that longer periods of cork contact are required before a chemical change is evident, while supporting the requirement for in-depth analyses.
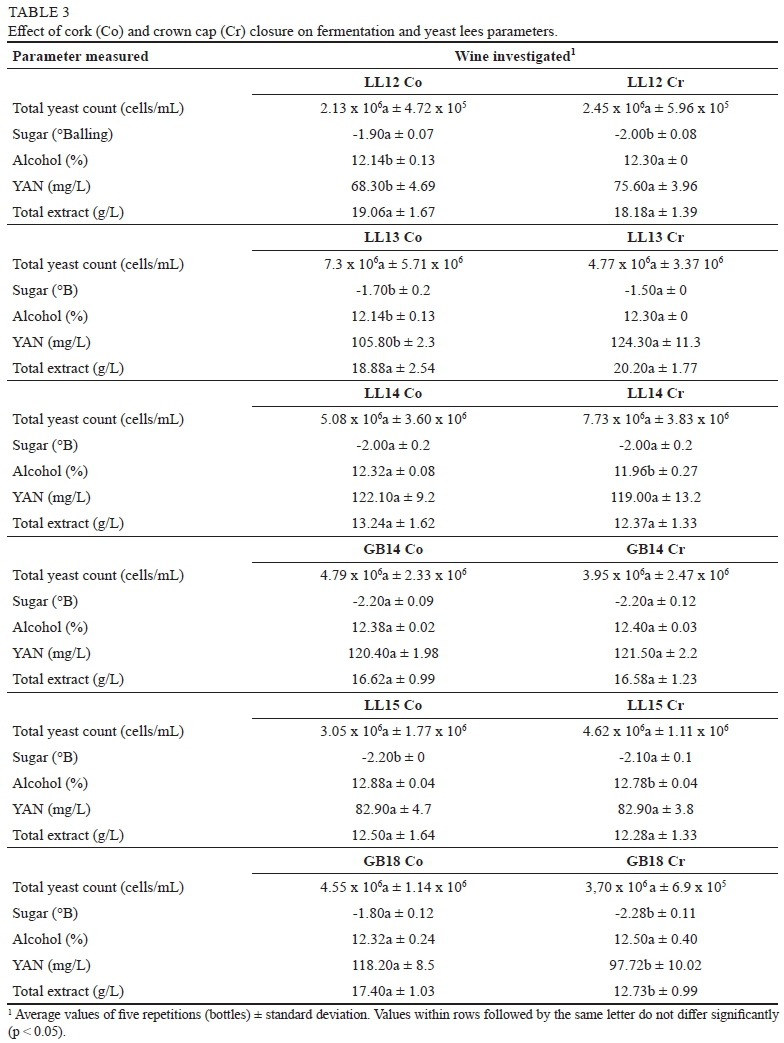
Total yeast cell count, alcohol, residual sugar, YAN and total extract are affected by the second fermentation and maturation on the yeast lees. For some of the individual cork-closed and crown-capped wine pairs, total yeast cell counts, sugar and alcohol levels showed significant differences, but no consistent pattern relating to the closure type was observed (Table 3). These differences could be due to the expected bottle variation related to an insufficient mixing of the wine and yeast in the bottling-line feeder tanks. The position of the bottles in the fermentation/storage bins could have resulted in temperature differences between the bottles. These factors could have affected the rate of fermentation, and thus the final alcohol and residual sugar levels. Notwithstanding, all the wines investigated were dry, with alcohols levels ranging from 11.96% to 12.88%.
Yeast lees contact leads to an increase in the mouthfeel (body) of a wine (Tao et al., 2014), and the process of yeast autolysis results in an increase in nitrogen levels in the wine (Feuillat & Charpentier, 1982). The increase in nitrogen occurs in two phases - in the excretion phase (directly after fermentation) and during yeast autolysis (commencing after a number of months and continuing for several years) (Feuillat & Charpentier, 1982). For these reasons, analyses of YAN and total extract can serve as broad indicators of yeast autolysis, generally regarded as a positive contribution to the sensory attributes of bottle-aged sparkling wines (Feuillat & Charpentier, 1982). However, despite some differences between individual cork-closed and crown-capped wine pairs, there was no consistent pattern relating to specific closure types. The YAN levels were significantly higher in the two oldest crown-capped wines (LL12 Cr, LL13 Cr) compared to their cork counterparts (Table 3). The wines from the middle three vintages (LL14, GB14, LO15) showed no significant differences in YAN between the wine pairs. The youngest wine (GB18) showed the opposite to the oldest wines and had a significantly higher YAN level in the cork-closed wine (GB18 Co). The GB18 cork-closed wine also had significantly higher total extract levels compared to its crown-capped counterpart. There were no significant differences between the other wine pairs regarding the total extract levels. Overall, this can be an indication that yeast autolysis was more advanced in the older crown-capped wines (60 to 72 months on the less) compared to their cork-closed counterparts. For the wines that were on the lees between 39 to 48 months (LL14, GB14, LO15), the data suggest that yeast autolysis was the same for the cork and crown wines. In the youngest wine, which was only on the lees for four months, the high YAN and total extract values suggest that the excretion phase, and possibly the start of autolysis, occurred faster in the cork-closed wine compared to the crown-capped wine.
Phenolic content of the wines
Analyses of phenolic classes (phenolic acids, flavanols, flavonols) and phenolic acids (gallic acid, caffeic acid, p-coumaric acid) were performed to determine the cork effect on the wine. The main source of phenolics in wine is derived from grapes, but phenolic compounds can also be found in cork (Mazzoleni et al., 1998). In still wines, phenolic compounds can migrate from the cork into the wine (Gabrielli et al., 2016). Measurement of phenolic classes (total phenolic acids, flavanols, flavonols), and specifically phenolic acids (gallic, caffeic, caftaric and p-coumaric acids), in wines can therefore be used as marker compounds to determine the effect of the cork in comparison to the crown cap. In this study, there were no significant differences in total phenolic acids between the cork-closed and crown-capped wines (Table 4). This is similar to the results in a previous investigation (Minnaar et al., 2021). There also were no consistent significant differences between the flavanols and flavonols within each wine pair, which is contrary to Minnaar et al. (2021), who found that flavanols and flavonols were lower in cork wines compared to a crown-capped wine.
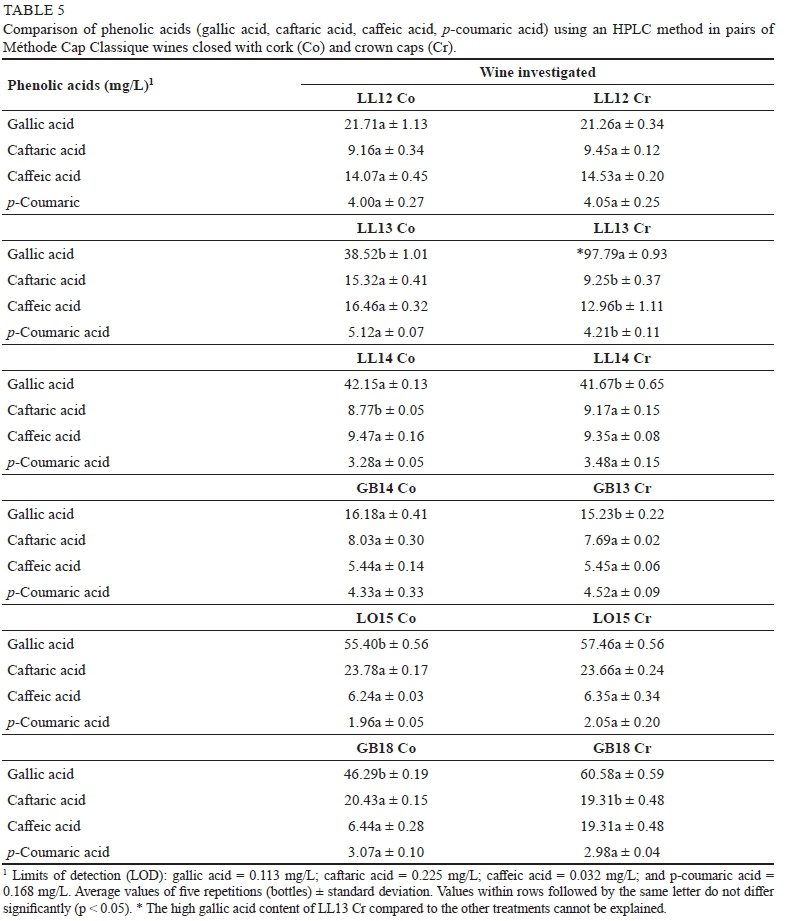
Measurement of the individual phenolic acids (monomeric phenolic compounds) by the HPLC technique showed that, overall, there were no consistent patterns between the levels of gallic, caftaric, caffeic and p-coumaric acids between the cork and crown wines (Table 5). However, gallic acid showed the most variation between the two wines. It was expected that the older wines would have higher levels of gallic acid in the cork wines due to the longer exposure to the cork versus lower levels in the younger vintage (2018). However, this was not substantiated by the data. The oldest wine (2012) showed no significant differences in phenolic acids between cork and crown, while the 2013 wine showed significantly lower gallic acid in the cork wine (approx. 50% lower than the crown wine). The two 2014 wines had significantly more gallic acid in the cork wines (as would be expected due to migration from the cork into the wine), while the 2015 and 2018 wines had significantly lower gallic acid in the cork-closed wine compared to their crown-capped counterpart.
Polymerisation of monomeric phenolic compounds does occur in wine and will result in a decrease in the measured level of these compounds (Monagas et al., 2005; Di Gaspero et al., 2020; Hornedo-Ortega et al., 2020). The change in the monomeric compounds reported in this study could be a result of O2 ingress because the differences in closure type altered the concentrations of phenolic compounds due to polymerisation. This is in agreement with Poças et al. (2010), who reported that bottle closures with different permeability capacity affect the dissolved O2 and, subsequently, the phenolic content in bottled still wines. In addition, phenolic acids, especially gallic acid, can migrate from the cork into the wine, which will further alter the phenolic profile of the wine (Minnaar et al., 2021). The phenolic acids can also combine with other wine compounds (Dufour & Bayonove, 1999; Mazauric & Salmon, 2005). These aforementioned factors can explain the measured differences found in the phenolic acid concentrations reported in this study.
The differences in gallic and caftaric acid concentrations found in the cork and crown wines (2018 vintage) (Table 5) imply that the migration and polymerisation of phenolic acids are faster than originally surmised. Although an anecdotal sensory effect may only be noticed after a number of years of cork contact, the change in phenolic profile can be detected chemically within four months of bottle maturation. In addition, as pointed out by Minnaar et al. (2021), the concentration of phenolic compounds in the wine could be affected by the area of cork in contact with the wine. Factors such as cork roughness and porosity would increase the cork area of the disc in contact with the wine and presumably lead to a higher level of phenolics in the wine.
Further analysis by PCA described between 70% and 99% of the variation in the gallic, caffeic, caftaric and p-coumaric acid data, with separation between the cork-closed and crown-capped wines (Fig. 3). However, there was no consistent pattern of association between individual phenolic acids linked to either cork-closed or crown-capped wines. The cork-closed wines were associated with gallic and p-coumaric acid (LL12 Co, Fig. 3a), caftaric and p-coumaric acid (LL13 Co, Fig. 3b), caffeic acid (LL14, Fig. 3c), and caffeic and gallic acid (GB14, Fig. 4d; GB18, Fig. 4f). The 2015 cork-closed wines did not associate with any particular phenolic acid (Fig. 4e). Therefore, the concentrations of these four acids will have to be used collectively to serve as marker compounds to determine the closure effect on MCC wines.
Sensory analysis
Five treatment pairs of cork and crown wines were judged (LL12, LL13, LL14, GB14, LO15). Of the 42 attributes on the CATA tasting sheet, only 25 elicited sufficient responses to be included in the CA. None of the sparkling wines had any cork taint or faulty corks, and all wines scored zero for the CATA cork-taint question.
Phenolic compounds contribute to wine sensory properties such as astringency and bitterness, and as part of mouthfeel, structure and persistence of flavour; however, these attributes are also affected by levels of sweetness, pH and alcohol (Lesschaeve & Noble, 2005; Romano et al., 2011; De Freitas, 2019). It therefore was expected that the overall differences between the cork-closed and crown-capped wines, as observed in the infrared spectral fingerprints (Fig. 2) and the phenolic data (Fig. 3), would be reflected in the sensory data. The CA of the sensory data explained between 58% and 80% of the variation in the data. Overall, the cork-closed and crown-capped wines did have different sensory profiles, although there were some instances of overlapping (Fig. 4c) not found in the phenolic data (Fig. 3). The differences between the cork-closed and crown-capped wines appeared to be more pronounced in the older wines (2012 to 2014) (Fig. 4a to 4d), and less so in the younger (2015) wine (Fig. 4e), which had been in contact with the cork for a shorter time. Similar to the individual phenolic acid data, there were no consistent sensory attributes linked to a cork or crown wine, or vice versa. This can be ascribed to the different blends, ages and stages of development of the wines. However, overall, the cork wines generally appeared to be associated visually with smaller bubbles, less pronounced autolytic character and a longer aftertaste and, for the older cork-closed wines, with yeasty and sometimes toasty attributes. In contrast, the crown-capped wines were associated with visually larger bubbles, more pronounced autolytic character and a shorter aftertaste. The more pronounced autolytic character could be the result of high levels of yeast autolysis, as reflected in the high YAN levels of the older wines (Table 3).
The smaller bubbles and longer aftertaste found in the cork-closed wines are desirable sensory characteristics and can lead to a perception that these wines are more complex in flavour (Spence & Wang, 2018), whereas the crown-capped wines were less complex. These measured differences tentatively support the view held by MCC producers that cork brings about a stylistic change in their wines.
CO2 kinetics
Sparkling wine is characterised by CO2 content that is not only visually appealing to the consumer as the bubbles and mousse (foam) in the glass (Howe, 2003), but also adds to the typical mouthfeel imparted by the release of dissolved CO2. One of the reasons producers use a cork closure during secondary fermentation is because of anecdotal evidence that bubble retention time is improved and a desired smaller bubble is achieved. To test this, CO2 kinetics were investigated by measuring mass loss from a glass and bubble count over 20 minutes.
As the glass shape and interior glass surface can play an important role in the formation of bubbles due to bubble nucleation sites (scratches, impurities), the use of the same glasses throughout the trial ensured a degree of standardisation (Liger-Belair et al., 2009). The first glass poured is always subjected to a more chaotic flow, which increases the loss of dissolved CO2 through turbulence and bubble entrapment (Liger-Belair et al., 2012), which was also observed in this investigation. For these reasons, the first glass poured was used only for temperature monitoring. The use of a cradle pourer also ensured a more stable pouring technique. The latter, together with holding the glass at a 45° angle, minimised the development of foam on the wine surface, thereby retaining maximum dissolved CO2 in the wine. This was in contrast to the method utilised by Liger-Belair et al. (2012), who used a traditional restaurant Champagne-pouring method into a flute glass to maximise the development of foam on top of the wine. However, despite the differences in glass shape and pouring method, similar exponential decreases in mass were observed to those of Liger-Belair et al. (2001).
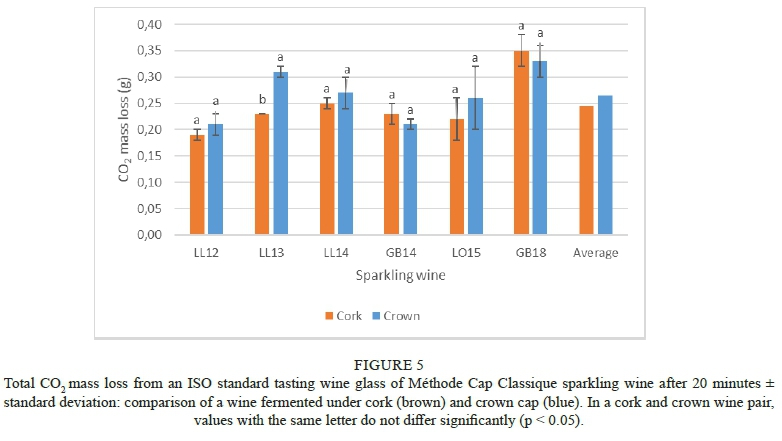
The time duration of 20 minutes is reasonable for consuming a glass of wine after pouring, although many consumers would finish a glass in a shorter time. The temperature of the wine when opened also affects the CO2 kinetics (Liger-Belair et al., 2009), but temperature trials of wines stored at 4°C, 15°C and 22°C showed that an initial temperature of 15°C gave the most consistent results with the least change in wine temperature in the glass. The difference in wine temperature from start to finish was 1.33 ± 0.48°C. However, despite standardisation, there was still some degree of variability in total mass lost across bottle repetitions (Fig. 5). This was also found by Liger-Belair et al. (2009) and was ascribed to the difficulty of replicated pouring into glasses.
The quantity of CO2 that could potentially be lost would depend on the quantity initially present in the bottle, i.e. the bottle pressure. Wines at high pressure would lose CO2 faster than those at low pressure to attain a gas equilibrium. It has also been reported that the turbulence caused during the pouring process results in a notable further loss of dissolved CO2 (Liger-Belair et al., 2009). Therefore, based on the higher pressure readings of the crown-capped wines (Table 2) compared to cork-closed wines, it was expected that the former would lose more CO2 than the latter. It was noted that, for four of the six wines, viz. LL12, LL13, LL14 and LO15, the crown-capped wines lost more CO2 from the glass than the cork wines, but this was only significant for the LL13 wine (Fig. 5). The GB14 and GB18 wines, both from the same producer, showed the opposite, and more CO2 was lost from the corked wine, which was not in agreement with the initial pressure readings. These discrepancies may be due to the pressure readings and mass-loss kinetics measurements being taken from different bottles. The average trend across all treatments, however, showed that the cork wine retained its CO2 content marginally better than the crown-capped wines after pouring (Fig. 5). These differences in wine pressure could be part of the underlying reasons why sparkling wine producers observe that cork-closed wines have better foam stability and bubble retention time than crown-capped wines.
The second part of the CO2 kinetic evaluation determined bubble counts from photographic images of the glasses of wine. Although it was not possible to replicate the data, the values for the different treatments were presented in bar charts to provide a visual description of the different cork-crown wine pairs (Fig. 6). The initial average count (time zero) over all treatments varied and was 881 ± 488 bubbles/image and 826 ± 197 bubbles/image for the cork-closed and crown-caped wines, respectively. The use of a single flute glass for all the measurements eliminated bubble nucleation sites as a variable, therefore the observed differences in bubble counts can be ascribed to intrinsic wine parameters. The number of bubbles counted per individual glass decreased exponentially over 20 minutes, which was similar to the trend observed for mass loss. Expressing the bubble count as a percentage of the number initially present in the glass showed that, after 10 minutes in the glass, cork-closed wines had a tendency on average to higher bubble counts than crown-capped wines (Fig. 6a). This was not sustained and, after 20 minutes, the cork-closed and crown-capped wines had similar bubble counts on average (Fig. 6b). Individually, wines LL12 and LO15 had notably higher bubble counts after 10 and 20 minutes for the cork-closed wine compared to the crown-capped wine after pouring. The remaining wine pairs either showed more bubbles in the crown-capped wine (GB14), or no differences between the two closure types (GB18). A tentative conclusion can therefore be made that the closure type does affect the number of bubbles visible in the glass and, in some instances, a cork closure is more amenable to retaining the appearance of bubbles in a glass of wine for the first ten minutes after pouring.
The CO2 content of a wine or beverage has been proposed to affect the aroma (Liger-Belair et al., 2001; Howe, 2003; Liger-Belair et al., 2009; Saint-Eve et al., 2009). Droplets originating from bursting bubbles at the surface of sparkling wine can release aromatic compounds into the immediate atmosphere in the glass (Liger-Belair et al., 2009). This would have a direct effect on how a judge or consumer perceives the wine. The higher the concentration of dissolved CO2 in the wine, the faster the bubble formation, the larger the bubble size and the more bubbles are released (effervescence) from the wine (Liger-Belair et al., 2009), and therefore the higher the release of more aroma compounds. As described previously, the cork wines in this study tended to have lower pressure and dissolved CO2 than the crown-capped wines (Table 2), which, based on the aforementioned conclusions of Liger-Belair et al. (2009), should lead to slower bubble formation, smaller bubble size and slower release from the cork-closed wine. This is in agreement with the higher number of bubbles counted and the smaller bubble size noted during the sensory analysis. These differences in bubble dynamics could also explain why the cork wines were judged to be different from the crown-capped wines and why they had a longer aftertaste (Fig. 4).
It can further be surmised that, apart from the aforementioned physical effects of the CO2 kinetics, the underlying phenolic dynamics and possible phenolic compound interactions with other wine components (Dufour & Bayonove, 1999; Mazauric & Salmon, 2005) can be factors supporting the observations of MCC producers that a cork closure affects the wine stylistically and has an effect on the CO2 (bubbles and foam). Further investigations to elucidate the more complex compounds, e.g. polymerised phenolic compounds, and molecule complexation with cork compounds will shed more light on the role the cork plays during sparkling wine production.
CONCLUSIONS
Six pairs of wines from five vintages, closed by either a cork or crown cap, were investigated. Infrared spectroscopy was shown to be a powerful and inexpensive tool to illustrate differences between the pairs of cork-crown wines, although the nature of the differences could not be deduced. Contact with the cork results in changes in the wine's phenolic acid profile. Gallic, caftaric, caffeic and p-coumaric acids can be measured and used collectively as marker compounds to differentiate between cork-closed and crown-capped wines. The technique of using corks instead of crown cap closures during bottle fermentation and maturation on lees brings about a sensorial change in the wines. Cork-closed wines have less autolytic character but have a longer aftertaste. An effect on the CO2 kinetics can also occur. The data generated generally show that, after being poured, the cork-closed wines lost CO2 slower than the crown-capped wines, with visually more and smaller bubbles. The bubbles are the 'sparkle' that distinguishes sparkling wines from still wines and are a characteristic that consumers generally find appealing (Howe, 2003). Based on the data generated in this study, anecdotal evidence observed by sparkling wine producers on the effect of cork on foam stability, bubble texture and stylistic changes in MCC wine is tentatively supported. Producers wanting to change their style of wine can therefore use cork as a wine production tool to achieve this. However, further investigations are needed to explain more fully the perceived sensory differences between cork-closed and crown-capped wines.
LITERATURE CITED
Alexi, N., Nanoub, E., Lazoc, O., Guerreroc, L., Grigorakism K. & Byrnea, D.V., 2018. Check-all-that-apply (CATA) with semi-trained assessors: Sensory profiles closer to descriptive analysis or consumer elicited data? Food Qual. Pref. 64, 11-20. [ Links ]
Azevedo, J., Fernandes, I., Lopes, P., Roseira, I., Cabral, M., Mateus, N. & Freita, V., 2014. Migration of phenolic compounds from different cork stoppers to wine model solutions: Antioxidant and biological relevance. Eur. Food Res. Technol. 239, 951-960. [ Links ]
Cap Classique Producers Association. 2021. Methode Champenoise. Available from www.capclassique.co.za (accessed 15 April 2021). [ Links ]
Comité Champagne, 2020. From vine to wine: What is Champagne wine? Effervescence. Available from https://www.champagne.fr/en/from-vine-to-wine/what-is-champagne-wine/effervescence (accessed 30 November 2020). [ Links ]
De Freitas, V., 2019. Revisiting wine polyphenols chemistry in relation to their sensory characteristics. In: Halbwirth, H., Stich, K., Cheynier, V. & Quideau, S. (eds). Recent advances in polyphenol research, vol 6. S. John Wiley & Sons Ltd, Hoboken, NJ. pp 263 - 284. [ Links ]
Di Gaspero, M., Ruzza, P., Hussain, R., Honisch, C., Biondi, B., Siligardi, G., Marangon, M., Curioni, A. & Vincenzi, S., 2020. The secondary structure of a major wine protein is modified upon interaction with polyphenols. Molecules 25, 1646. doi:10.3390/molecules25071646 [ Links ]
Dom Perignon, 2021. Plenitude 2. Retrieved from https://www.domperignon.com/ww-en/champagne/vintage/dom-perignon-p2/2002 (accessed 15 April 2021). [ Links ]
Dufour, C. & Bayonove, C.L., 1999. Interactions between wine polyphenols and aroma substances. An insight at the molecular level. J. Agric. Food Chem. 47, 678-684. [ Links ]
Fernandes, A., Fernandes, I., Cruz, L., Mateus, N., Cabral, M. & De Freitas, V., 2009. Antioxidant and biological properties of bioactive phenolic compounds from Quercus suber L. J. Agric. Food Chem. 57, 11154-11160. [ Links ]
Feuillat, M. & Charpentier, C., 1982. Autolysis of yeasts in Champagne. Am. J. Enol. Vitic. 33, 6-13. [ Links ]
Gabrielli, M., Fracassetti, D. & Tirelli, A., 2016. Release of phenolic compounds from cork stoppers and its effect on protein-haze. Food Control 62, 330-336. [ Links ]
Geissmann, Q., 2013. OpenCFU, a new free and open-source software to count cell colonies and other circular objects. PLoS ONE 8, e54072. https://doi.org/10.1371/journal.pone.0054072 [ Links ]
Hornedo-Ortega, R., González-Centeno, M.R., Chira, K., Jourdes, M. & Teissedre, P.-L., 2020. Phenolic compounds of grapes and wines: Key compounds and implications in sensory perception. In: Winemaking - Stabilization, Aging Chemistry and Biochemistry [Working title]. doi:10.5772/intechopen.93127 [ Links ]
Howe, P., 2003. Sparkling wines. In: Lea A.G.H. & Piggott J.R. (eds). Fermented beverage production. Springer, Boston, MA. pp 139 - 155. [ Links ]
Jaeger, S.R., Beresford, M.K., Paisley, A.G., Antúnez, L., Vidal, L., Cadena, R.S., Giménez, A. & Ares, G., 2015. Check-all-that-apply (CATA) questions for sensory product characterization by consumers: Investigations into the number of terms used in CATA questions. Food Quality Pref. 42, 154-164. [ Links ]
Lawless, H.T. & Heymann, H., 2010 (2nd ed). Sensory evaluation of food. Springer, New York. [ Links ]
Lesschaeve, I.A. & Noble, A.C., 2005. Polyphenols: Factors influencing their sensory properties and their effects on food and beverage preferences. Am. J. Clin. Nutr. 81, 330S-335S. [ Links ]
Liger-Belair, G., Lemaresquier, H., Robillard, B., Duteurtre, B. & Jeandet, P., 2001. The secrets of fizz in Champagne wines: A phenomenological study. Am. J. Enol. Vitic. 52, 88-92. [ Links ]
Liger-Belair, G., Parmentier, M. & Cilindre, C., 2012. More on the losses of dissolved CO2 during Champagne serving: Toward a multiparameter modelling. J. Agric. Food Chem. 60, 11777-11786. dx.doi.org/10.1021/jf303574m [ Links ]
Liger-Belair, G., Villaume, S., Cilindre, C. & Jeandet, P., 2009. Kinetics of CO2 fluxes outgassing from Champagne glasses in tasting conditions: The role of temperature. J. Agric. Food Chem. 57, 1997-2003. [ Links ]
Mazauric, J.-P. & Salmon, J.-M., 2005. Interactions between yeast lees and wine polyphenols during simulation of wine aging: I. Analysis of remnant polyphenolic compounds in the resulting wines. J. Agric. Food Chem. 53, 5647-5653. [ Links ]
Mazzoleni, V., Caldentey, P. & Silva, A., 1998. Phenolic compounds in cork used for production of wine stoppers as affected by storage and boiling of cork slabs. Am. J. Enol. Vitic. 49, 6-10. [ Links ]
Minnaar, P.P., Gerber, P., Booyse, M. & Jolly, N., 2021. Phenolic acids in cork-closed bottle-fermented sparkling wines. S. Afr. J. Enol. Vitic. 42, 1924. [ Links ]
Minnaar, P.P., Jolly, N.P., Paulsen, V., Du Plessis, H.W. & Van Der Rijst, M., 2017. Schizosaccharomyces pombe and Saccharomyces cerevisiae yeasts in sequential fermentations: effect on phenolic acids of fermented Kei-Apple (Dovyalis caffra L.) juice. Int. J. Food Microbiol. 257, 232-237. [ Links ]
Minnaar, P.P., Nyobo, L., Jolly, N., Ntushelo, N. & Meiring, S., 2018. Anthocyanins and polyphenols in Cabernet Franc wines produced with Saccharomyces cerevisiae and Torulaspora delbrueckii yeast strains: Spectrophotometric analysis and effect on selected sensory attributes. Food Chem. 268, 287-291. [ Links ]
Monagas, M., Bartlomé, B. & Gómez-Cordovés, C., 2005. Updated knowledge about the presence of phenolic compounds in wine. Crit. Rev. Food Sci. Nutr. 45, 85-118. doi:10.1080/10408690490911710 [ Links ]
Ott, R.L. & Longnecker, M., 2016 (7th ed). An introduction to statistical methods and data analysis. Belmont, USA: Brooks/Cole, Cengage Learning. [ Links ]
Pinto, J., Oliveira, A.S., Lopes, P., Roseira, I., Cabral, M., De Lourdes-Bastos, M. & Guedes de Pinho, P., 2019. Characterisation of chemical compounds susceptible to be extracted from cork by the wine using GC-MS and 1H NMR metabolomics approaches. Food Chem. 271, 639-649. [ Links ]
Poças, M.F., Ferreira, B., Pereira, J. & Hogg, T., 2010. Measurement of oxygen transmission rate through foamed materials for bottle closures. Packag. Technol. Sci. 23, 27-33. [ Links ]
Romano, P., Fiore, C., McRae, J.M. & Kennedy, J.A., 2011. Wine and grape tannin interactions with salivary proteins and their impact on astringency: A review of current research. Molecules 16, 2348-2350. [ Links ]
Shapiro, S.S. & Wilk, M.B., 1965. An analysis of variance test for normality (complete samples). Biometrika 52, 591-611. [ Links ]
Spence, C. & Wang, Q.J., 2018. What does the term 'complexity' mean in the world of wine? In. J. Gastronomical Food Sci. 14, 45-54. [ Links ]
Saint-Eve, A., Déléris, I., Aubin, E., Semon, E., Feron, G., Rabillier, J.M., Ibarra, D., Guichard, E. & Souchon, I., 2009. Influence of composition (CO2 and sugar) on aroma release and perception of mint-flavored carbonated beverages. J. Agric. Food Chem. 57, 5891-5898. [ Links ]
South African Wine Industry Information and Systems (SAWIS), 2020. Liquor Products Act 60 of 1989. Regulations. Table 2: Classes for wine and specific requirements for classes. Available from www.sawis.co.za/winelaw/southafrica.php (accessed 17 December 2020). [ Links ]
South African Wine Laboratories Association (SAWLA), 2002. Methods of analysis for wine laboratories. Available from https://sawla.org/ [ Links ]
Tao, Y., García, J.F. & Sun, D-W., 2014. Advances in wine aging technologies for enhancing wine quality and accelerating wine aging process. Crit. Rev. Food Sci. Nutr. 54, 817-835. doi:10.1080/10408398.2011.609949 [ Links ]
Varea, S., García-Vallejo, M., Cadahía, E. & de Simón, F.B., 2001. Polyphenols susceptible to migrate from cork stoppers to wine. Eur. Food Res. Technol. 213, 56-61. [ Links ]
Submitted for publication: February 2021
Accepted for publication: July 2021
* Corresponding author: jollyn@arc.agric.za
Acknowledgements: We would like to thank Le Lude Cap Classique, Graham Beck Wines and Anthonij Rupert Wyne, for donating wines, and the Cap Classique Producers Association for initiating this investigation. ARC Infruitec-Nietvoorbij and Winetech are thanked for funding. We thank Mr Pieter Ferreira for assistance, knowledge and technical expertise. Ms Genevieve Peterson and Ms Alicia Coetzee from The House of JC le Roux (Distell) gave us the use of their CarboQC system. Dr Ernesto de Sá Pereira, Dr Jose Machado, Dr Miguel F. A. Ferreira Cabral and Mr Joaquim Sa, Amorim & Irmãos, S.A., Porto, Portugal provided detailed information regarding the production of corks. Prof Gerard Liger-Belair andDr Clara Cilindre, University of Reims, Reims, France shared their expertise and protocols, while Mr Denis Bunner of Champagne Bollinger shared his expertise on Champagne

