


Services on Demand
Article
 English (pdf)
 Article in xml format
 Article references
Indicators

Related links
-
 Cited by Google
 -
 Similars in Google
Share

 Permalink
South African Journal of Enology and Viticulture
On-line version ISSN 2224-7904
Print version ISSN 0253-939X
S. Afr. J. Enol. Vitic. vol.42 n.1 Stellenbosch 2021
http://dx.doi.org/10.21548/42-1-4308
ARTICLES
The Effect of Cluster Position Determined by Vineyard Row Orientation on Grape Flavonoids and Aroma Profiles of Vitis vinifera L. cv. Cabernet Sauvignon and Italian Riesling in the North Foot of Tianshan Mountains
Hao-Cheng LuI, II; Xiao-Tong GaoI, II; Chang-Qing DuanI, II; Shu-De LiIII; Wu ChenIII; Jun WangI, II, *
ICenter for Viticulture and Enology, College of Food Science and Nutritional Engineering, China Agricultural University, Beijing 100083, China
IIKey Laboratory of Viticulture and Enology, Ministry of Agriculture and Rural Affairs, Beijing 100083, China
IIICITIC Guoan Wine Co. Ltd, Manasi 832200, China
ABSTRACT
Vineyard row orientation plays a critical role in determining cluster microclimate. This study aimed to figure out how cluster positions determined by vineyard row orientation affect grape flavonoids and aroma profiles of Cabernet Sauvignon and Italian Riesling grapes. Three cluster positions (two canopy sides and the inner canopy) of NS and EW oriented row Cabernet Sauvignon and NS oriented row Italian Riesling were selected for the experiment. Microclimate data was monitored around clusters from both canopy sides of different row orientations. The south canopy side had higher daytime temperatures and PAR than the north canopy side in EW row orientation. Flavonoids of grape skins and seeds were separated and determined by LC-MS, and aroma compounds of grape must were determined by GC-MS. Results showed that flavanols were affected by orientations, and EW orientation had higher berries skin flavanol concentration than NS orientation. EW-IN berries had fewer glucuronide form flavonols and 3'-hydroxylated flavonols than the other two positions in EW orientation. Inner canopy berries had lower flavonol concentration than other positions in EW orientation of CS and NS orientation of IR. To aromas, C6/C9 were the main compounds significantly affected by row orientations. EW orientation berries had higher C6 alcohols concentration such as (E)-3-Hexen-1-ol, (E)-2-Hexen-1-ol and (Z)-3-Hexen-1-ol than NS orientation, while NS orientation berries had higher C6 aldehyde concentrations such as Hexanal and (E)-2-hexenal than EW orientation. EW-IN berries had more abundant C6/C9 compounds than the other two positions. The study provided preliminary scientific evidence for vineyard viticulture practice and harvest strategy.
Key words: Canopy side, flavor compounds, grapevine, microclimate, solar irradiation, temperature
INTRODUCTION
In general, choosing a proper row orientation is not easy because we need to consider many factors such as radiation, temperature, wind, humidity, and orography. An ill-considered choice of row orientation harms sustainability and consistency in product targets because it is costly to modify once established (Hunter et al., 2016). Vineyard row orientation leads to canopy exposure variations which directly influence sunlight and heating (Pieri & Fermaud, 2005; Evangelia et al., 2018). Many studies have shown that in all row orientations of vineyards, the NS orientation absorbed higher photosynthetically active radiation than others, and the EW orientation had the lowest sunlight interception in canopies (Smart, 1973; Campos et al., 2017; Hunter et al., 2017). Diurnally, NS orientation peaked in the morning and afternoon in sunlight interception, and NE-SW and NW-SE orientations peaked in the afternoon and morning in the southern hemisphere, respectively (Hunter et al., 2017).
Higher sunlight interception is usually accompanied by higher temperature, which makes a different microclimate on different canopy positions. In EW row orientation, south-exposed bunches reached a higher daytime temperature than north-exposed bunches in the northern hemisphere (Pieri et al., 2016). Sunlight and temperature had profound effects on the developmental stage and vine physiology (Chaves et al., 2016). Grape composition including sugars, organic acids, amino acids, flavonoids, and aroma compounds, which are critical to wines, were also sensitive to environmental change (Hashizume & Samuta, 1999; Kentaro et al., 2007; Cohen et al., 2008; Matus et al., 2009; Azuma et al., 2012; Sadras & Moran, 2012; Koyama et al., 2012; Sadras et al.,, 2013; Sweetman et al., 2014; Rienth et al., 2014; Barreiro et al., 2015). Elevated temperature tended to increase pH and decrease titratable acidity in must. Bunches that received higher light levels led to higher flavonols concentration, such as quercetin-3-glucoside (Haselgrove et al., 2008). The response of total anthocyanins to temperature was variable. Relatively high temperature could increase anthocyanin content, while extremely high temperature would inhibit synthesis of anthocyanins (Kentaro et al., 2007; Haselgrove et al., 2008; Tarara et al., 2008; Zorer et al., 2017).
The vegetative and reproductive growth of the grapevine is affected by different row orientations. The EW row orientation vineyards of Chardonnay had lower yield and total dry mass per vine than other orientations (Intrieri et al., 1996). The net photosynthetic rate of leaves on the south side of EW orientation in Switzerland was highest during the whole growing season, as described by Zufferey et al. (1999). Hunter et al. (2016) found that in NS oriented rows, rates of leaf net CO2 assimilation on the west side in the afternoon was 88% of that measured on the east canopy side in the morning, whereas photosynthetic rate on the east side in the afternoon was 74% of that measured on the west side in the morning.
In the semi-arid area of Xinjiang province where heatwaves frequently occur in the grape development stage, thick canopy and shaded microclimate are reasonable to protect grapes from sunburn. However, this also leads to uneven light and temperature distribution in different positions associated with row orientations. In recent years when global warming profoundly impacted the wine industry (Parra et al., 2010), it has been shown that NS row orientation was not proper to all vineyards. The influence of sunlight and temperature on the physicochemical and aromatic composition of the berries should be taken into account to make the best choice of the vineyard orientation. In this study, NS and EW row orientation were used to investigate the temperature and PAR variations on both canopy sides. Berries from two sides were sampled to determine phenolic and aroma compounds. Besides, we also collected shaded berries inside the canopy that most researchers had ignored. Our purpose is to investigate the variations in primary and secondary metabolites extracted from different positioned bunches in the canopy.
MATERIALS AND METHODS
Experimental site, microclimate, and grape sampling
The north-south (NS, 44°29'N-86°23E, elevation 468 m) and east-west (EW, 44°13'N-86°14'E, elevation 542 m) row orientation commercial vineyards are both located in Manas county, the northern foot of Tianshan Mountains, Xinjiang province where the soil is "silt loam". Own-rooted vines of Cabernet Sauvignon and Italian Riesling in NS row orientation vineyard were planted in 2008, and own-rooted vines of Cabernet Sauvignon in EW row orientation vineyard were planted in 2011. Vines spacing was 2.9 m χ 1 m. All experimental vines were trained to a modified vertical shoot-positioned spur-pruned cordon system (M-VSP) (Cheng et al., 2014) which retained 15-18 nodes per linear meter of row. Vines were furrow irrigated with 750 m3ha-1 water at budburst, blossom, pea-size, pre-veraison, pre-harvest (approximately three weeks before harvest), respectively. Nutrition and pest management was carried out according to local industry standards. The experiment was carried out in 2017, which was a normal vintage in Xinjiang.
The meteorological data, including average monthly temperature and sunshine duration in the whole growing season (Apr. to Sept.) from 2009 to 2019 of experimental sites, was obtained from China Meteorological Data Service Centre (http://cdc.cma.gov.cn/). Micro-weather stations (Hobo® micro station, Onset corporation, USA) were set up around the cluster on both sides of the canopy. Temperature and photosynthetically active radiation (PAR) were recorded every 5 min on a sunny day during post-veraison and pre-harvest.
NS row orientation of CS and IR were oriented northeast-southwest 25°. EW row orientation of CS was oriented northeast-southwest 85°. Grapes were collected from two sides and inner canopy of each orientation as three treatments. Three replicates of each treatment were arranged in a randomized block design. There were 20 vines with similar growth vigor for each replicate. Six hundred berries of each replicate were randomly collected from different positions of clusters at harvest. After sampling, 100 berries were randomly selected to measure physiochemical parameters, and the remaining berries were frozen immediately in liquid nitrogen and stored at -80°C for subsequent phenolics and aroma compounds analysis.
Analysis of berry physiochemical composition
One hundred berries were weighed and manually pressed. After centrifuging, the must was determined for total soluble solids, titratable acidity and pH value. TSS was measured using a PAL-1 digital hand-held refractometer (Atago, Tokyo, Japan). The pH value was measured using a Mettler LE438 pH meter (Mettler, Toledo, Switzerland). Titratable acidity was analyzed by titration with NaOH (0.05 M) to the endpoint of pH 8.2 and expressed as tartaric acid equivalents in accordance with the National Standard of People's Republic of China (GB/T15038-2006, 2006).
Extraction of phenolics compounds
Berry skins were manually peeled off and grounded to powder in frozen status, then were dried at -40 °C under vacuum. The dried skin powder was used to extract anthocyanins, flavonols, and flavan-3-ols. Dried seed powder was used to extract flavan-3-ols.
Flavonols and anthocyanins were extracted following the procedure reported by Downey et al. (2007) and He et al. (2010). Dried skin powder (0.100 g) was macerated and sonicated in 50% (v/v) methanol in water (1.0 mL) for 20 min. The extraction was then conducted with centrifugation for 10 min at 12,000 rpm. The supernatant was collected and the residue was extracted twice. Flavan-3-ol was extracted according to Liang et al. (2012). To determine the content of various flavan-3-ol units, grape sample powder (0.10 g) was mixed with 1 mL of phloroglucinol buffer (0.5% ascorbate, 300 mmol/L HCl and 50 g/L phloroglucinol in methanol), incubated at 50 °C for 20 min, neutralized with 1 mL sodium acetate (200 mmol/L, pH 7.5) and finally centrifuged at 8000 rpm for 15 min. This procedure was repeated three times and the supernatants were combined. For the preparation of free flavan-3-ol monomers, 0.1 g of the dried sample powder was extracted into 1 mL of 70% acetone with 0.5% ascorbate, mixed, and centrifuged and repeated twice. Then 400 μL of the pooled supernatants were dried rapidly with a dry nitrogen stream at 30 °C. The dried samples were dissolved in 200 μL acidified methanol with 1% (v/v) HCl and then neutralized with 200 μL aqueous sodium acetate (200 mM).
LC-MS analysis of phenolics compounds
Anthocyanins and flavonols were analyzed on an Agilent 1100 series LC-MSD trap VL equipp ed with a diode array detector and a Kromasil C18 column (250 χ 4.6 mm, 5 μm) (Agilent Technologies, Santa Clara, CA, USA) utilizing a binary solvent gradient, where mobile phase A was 2% formic acid in water and B was 2% formic acid in acetonitrile. The detailed LC procedures and MS conditions have been described previously (He et al., 2010). The flavan-3-ols were tested using the Agilent 1200 Series LC-MSD trap VL equipped with a 6410 Triple Quadrupole Mass Spectrometer (QqQ). The column used was an Agilent Poroshell 120 EC-C18 column (150 χ 3.0 mm, 2.7 μm). The detailed LC procedures and MS conditions have been described previously (Li et al, 2016). Flavonols and anthocyanins were quantified using quercetin-3-O-glucoside and malvidin-3-O-glucoside as external standards, respectively. The content of flavan-3-ols was quantified using catechin (C), epicatechin (EC), epigallocatechin (EGC), and epicatechin-3-O-galate (ECG) as external standards.
Extraction of aroma compounds
Free and bound volatile compounds were extracted according to the method of Lan et al. (2016). For each replicate, 80 g de-seeded berries were grounded with 1 g polyvinylpolypyrrolidone and 0.5 g D-gluconic acid lactone in liquid nitrogen, then were macerated at 4 °C for 4 h and centrifuged to get clear must. 5 mL grape must was added in a 20 mL vial with 1 g NaCl and 10 μL 4-methyl-2-pentanol (internal standard). Bound volatile compounds were isolated using Cleanert PEP-SPE resins and enzymatic hydrolysis of glycosidic precursors was conducted at 40 °C for 16 h by adding 100 μL AR 2000 (Rapidase, 100 g/L). Samples were placed in a CTC-Combi PAL autosampler (CTC Analytics, Zwingen, Switzerland) equipped with a 2 cm DVB/CAR/ PDMS 50/30 μm SPME fiber (Supelco, Bellefonete, PA., USA) and agitated at 500 rpm for 30 min at 40 °C. The SPME fiber was then inserted into the headspace to absorb aroma compounds at 40 °C for 30 min and was instantly desorbed into the GC injector to desorb aroma compounds.
GC-MS analysis of aroma compounds
Aroma compounds were analyzed using Agilent 6890 GC equipped with Agilent 5973C MS and fitted with an HP-INNOWAX capillary column (60 m χ 0.25 mm, 0.25 μm, J & W Scientific, Folsom, CA, USA). Oven temperature began with 50 °C for 1 min, then increased to 220 °C at a rate of 3 °C/min and held at 220 °C for 5 min. The temperature of the ion source and quadrupole was set at 250 °C and 150 °C, respectively. Helium was the carrier gas at 1 mL/min and the GC inlet was set in the splitless mode. The full scan mode was employed to collect electron ionization mass data from m/z 30-350. The ionization voltage was set at 70 eV Aroma compounds were identified based on mass spectra matching in the standard NIST08 library and retention indices in the literature. The quantification procedure was based on a previous report (Wu et al., 2009).
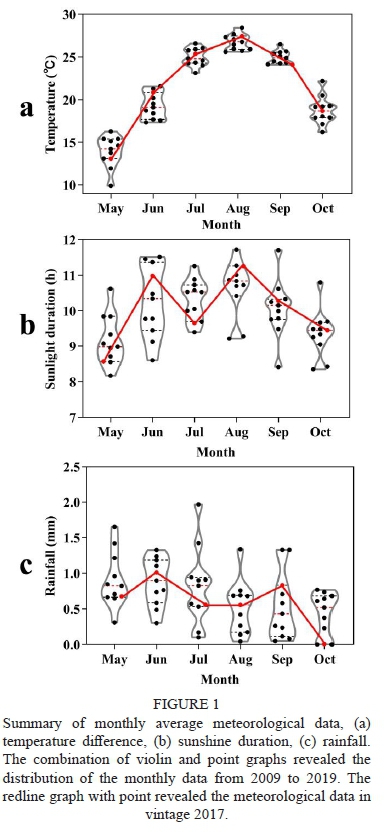
Summary of monthly average meteorological data, (a) temperature difference, (b) sunshine duration, (c) rainfall. The combination of violin and point graphs revealed the distribution of the monthly data from 2009 to 2019. The redline graph with point revealed the meteorological data in vintage 2017.
Statistical analysis
The SPSS version 22.0 was used for all significance analysis at p < 0.05 (Duncan's multiple range test or t-test). The figures were drawn using the Origin 8.0 software and GraphPad Prism 8.0.2. OPLS-DA was carried out using SIMCA 14.1.
RESULTS
Meteorological and microclimate data
The vintage 2017 was a typical vintage when the experiment was carried out, as shown in Figure 1. The monthly average temperature and sunshine duration changes were almost within the range of the last 11 years. The total growing degree days in the 2017 growing season was 2159.7 °C, and the average growing degree days from 2009 to 2019 was 2103.5 °C. The total sunshine duration in the 2017 growing season was 1823.4 h, which was quite close to the average growing season sunshine duration from 2009 to 2019 (1823.9 h). So, vintage 2017 could represent the normal climate in Manas country.
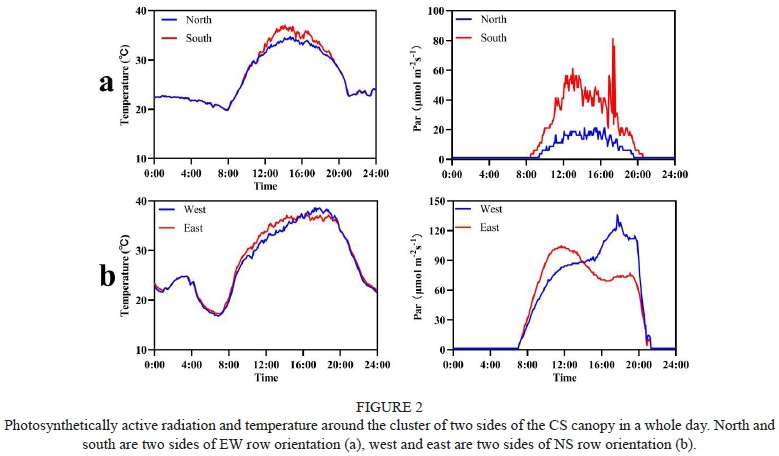
The microclimate varied in both EW and NS row orientations (Figure 2). In terms of PAR, the south canopy side was higher than the north side in EW row orientation, indicating that clusters in the south canopy side were exposed more in sunlight than the north canopy side. In NS row orientation, both canopy sides presented two trends due to the sun movement. At about 15:00, the sun reached directly above, and both canopy sides were alike in PAR. Although different at the same moment, the whole day's accumulated PAR on two canopy sides showed no much difference in NS row orientation. The trend of temperature was similar to PAR. From 12:00 to 20:00, the south canopy side in EW row orientation was hotter than the north canopy side. Especially at about 15h, the south canopy side's temperature could reach about 38 °C, while the north canopy side was always lower than 35 °C. So, the south canopy side exposed more time in a heatwave than the north canopy side. In NS row orientation, both two canopy sides suffered the same high-temperature stress in the afternoon. The difference in PAR intensity between the two orientation rows was noticeable. In EW orientation, the average PAR intensity from 8:00 to 20:00 in the north and south sides was 10.7 μmol m-2s-1 and 30.7 μmol m-2s-1, respectively. However, in NS orientation, the average PAR intensity from 8:00 to 20:00 in the west and east sides was 88.5 μmol m-2s-1 and 79.9 μmol m-2s-1, respectively.
Effect of row orientation on grape physiochemical composition
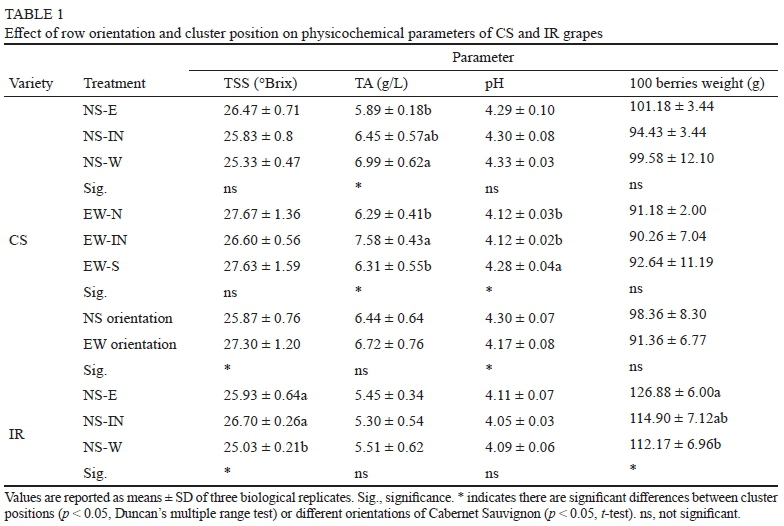
Berries weight and TSS were not affected significantly in NS or EW oriented rows in Cabernet Sauvignon vines, as shown in Table 1. In NS row orientation, berries on the west canopy side had higher TA than the east, while pH was not affected significantly. In EW row orientation, IN berries had higher TA than other sides, and the south canopy sides had higher pH. Considering the row canopy, NS orientation berries had lower TSS and higher pH than EW orientation. In Italian Riesling, west canopy side grape of NS row orientation had a lower TSS while east canopy side had a higher 100 berries weight. TA and pH were not affected by canopy sides.
Effect of row orientation on grape phenolics composition
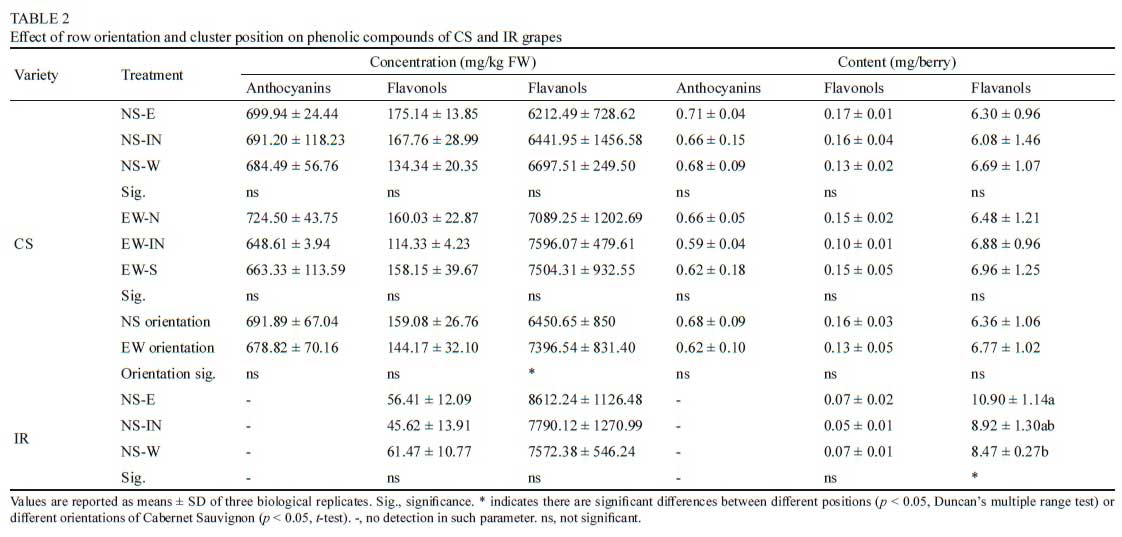
There are minor differences in total concentrations of anthocyanins, flavonols, and flavanols in different row orientations, whether in per kg fresh weight or per berry, as shown in Table 2. There were more flavanols per berry in the east canopy side of NS row orientation in IR than other positions. EW orientation berries had higher flavanol concentration than NS orientation berries of CS.
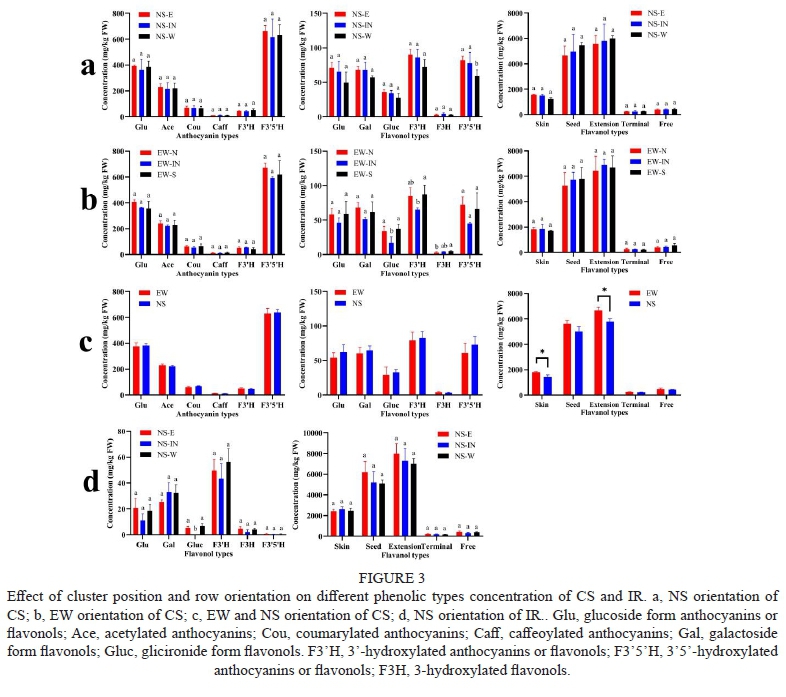
According to structures, all the anthocyanins, flavonols, and flavanols were sorted into different types, as shown in Figure 3. Orientations and positions did not affect different types of anthocyanins in CS grapes. In the NS orientation of CS, NS-W had lower 3'5'-hydroxylated flavonols. There were fewer glucuronide form flavonols (Gluc) and 3'-hydroxylated flavonols (F3'H) in EW-IN than the other two positions in the EW orientation. Compared to EW and NS orientation of CS, there was no significant difference in anthocyanin and flavonol types between the two orientations. EW orientation berries had higher concentrations of skin flavanols than NS orientation. The extension form flavanols were also higher in EW orientation. There were little 3'5'-hydroxylated flavonols (F3'5'H) in IR grapes, as shown in Figure 3d, which was in agreement with a previous study that the enzyme flavonoid 3'5'-hydroxylase is not expressed in white grape varieties (Mattivi et al., 2006). The glucuronide form flavonols were not detected in NS-IN of IR grapes.
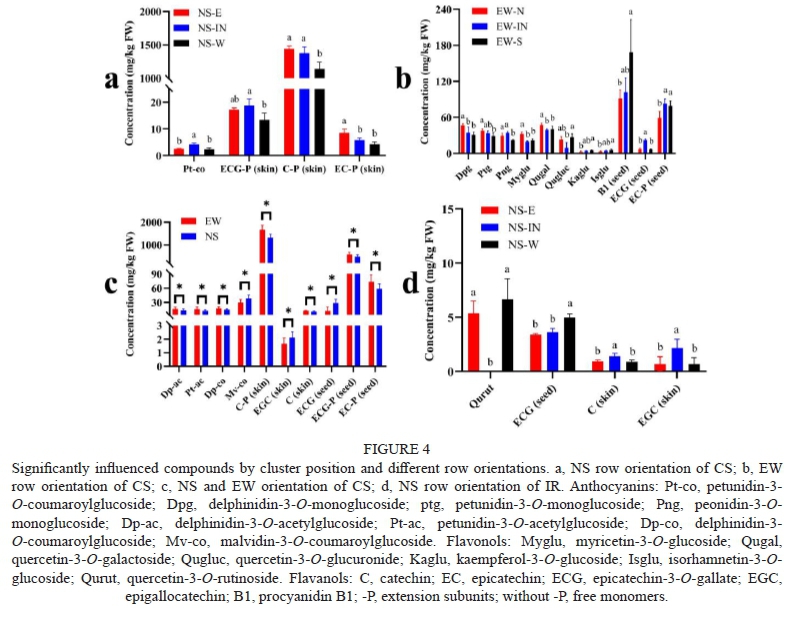
The significantly influenced compounds in every row orientation were shown in Figure 4. Whether in NS row orientation of CS or IR, both four significantly influenced compounds included three flavanols compounds. In CS, the west canopy side had lower concentrations of the three flavanols than other canopy sides. However, in IR, there was a higher concentration of ECG on the west canopy side. There were more significantly different compounds among three position in EW orientation than NS orientation of CS, including three anthocyanins, five flavonols, and three flavanols. EW-S had lower concentrations of three anthocyanins than the other two positions. It might be due to high temperature has a negative effect on anthocyanins as well known (Sadras & Petrie, 2011; Yamane et al., 2006), because the south canopy side suffered higher temperature stress than other canopy sides as shown before. In terms of flavonols, EW-IN had lower concentrations of myricetin-3-O-glucoside, quercetin-3-O-galactoside, and quercetin-3-O-glucuronide, which might be to the shaded microclimate around clusters inside the canopy because flavonols were positively related to sunlight and protected berries from UV damage (Price et al., 1995). The same trend occurred to IR, where NS-IN had lower berries concentration of quercetin-3-O-rutinoside. Compared to EW and NS orientation, anthocyanins and flavanols were most influenced by different orientations. EW orientation had higher concentrations of C-P in the skin and ECG-P in the seed than NS orientation, leading to increased total flavonols concentration.
Effect of row orientation on grape aroma profiles
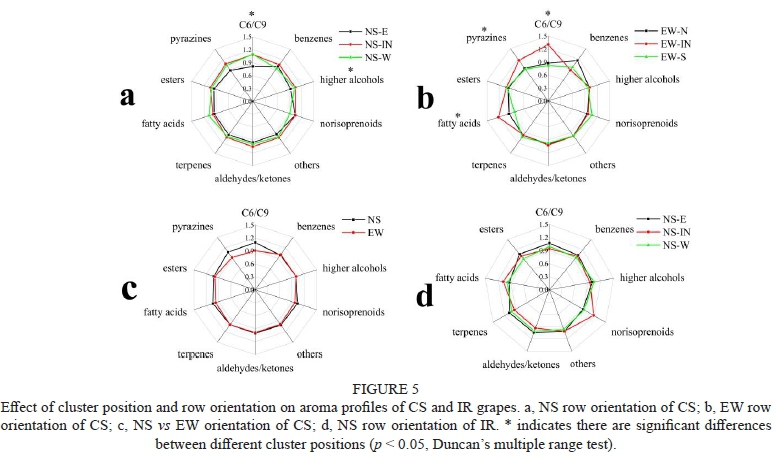
According to structures, volatile compounds identified by GC-MS were sorted into 10 categories in CS and 9 categories in IR, as shown in Figure 5. There were 2 categories influenced by different positions in NS row orientation and 3 categories influenced by different positions in EW row orientation of CS. Little variations occurred in NS vs EW or different positions of IR. C6/C9 compounds and pyrazines mainly contributed "green leaf aroma" to red wine, which was generally considered immature impressions to tasters (Matsui, 2006; Parr et al., 2007). In CS, EW-IN was more abundant in berries C6/C9 compounds than the other two positions, and NS-E had lower concentrations than NS-IN and NS-W. Concerning pyrazines, EW-IN had more concentrations of berries pyrazines than other positions in EW row orientation, which was in agreement with C6/C9 compounds. However, there was no significant difference between different positions in NS row orientation of CS, although NS-W and NS-IN had more concentrations of berries pyrazines, which was in agreement with C6/C9 compounds, too.
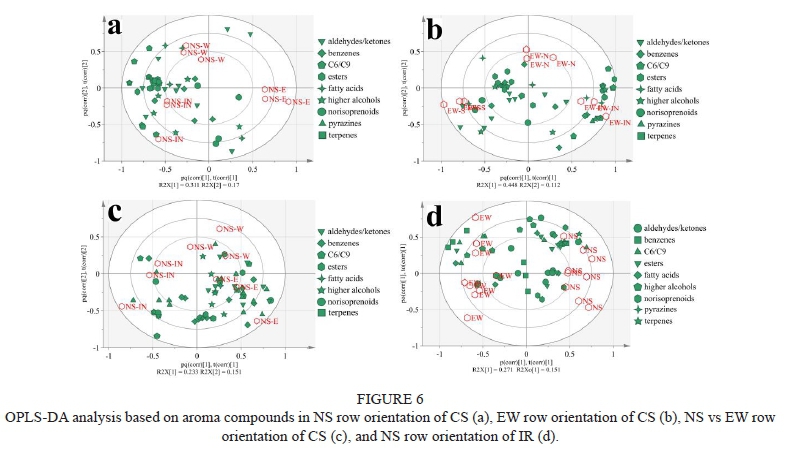
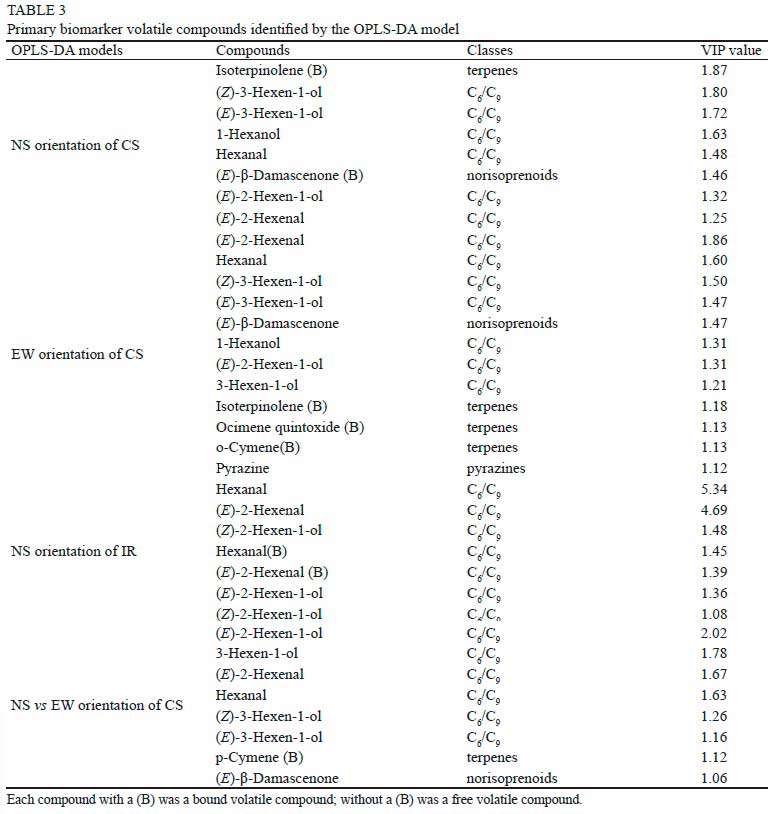
The OPLS-DA analysis was used to identify variations between different positions of different row orientations based on berries volatile compounds, as shown in Figure 6. In the NS row orientation of CS (Figure 6a), two predictive components explained 48.1% of the total variation. R2X[1], which discriminated NS-E to the other two positions, accounted for 31.1% (R2X[1] = 0.311) of the total variance. It showed that NS-E had less aroma profiles than other positions. R2X[2], which discriminated NS-W to the other two positions, accounted for 17% (R2X[2] = 0.17) of the total variance. In EW row orientation of CS (Figure 6b), two predictive components explained 56.0% of the total variation. The main compounds that separated EW-IN from EW-S included a few esters, C6/C9 compounds, and aldehydes/ketones. In NS row orientation of IR (Figure 6c), NS-E had more abundant aromas than the other two positions. Compared to EW and NS orientation of CS (Figure 6d), the OPLS-DA model could separate the two orientations. A few benzenes, C6/C9 compounds, fatty acids, and higher alcohols contributed to the variation. The primary biomarker volatile compounds identified by the OPLS-DA model was shown in Table 3. We focused on C6/C9 compounds, terpenes, pyrazines, and norisoprenoids mainly contributed to the "variety aroma" of wines. Results showed that C6/C9 compounds occupied the largest proportion of all the biomarkers.
Furthermore, Duncan's multiple range test was used to identify if there was a significant difference between different positions of every row orientation with respect to biomarker volatile compounds. The results showed that C6/C9 compounds were the most significantly influenced compounds. The main affected C6/C9 compounds were shown in Figure 7. In the NS row orientation of CS (Figure 7a), NS-E significantly reduced Hexanal and 1-Hexanol concentrations compared to other positions. NS-IN showed high concentrations of all biomarkers and significantly improved (E)-3-Hexen-1-ol and (Z)-3-Hexen-1-ol. In the EW row orientation of CS (Figure 7b), EW-IN berries also had higher concentrations of all the listed C6/C9 compounds than other positions. EW-S significantly reduced berry concentrations of (£)-3-Hexen-1-ol and (Z)-3-Hexen-1-ol than other positions. However, in the NS row orientation of IR (Figure 7c), the differences did not reach a significant level among the three positions. Comparison between EW and NS row orientations of CS (Figure 7d) showed that EW berries had higher C6 alcohols concentration such as (E)-3-Hexen-1-ol, (E)-2-Hexen-1-ol and (Z)-3-Hexen-1-ol, while NS orientation berries had higher C6 aldehydes concentration such as Hexanal and (E)-2-Hexenal.
DISCUSSION
In this study, we observed a relatively balanced distribution of light and temperature on each canopy side in the NS row orientation compared to EW, which was in agreement with the previous study of Pieri et al. (2016). Besides, NS row orientation intercepted more sunlight than EW row orientation, which usually led to higher net assimilation rate, as shown in this study, and stronger vine vigor (Hunter et al., 2017). Physicochemical composition was not greatly influenced and titratable acid seemed more sensitive to different cluster positions in this study. Bergqvist et al. (2001) found that north side clusters of Cabernet Sauvignon showed lower soluble solids than those on the south side of the canopy. But there was no difference between the two canopy sides in the NS and EW row orientation of Shiraz grape (Hunter & Volschenk, 2018). Shaded clusters usually had a negative influence on TSS accumulation (Bergqvist et al., 2001). However, in this study, only EW-IN of CS had lower TSS in berries than other positions and was not significant. The composition of berries would change slowly in the late harvest and the difference of berries TSS might be narrowed as time went on. In this study, all the treatments reached at least 25°Brix, which was a high TSS level and late harvest phenology.
There were minor differences in different positions and orientations concerning total phenolics concentration including anthocyanins, flavonols and flavanols in this study. There were fewer concentrations of berry flavonols in EW-IN of CS and NS-IN of IR, which were in a shaded position. The decrease of flavonols usually accompanied by a shaded canopy because the main function of flavonols had been proved to be a UV filter, through absorbing light in the 280-330 nm range to protect plant tissue from UV damage (Price et al., 1995). Most of the phenolic compounds were not affected by the NS row orientation of CS and IR. While in EW row orientation, 23.4% of all phenolic compounds were significantly influenced by different positions, which indicated a more imbalanced distribution associated with different positions than NS row orientation.
Variations of exposure to sunlight in different cluster positions made a difference in C6/C9 biosynthesis in this study. C6/C9 compounds, or GLVs (green leaf volatiles), formed through the hydroperoxide lyase pathway of oxylipin metabolism (Matsui, 2006), were sensitive to microclimate change. NS-IN and EW-IN of CS showed more concentration of (Z)-3-Hexen-1-ol, which was in agreement with a previous study where a shaded microclimate could improve concentrations of hexanal, (E)-2-Hexenal and (Z)-3-Hexen-1-ol in Grillo grape (Scafidi et al., 2013). Similar to phenolic compounds, more C6/C9 compounds were significantly influenced in different cluster positions of EW row orientation compared to NS row orientation. Different cluster positions would make a difference in vegetable aroma, which influences wine aroma.
CONCLUSION
Different row orientations made an imbalanced distribution in light and temperature, especially in EW row orientation, resulting in metabolites variations of different positions of grapes. There were minor differences in physicochemical indicators affected by different cluster positions and titratable acidity was sensitive to different cluster positions in NS and EW row orientation of CS. We showed more differential compounds in EW row orientation than NS row orientation for individual phenolics compounds of berries. C6/C9 compounds were affected by different canopy side, and EW row orientation had more variation in C6/C9 compounds than NS row orientation. Although EW orientation was a potential choice for climate change in the future, the quality variations in different positions of the grapes in the canopy should be considered in this row orientation. Besides, clusters inside the canopy tend to have higher C6/C9 and lower flavonol concentration. Viticulture strategies should be applied to decrease cluster numbers inside the canopy, such as reduce the inside canopy buds in the winter pruning.
LITERATURE CITED
Azuma, A., Yakushiji, H., Koshita, Y. & Kobayashi, S., 2012. Flavonoid biosynthesis-related genes in grape skin are differentially regulated by temperature and light conditions. Planta. 236, 1067-1080. DOI:10.1007/s00425-012-1650-x. [ Links ]
Barreiro, C.G., Otero, R.R., Grande, B.C. & Gándara, J.S., 2015. Wine aroma compounds in grapes: A critical review. Crit Rev Food Sci Nutr. 55, 202-218. DOI:10.1080/10408398.2011.650336. [ Links ]
Bergqvist, J., Dokoozlian, N. & Ebisuda, N., 2001. Sunlight exposure and temperature effects on berry growth and composition of Cabernet Sauvignon and Grenache in the Central San Joaquin Valley of California. Am J Enol Vitic. 52, 1-7. [ Links ]
Campos, I., Neale, C.M.U. & Calera, A., 2017. Is row orientation a determinant factor for radiation interception in row vineyards? Aust J Grape Wine Res. 23, 77-86. DOI:10.1111/ajgw.12246. [ Links ]
Chaves, M.M., Costa, J.M., Zarrouk, O., Pinheiro, C., Lopes, C.M. & Pereira, J.S., 2016. Controlling stomatal aperture in semi-arid regions - The dilemma of saving water or being cool? Plant Sci. 251, 54-64. DOI:10.1016/j.plantsci.2016.06.015. [ Links ]
Cheng, G., He, Y.N., Yue, T.X., Wang, J. & Zhang, Z.W., 2014. Effects of climatic conditions and soil properties on Cabernet Sauvignon berry growth and anthocyanin profiles. Molecules. 19, 13683-13703. Doi:10.3390/molecules190913683. [ Links ]
Cohen, S.D., Tarara, J.M. & Kennedy, J.A., 2008. Assessing the impact of temperature on grape phenolic metabolism. Anal Chim Acta. 621, 57-67. DOI:10.1016/j.aca.2007.11.029. [ Links ]
Downey, M.O., Mazza, M. & Krstic, M.P., 2007. Development of a stable extract for anthocyanins and flavonols from grape skin. Am J Enol Vitic. 58, 358-364. [ Links ]
Evangelia, C., Serafeim, T., Konstantinos, B., Stamatina, K., Yorgos, K. & Stefanos, K., 2018. Row orientation and defoliation effects on grape composition of Vitis vinifera L. Agiorgitiko in Nemea (Greece). E3S Web of Conferences. 50, 1039. DOI:10.1051/e3sconf/20185001039. [ Links ]
GB/T 15038-2006, 2006. Analytical methods of wine and fruit wine. National Standard of People's Republic of China. [ Links ]
Haselgrove, L., Botting, D., VanHeeswijck, R., Hoj, P.B., Dry, P.R., Ford, C. & Iland, P.G., 2008. Canopy microclimate and berry composition: the effect of bunch exposure on the phenolic composition of Vitis vinifera L. cv. Shiraz grape berries. Aust J Grape Wine Res. 6,141-149. DOI:10.1111/j.1755-0238.2000.tb00173.x. [ Links ]
Hashizume, K. & Samuta, T., 1999. Grape maturity and light exposure affect berry methoxypyrazine concentration. Am J Enol Vitic. 50, 194-198. [ Links ]
He, J.J., Liu, Y.X., Pan, Q.H., Cui, X.Y. & Duan, C.Q., 2010. Different anthocyanin profiles of the skin and the pulp of Yan73 (Muscat Hamburg χ Alicante Bouschet) grape berries. Molecules. 15, 1141-1153. DOI:10.3390/molecules15031141. [ Links ]
Hunter, J.J. & Volschenk, C.G., 2018. Chemical composition and sensory properties of non-wooded and wooded shiraz (Vitis vinifera L.) wine as affected by vineyard row orientation and grape ripeness level. J Sci Food Agric. 98, 2689-2704. DOI:10.1002/jsfa.8763. [ Links ]
Hunter, J.J., Volschenk, C.G. & Booyse, M., 2017. Vineyard row orientation and grape ripeness level effects on vegetative and reproductive growth characteristics of Vitis vinifera L. cv. Shiraz/101-14 Mgt. Eur J Agron. 84, 47-57. DOI:10.1016/j.eja.2016.12.004. [ Links ]
Hunter, J.J., Volschenk, C.G. & Zorer, R., 2016. Vineyard row orientation of Vitis vinifera L. cv. Shiraz/101-14 Mgt: Climatic profiles and vine physiological status. Agric For Meteorol. 228, 104-119. DOI:10.1016/j.agrformet.2016.06.013. [ Links ]
Intrieri, C., Silvestroni, O., Rebucci, B., Poni, S. & Filippetti, I., 1996. The effects of row orientation on growth, yield, quality and dry matter partitioning in Chardonnay vines trained to simple curtain and spur-pruned cordon. In: Proc. 4th Int. Symp. Cool Clim. Vitic. Enol. 10-15. [ Links ]
Kentaro, M., Nami, G.Y., Masahiko, K. & Hashizume, K., 2007. Loss of anthocyanins in red-wine grape under high temperature. J Exp Bot. 58, 1935-1945. DOI:10.1093/jxb/erm055. [ Links ]
Koyama, K., Ikeda, H., Poudel, P.R. & Goto-Yamamoto, N., 2012. Light quality affects flavonoid biosynthesis in young berries of Cabernet Sauvignon grape. Phytochemistry. 78, 54-64. DOI:10.1016/j.phytochem.2012.02.026. [ Links ]
Lan, Y.B., Qian, X., Yang, Z.J., Xiang, X.F., Yang, W.X., Liu, T., Zhu, B.Q., Pan, Q.H. & Duan, C.Q., 2016. Striking changes in volatile profiles at sub-zero temperatures during over-ripening of 'Beibinghong' grapes in Northeastern China. Food Chem. 212, 172-182. DOI:10.1016/j.foodchem.2016.05.143. [ Links ]
Li, S.Y., He, F., Zhu, B.Q., Wang, J. & Duan, C.Q., 2016. Comparison of phenolic and chromatic characteristics of dry red wines made from native Chinese grape species and Vitis vinifera. Int. J. Food Prop. 20, 2134-2146. DOI:10.1080/10942912.2016.1233117. [ Links ]
Liang, N.N., He, F., Pan, Q.H., Wang, J., Reeves, M.J. & Duan, C.Q., 2012. Optimization of sample preparation and phloroglucinol analysis of Marselan grape skin proanthocyanidins using HPLC-DAD-ESI-MS/MS. S Afr J Enol Vitic. 33, 122-131. [ Links ]
Mattivi, F., Guzzon, R., Vrhovsek, U., Stefanini, M. & Velasco, R., 2006. Metabolite profiling of grape: Flavonols and anthocyanins. J Agric Food Chem. 54, 7692-7702. DOI: 10.1021/jf061538c. [ Links ]
Matsui, K., 2006. Green leaf volatiles: hydroperoxide lyase pathway of oxylipin metabolism. Curr Opin Plant Biol. 9, 274-280. DOI:10.1016/j.pbi.2006.03.002. [ Links ]
Matus, J.T., Loyola, R., Vega, A., Pena-Neira, A., Bordeu, E., Arce-Johnson, P. & Alcalde, J.A., 2009. Post-veraison sunlight exposure induces MYB-mediated transcriptional regulation of anthocyanin and flavonol synthesis in berry skins of Vitis vinifera. J Exp Bot. 60, 853-867. DOI:10.1093/jxb/ern336. [ Links ]
Parr, W.V., Green, J.A., White, K.G. & Sherlock, R.R., 2007. The distinctive flavour of New Zealand Sauvignon blanc: Sensory characterisation by wine professionals. Food Qual Prefer. 18, 849-861. DOI:10.1016/j.foodqual.2007.02.001. [ Links ]
Parra, C.S., Aguirreolea, J., Manuel, S.D., Juan, J.I. & Fermín, M., 2010. Effects of climate change scenarios on Tempranillo grapevine (Vitis vinifera L.) ripening: response to a combination of elevated CO2 and temperature, and moderate drought. Plant Soil. 337, 179-191. DOI:10.2307/24131018. [ Links ]
Pieri, P. & Fermaud, M., 2005. Effects of defoliation on temperature and wetness of grapevine berries. Acta Hortic. 689, 109-116. DOI:10.17660/ActaHortic.2005.689.9. [ Links ]
Pieri, P., Zott, K., Eric, G. & Hilbert, G., 2016. Nested effects of berry half, berry and bunch microclimate on biochemical composition in grape. OENO One. 50, 145-159. DOI:10.20870/oeno-one.2016.50.3.52. [ Links ]
Price, S.F., Breen, P.J., Valladao, M. & Watson, B. T., 1995. Cluster sun exposure and quercetin in Pinot noir grapes and wine. Am J Enol Vitic. 46, 187-194. [ Links ]
Rienth, M., Torregrosa, L., Luchaire, N., Chatbanyong, R., Lecourieux, D., Kelly, M.T. & Romieu, C., 2014. Day and night heat stress trigger different transcriptomic responses in green and ripening grapevine (Vitis vinifera) fruit. BMC Plant Biol. 14, 108. DOI:10.1186/1471-2229-14-108. [ Links ]
Sadras, V.O. & Petrie, P.R., 2011. Predicting the time course of grape ripening. Aust J Grape Wine Res. 18, 48-56. DOI:10.1111/j.1755-0238.2011.00169.x. [ Links ]
Sadras, V.O. & Moran, M.A., 2012. Elevated temperature decouples anthocyanins and sugars in berries of Shiraz and Cabernet Franc. Aust J Grape Wine Res. 18, 115-122. DOI:10.1111/j.1755-0238.2012.00180.x. [ Links ]
Sadras, V.O., Petrie, P.R. & Moran, M.A., 2013. Effects of elevated temperature in grapevine. II juice pH, titratable acidity and wine sensory atributes. Aust J Grape Wine Res. 19, 107-115. DOI:10.1111/ajgw.12001. [ Links ]
Scafidi, P., Pisciotta, A., Patti, D., Tamborra, P., Lorenzo, R.D. & Barbagallo, M.G., 2013. Effect of artificial shading on the tannin accumulation and aromatic composition of the Grillo cultivar (Vitis vinifera L.). BMC Plant Biol. 13, 175. DOI:10.1186/1471-2229-13-175. [ Links ]
Smart, R.E., 1973. Sunlight interception by vineyards. Am J Enol Vitic. 24, 141-147. [ Links ]
Sweetman, C., Sadras, V.O., Hancock, R.D., Soole, K.L. & Ford, C.M., 2014. Metabolic effects of elevated temperature on organic acid degradation in ripening Vitis vinifera fruit. J Exp Bot. 65, 5975-5988. DOI:10.1093/jxb/eru343. [ Links ]
Tarara, J.M., Lee, J., Spayd, S.E. & Scagel, C.F., 2008. Berry temperature and solar radiation alter acylation, proportion, and concentration of anthocyanin in Merlot grapes. Am J Enol Vitic. 59, 236-246. [ Links ]
Wu, Y.W., Pan, Q.H., Qu, W, J. & Duan, C.Q., 2009. Comparison of volatile profiles of nine litchi (Litchi chinensis Sonn.) cultivars from Southern China. J Agr Food Chem. 57, 9676-9681. DOI:10.1021/jf902144c. [ Links ]
Yamane, T., Jeong, S.T., Goto-Yamamoto, N., Koshita, Y. & Kobayashi, S., 2006. Effects of temperature on anthocyanin biosynthesis in grape berry skins. Am J Enol Vitic. 57, 54-59. [ Links ]
Zorer, R., Volschenk, C.G. & Hunter, J.J., 2017. Integrating geographic information systems and hemispherical photography in the assessment of canopy light profiles in a vineyard. Agric For Meteorol. 232, 672-681. DOI:10.1016/j.agrformet.2016.09.011. [ Links ]
Zufferey, V., Murisier, F., Aerny, J. & Gindroz, V., 1999. Bilans journaliers de CO2 chezla vigne (cv. Chasselas) avec des rangs orientes Nord-Sud et Est-Ouest. Revue Suisse Vitic. Arboric Hortic. 31, 247-252. [ Links ]
Submitted for publication: September 2020
Accepted for publication: March 2021
* Corresponding author: Jun Wang: jun_wang@cau.edu.cn
Acknowledgements: The authors are grateful to CITIC Guoan Wine Co. Ltd. for field experiment and technical assistance. This research was funded by China Agriculture Research System (CARS-29) and the Project of Integration of Winemaking Techniques and Product Development for Featured Chateau in Xinjiang Province (2017A01001-3)

