


Services on Demand
Article
 English (pdf)
 Article in xml format
 Article references
Indicators

Related links
-
 Cited by Google
 -
 Similars in Google
Share

 Permalink
South African Journal of Enology and Viticulture
On-line version ISSN 2224-7904
Print version ISSN 0253-939X
S. Afr. J. Enol. Vitic. vol.42 n.1 Stellenbosch 2021
http://dx.doi.org/10.21548/42-1-4238
ARTICLES
Metal Concentrations in Grape Spirits
T. N. van Wyk; F. van Jaarsveld; O. J. Caleb
Post-Harvest and Agro-Processing Technologies (PHATs), Agricultural Research Council (ARC), Infruitec-Nietvoorbij, Helshoogte Road, Stellenbosch 7599, South Africa
ABSTRACT
Metals are a necessity for human health as they play significant roles in biological systems. However, contamination of food and beverages by heavy metals such as lead (Pb), iron (Fe), chromium (Cr), cadmium (Cd), copper (Cu), cobalt (Co), Nickel (Ni) and zinc (Zn) is a major public health problem in developing countries. In this study we evaluated the levels of Li, Be, B, Al, V, Cr, Mn, Fe, Co, Ni, Cu, Zn, As, Se, Sr, Mo, Cd, Sb, Ba, Hg and Pb in grape spirits, including pot still spirit, neutral wine spirit and commercial brandies. Interesting variations in the levels of metals was observed. Factors such as origin and type of spirits influenced levels of metals in spirits. These differences in some metal levels such as copper can be used to determine possible adulteration and in authenticity assessments of brandies. Surprisingly the commercial brandies had higher metal concentrations when compared to pot still spirit and neutral wine spirit. Unmatured pot still spirit had the highest copper levels. Our study shows that generally the metal levels in most of the commercial brandies were within permissible limits.
Key words: Metals, commercial brandy, neutral wine spirit, pot still spirit, authentication
INTRODUCTION
Metals play significant roles in biological systems (Hamada, 2016; Maret, 2016). Additionally, knowledge of metal levels is crucial for evaluating human exposure to toxic elements (Iwegbue et al., 2014). The non-essential metals, such as cadmium and lead, are toxic and harmful to humans, even when consumed at very low concentrations. An excessive intake of metals is associated with oxidative damage, chronic inflammatory diseases, initiation of cancer and premature aging (Hajeb et al., 2014; Feri et al., 2015).
Grape spirit is produced by batch distillation in small pot stills or by continuous distillation in column-still distills (Tsakiris et al., 2016). Although wine contains different metals, these metals are not volatile and, therefore, are not found in the distillates. Distillates acquire their metallic content, including aluminum and cadmium, by contact with different metals. Copper plays a role as a catalyzer in certain chemical reactions and in complexing unpleasant molecules (Vogiatitzis et al., 2019). During distillation, copper has been reported to improve the quality of the distillates by combining with other compounds such as butyric, caproic, caprylic, capric, long chain fatty acid and lauric acids resulting in the formation of precipitates, hence. Caprylic, caproic, and lauric fatty acids odor resembles that of cheese. Most of the copper found in wines originates from copper sulfate based disinfectant sprays used to treat vines for mildew. As far as distillation is concerned, the presence of copper is connected with higher-quality distillates. Accordingly, distillation in stainless steel distillers results in poorer-quality brandies, the quality which can be improved by the addition of exogenous copper or copper sulfate (Tsakiris et al., 2016).
The concentration of metals in beverages depends on the quality of the water, the raw materials and the processing techniques (Iwegbue et al., 2014; Esteki et al., 2018). There is dearth of information currently available on the metal profiles of liquor beverages available in South Africa, as well as the dietary intakes and lifelong health effects of these metals in humans from the consumption of these products. The objective of the present study was to determine the concentrations of 21 metals in some alcoholic beverages, with a view to providing information on the metal profiles and benefits associated with the consumption of these products.
Fraud and adulteration detection also known as food authentication is a process, which verifies the food compliance with its label description including the geographical origin, production method, processing technologies and food composition (Walker, 2017). Food and beverage fraud represents a threat to human health, as prohibited additives may be toxic or contaminated with pathogens, or non-declared substitutes and production processes can cause health problems such as allergic reactions (Gerbig et al., 2017). The increase of food adulteration has been a challenge for producers, researchers, governments and consumers (Esteki et al., 2018). In this study, metallomics was used to verify the nature of spirits and brandy. Alcoholic beverage adulteration, especially the varietal and geographical origin identification of wines as a widely distributed product, has been extensively investigated (Stanziani, 2009; Esteki et al., 2018). Moreover, the applicability of metal levels in brandy authenticity application still remains largely debatable.
In addition, the daily intake of the metals based on a shot (10 ml) and per capita consumption of 3.6 L per year pure alcohol of the tolerable daily intake of each metal was estimated. Moreover, the use of copper and other metals as indicators for the authentication of spirits was evaluated.
MATERIALS AND METHODS
A total of 101 spirit samples were analyzed in the study comprising of 35 commercial brandy samples, 31 pot still spirit (PSB) and 35 neutral wine spirit (NWS) samples. Samples were collected from various South African producers, and represent vintages in 2001 to 2003. Samples are inclusive of all variations caused by grape cultivar, geographic location, still design and vintage, and compiled over seven years from 01/04/2000 to 31/03/2006.
Sample preparation
Samples were diluted between 10 and 24x - depending on the alcohol content - in order to have a similar volatile content of the samples throughout the analysis.
Trace element analysis
Trace elements were analyzed on an Agilent 7900 quadrupole ICP-MS. Samples were introduced via a 0.4 ml/ min micromist nebulizer into a peltier-cooled spraychamber at a temperature of 2°C. The instrument was optimized for sensitivity, with oxide formation less than 0.3%. Replicate measurements with appropriate dwell times were done on each analyte and all elements were measured in He-collision mode. An internal standard (ISTD) solution containing Sc, Y, Ge, Rh and In was introduced online to monitor instrument drift and correct for matrix differences between samples and standards. Appropriate internal standards were matched to analytes according to their proximity in mass and ionization potential while the instrument was calibrated using NIST traceable standards from Inorganic Ventures to quantify selected elements. During the course of the analysis, ISTD recovery was between 90 and 110% for all samples, and recovery for drift monitor standards between 95 and 105%.
Statistical analysis
SPSS 19.0® for Windows was used for the statistical analysis and P<0.05 was considered significant. Univariate analyses of variance (ANOVA) was performed to ascertain which of the metal levels were significantly different between the spirits analyzed while post hoc test was used to determine whether the differences between the individual means is significant. Results are expressed as arithmetic mean and standard deviation. Kolmogorov-Smirnov and Bartlett's tests were used to check for the normal distribution of variables and the homogeneity of variances, respectively. Linear regression analyses among all the 21 mineral concentrations were also made. The Codex food standard, which is a joint Food and Agricultural Organization (FAO)/World Health Organization (WHO)/ Codex Alimentarius Commission (CAC) standard (2011), was used for comparison of the daily intake of the heavy metals. Permissible metal limit levels in liquor and wine products as stipulated by OIV standards (www.oiv.int) were also used in the study.
RESULTS AND DISCUSSION
The presence of metals in foods and beverages reflects environmental conditions (Rai et al., 2019), except for accidental or criminal actions (Iwegbue et al., 2014). Although calcium, potassium, copper, zinc, cobalt, iron, magnesium and manganese are essential metals, excessive intake might cause disease, be carcinogenic, have adverse reproductive effects, and unfavorably impact nutrition. Also, excessive intake of some essential metals might displace other biologically useful metals such as calcium and zinc. In this study, the concentrations of metals in spirits were determined in order to check compliance with the established regulatory control limits, determine regional metal profiles and in addition evaluate the nutritional status of the beverage.
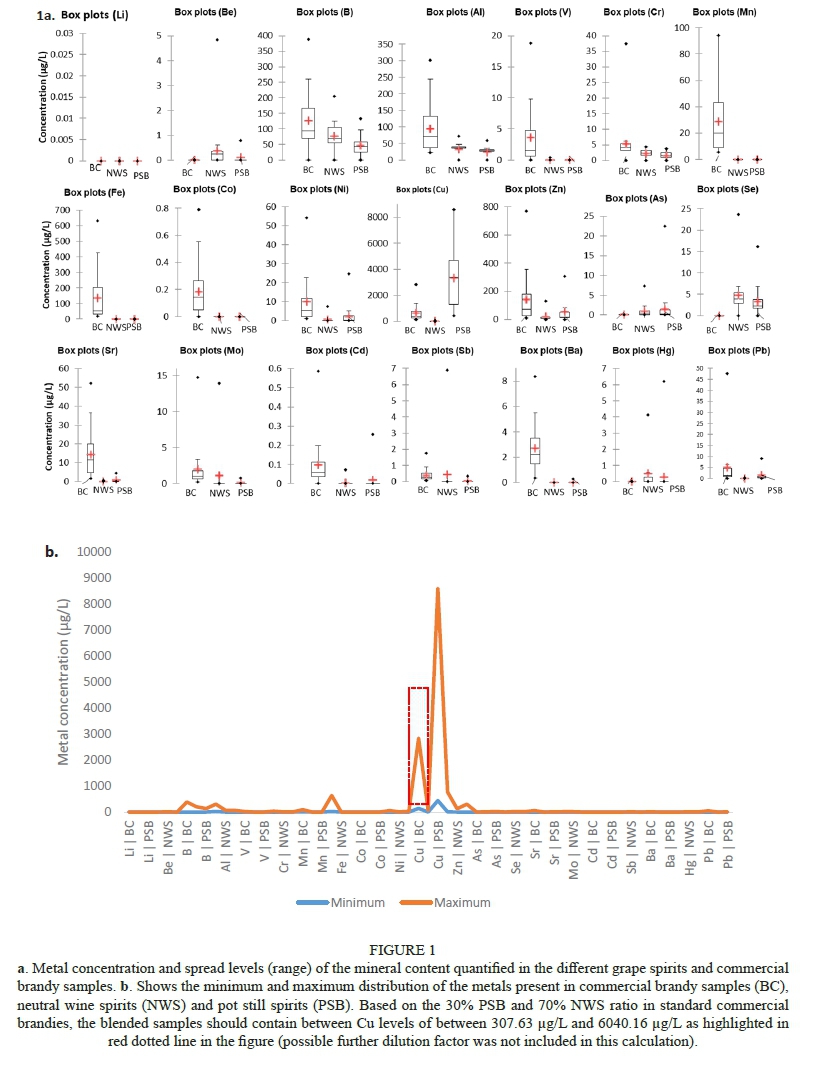
Commercial brandies (BC) differed significantly from pot still spirit (PSB) and neutral wine spirit (NWS) in most metal concentrations, where BC had significantly higher levels (p < 0.05) as seen in Fig. 1a. Standard commercial brandies are a blend of 30% PSB and 70% NWS and therefore this result is different from what is expected. However, BC contain aged spirit components (mostly so in the case of PSB), whereas the NWS and PSB metal levels reflected in the results are unaged. Therefore, the process of ageing in wooden vats/casks could have extracted more metals into the spirits, and ultimately the commercial brandies would have higher metal concentrations. B, Al, V, Cr, Mn, Fe, Co, Ni, Zn, Sr, Mo, Cd, Ba and Pb were indeed significantly higher (p < 0.05) than the NWS and PSB (table 1 and Fig. 1a).
In addition, Cu differed significantly (p < 0.05) for all the three spirits PSB, NWS and BC. The maximum concentrations for copper in the BC, NWS and PSB spirits were 2842.189, 70.756 and 8598.480 μg/L respectively. PSB had the highest levels (as expected due to copper pot stills), while lowest levels were observed for NWS (which is expected since column stills are not made from copper). BC samples had Cu levels falling between PSB and NWS (which was also expected since the commercial brandies are produced by blending of PSB and NWS).
The recommended limit for Cu in alcoholic drinks has been set by OIV to be between 1 000 and 5 000 μg/L. Acute copper toxicosis has been reported to affect the gastrointestinal systems (GI), hepatic, renal, hematological, cardiovascular, and central nervous system (CNS). In this study, PSB had higher copper levels than the permissible limits. Navarro et al. (2007) observed 8010 ± 1580 μg/L Cu levels in brandy sampled in a study carried out in Spain. An increase in the Cu levels of the resulting distilled brandies would be expected due to the distillation process used in their manufacturing (Navarro et al., 2007). Iwegbue et al. (2014) observed concentrations of Cu in the liquor samples to range from 0.01 to 0.77 μg/mL less than the levels obtained in this study. Copper concentrations in the range of 1.64-4.40 μg/mΙ. were reported for Brazilian cachaga and other international spirits (Nascimento et al., 1999). In Spain, Cu concentrations ranging from 0.10 to 8.01 μg/mL for whisky, gin, rum, liquor and brandy were reported (Navarro et al., 2007). A Food Informatics (2005) study reported up to 0.7 μg/mL copper levels in gin, rum, brandy and whisky in Denmark while Miranda et al. (2010) reported Cu content in sugar cane spirits to vary from 6 600 to 6 640 μg/L.
The distilled beverages industry is expanding indicated by the constant release of new products. On the other hand, counterfeiters as well as cases of adulteration and dilution of distilled spirits and liqueurs are also on the increase.
Therefore it would be of great advantage to find an easy way to test distilled spirits for authentication. From Fig. 1a and 1b, it is clear that there is a definite difference between PSB, and NWS that can be explored for brandy authentication. The copper levels (4 569 μg/L) calculated for brandy resulting from possibly blending the minimum and maximum possible blending ratio of 30% PSB and 70% NWS is highlighted in dotted red in Fig. 1b. The maximum calculated copper levels for the blended commercial samples are 4656.90 μg/L. A study by Adam et al. (2002) showed no characteristic metal fingerprint for the different geographical regions in Scotch whiskies. However, the same study observed that the copper concentration could be used as a criterion to distinguish between Blended or Grain Scotch from Malt Whisky where the Malt Whiskies had a copper concentration ranging between 390 and 480 μg/L (95% confidence limit) while the copper concentration of the blended whiskies was between 0.14 and 0.24 μg/L. Alcoholic beverages like Brandy, Cognac and Whisky also come into contact with copper during their distillation. These products' high popularity every so often causes a potential risk for adulteration. In light of the fact that the authenticity assessment is one of the key elements of food or beverage product marketing, the study proposes the use of copper and other metals as indicators for the authenticity of spirits. A large number of samples however, need to be collected for the results to be more conclusive. In addition, no dilution factor was included in the calculations as it may vary depending on cellar preferences and the alcohol levels of the produced blend.
No lithium and minute quantities of beryllium were detected in the analyzed spirits. Low levels of most metals were observed in the spirits analyzed. This could be due to that in a still the volatilization process favors the transfer of alcohol and other aromatic and low molecular weight compounds. On the other hand, the heavier metals remain behind through the condensation coils (Navarro et al., 2007). Therefore the final Li, Be, B, Al, V, Cr, Mn, Fe, Co, Ni, Cu, Zn, As, Se, Sr, Mo, Cd, Sb, Ba, Hg and Pb concentrations present would be significantly lower in distilled products. Equally, the transfer from the grape (Cabanis 2003; Navarro et al., 2007) is largely conserved for fermentation products, such as brandy base and distilling wine.
The concentrations of the iron content in the analyzed spirits ranged between 19.167-632.361 μg/L in commercial samples and iron was surprisingly not detected in the PSB and NWS. Although there is no recommended standard for iron in spirits, iron poisoning can have serious consequences including multi-organ failure and death. The average daily intake of iron in man between ages 20-34 years is estimated to be 17 000 μg per day and for females 9 - 12 000 μg/day (Salako et al., 2016) while the limit for wines is 10 000 μg/L for wine (OIV). The concentration of iron in the BC samples was below the limit. Iwegbue et al. (2014) observed slightly higher levels of iron in the spirits, which varied from 0.28 to 1.48 μg/mL, similar to studies conducted by Iwegbue, (2010), and Woldemariam and Chandravanshi, (2011) in alcoholic beverages. Camean et al. (2001) reported higher Fe levels ranging from 'not detected' to 2.03 μg/mL in Spanish brandy while Okareh et al. (2018) observed Fe levels of 720-4 220 μg/L in liquor products commonly consumed in Nigeria.
The lead concentration in the spirits was below the standard limit set by OIV in liquor products of 200 μg/L. The levels ranged from 0 - 47.673, 0 - 0.377 and 0 - 9.016 μg/L for the BC, NWS and PSB, respectively. Lead plays no biological role in living organisms; however, there is no function in the human body that is not affected by lead toxicity (Wani et al., 2015). The results obtained for alcoholic drinks is related to the levels of lead in Brazilian cachaga and other international spirits, reported to be in the range of 0.035-0.25 μg/mL (Nascimento et al., 1999; Barbeira et al., 1997). Iwegbue et al. (2014) observed mean Pb levels of 0.02 to 0.24 μg/mL in the alcoholic beverages, while in 2001, Pb concentrations of 0.008-0.313 μg/mL were observed in Spanish brandy by Camean et al. (2001). Okareh et al. (2018) detected 2 130-4 700 μg/L of lead in commonly consumed alcoholic beverages flavored with herbal extract in Nigeria, which exceeded the World Health Organization (WHO) limits of 20 μg/L in water.
Although cobalt has a biologically necessary role as metal constituent of vitamin B12, excessive exposure has been shown to induce neurological such as hearing and visual impairment, cardiovascular and endocrine deficits (Leyssens et al., 2017). Cobalt concentrations in the spirits evaluated in the study varied from 'not detected' to 0.790 μg/L in BC while no Co was detected in PSB and NWS. Iwegbue et al. (2014) observed Co levels ranging from 0 - 0.12 μg/mL and similar Co levels have been reported in other alcoholic beverages (Alvarez et al., 2007; Amidzi et al., 2011; Woldemariam and Chandravanshi, 2011; Okareh et al. (2018)). Permissible limits of 50 μg/L and 1500 μg/L (higher levels can be related with health problems) have been reported in literature for Co levels (Oladeji and Saeed, 2015).
The cadmium concentrations in the spirits ranged between 0 - 0.588, 0- 0.072 and 0 - 0.256 μg/L in BC, NWS and PSB respectively. Studies have reported that cadmium exposure maybe linked to various types of cancer, including breast, lung, prostate, nasopharynx, pancreas, and kidney cancers (Genchi et al., 2020). The observed cadmium levels were however in conformance with standard limit of OIV of 15 or 10 μg/L in the case of wine. The result obtained for the non-alcoholic drinks were totally in conformance with the standard maximum limit (0.055 ppm). The incidences of cadmium contaminations are mostly from industrial activity, air readily taken up by plants, water used for irrigation, smoking and or the presence of cadmium in fertilizers (Liao et al., 2019). Our study findings indicate Cd levels lower than those of a study obtained by Iwegbue et al. (2014) who observed mean concentrations of 0.01 to 0.04 μg/mL while Okareh et al. (2018) observed Cd levels ranging from 60 to 70 μg/L in distilled alcoholic beverages and liquors in Nigeria.
Nickel levels ranged from 0.917 - 54.063, 0 - 7.349 and 0 - 24.501 μg/L in BC, NWS and PSB respectively. About 18% of the analyzed commercial spirits are not in compliance with the maximum standard limit of Nickel put at 0.02 ppm (20 μg/L) (Iwegbue et al., 2014; WHO, 2003). The major use of Nickel is in the preparation of alloys because of its strength, ductility and resistance to corrosion and heat. Nickel is an essential metal, however high uptake of the metal can accumulate in the kidneys, bones, and thyroid glands and cause toxicity and result in lung embolism, lung cancer, sickness and dizziness (Das et al., 2008). Iwegbue et al. (2014) observed the mean concentrations of Ni in alcoholic drinks to range between 0.04 and 0.13 μg/mL.
No Manganese was detected in PSB and NWS while concentrations ranging from 5.435-94.161 μg/L were detected in BC commercial samples, lower than the permissible level in drinking water (0.4 μg/mL, WHO, 2003). The levels observed in this study were lower than those detected by other studies. Iwegbue et al. (2014) observed the highest mean level of 0.33 μg/mL in aperitifs liquor. The concentrations of Mn in the alcoholic beverages were also lower than those measured in wines and other international spirits (Nascimento et al., 1999; Sauvage et al., 2002; Pohl, 2007; Amidzi Klari et al., 2011; Woldemariam and Chandravanshi, 2011).
There was no Arsenic in the BC samples while in the NWS and PSB, the levels ranged from 0-7.303 and 0-22.498 μg/L, respectively. The maximum limits by World Health Organization for arsenic in alcoholic beverages are 200 μg/L hence the spirits analyzed in the study are in conformance. Arsenic is usually found in the environment combined with other elements as inorganic (e.g. arsenic trioxide) and organic forms such as arsenates or arsenites usually found in water, soil, or food (Silva et al., 2005). High arsenic concentrations in whisky have been reported to be more than 100 μg/L and some illicitly produced whisky containing more than 400 μg/L has also been reported. The source of arsenic contamination is usually water (Salako et al., 2016). A positive correlation between Cu and As in wines has been reported to indicate the origin of both elements in inorganic pesticides employed in viticulture (Kment et al., 2005).
However, no direct correlation was observed in this study between Cu and As.
The concentrations of zinc obtained indicate low presence of the metal in the spirits far below the maximum limit of 5 000 μg/L in alcoholic drinks (OIV). The concentrations of zinc ranged between 7.638-770.797, 0-128.788 and 0-305.388 μg/L in BC, NWS and PSB, respectively. The observation concurs with other studies in other countries that found only a trace or very low Zn concentrations in alcoholic beverages (Nascimento et al., 1999; Navarro et al., 2007; Iwebgue et al., 2014; Okareh et al., 2018).
Chromium concentration ranged from 0-37.504, 0-4.365, 0-3.739 μg/L in BC, NWS and PSB, respectively and the levels falls below the maximum limit of 50 μg/L, set by WHO (2003). The use of chromium as alloy in the preparation of cans and electroplating process might contribute to the status of their presence in the spirits. Chromium at low concentration is important for functions such as catabolism of fats and carbohydrates. Similar levels have been observed in other alcoholic beverages (Frías et al., 2001; Sauvage et al., 2002; Pohl, 2007; Amidzi Klari et al., 2011; Woldemariam and Chandravanshi, 2011; Iwegbue et al., 2014). The higher levels observed in BC compared to NWS and PSB could be due to contamination during storage by stainless steel or by chromium oxides used for pigmentation of bottles.
In addition to spirit differences, regional differences were also observed in the study with reference to metal concentrations in the analyzed spirits as shown in Fig. 2 where the Coastal region spirits had the highest Cr, Zn, Sr Cu, Al, B and Se concentrations. The use of organic pesticides on the grapes results in a significant enhancement in mineral content in the produced wine (Salvo et al., 2003; Navarro et al., 2007), which could explain the observed regional differences in the studied grape spirts. Adam et al. (2002), using Cluster analysis showed no characteristic metal fingerprints for the different geographical regions for trace element analyses conducted on 35 Scotch Whiskies.
CONCLUSION
The grape spirits metal composition in South African is still unknown. This study therefore shed some light on the concentrations of 21 metals in South African grape wine spirits. Interesting variations in the levels of metals was observed where most of the analyzed metals were present in higher levels in BC than the PSB and NWS. Our study shows that the metal levels in the commercial brandies were within allowed limits. Pot still spirit, before the minimum maturation of 3 years and dilution to the minimum ABV of 38%, had the highest copper levels. Some port still spirits exceeded the permissible limit in alcoholic liquors. However, future studies should evaluate the levels of Cu in pot still brandies (after maturation and dilution) with a view to provide information on the copper profiles and possible toxicity as a result of dietary intake. Factors such as origin, type of spirits and manufacturing processes contributed to the levels of metals in spirits. The enormous differences in copper concentrations between PSB and NWS can be used to estimate Cu levels in the final brandy and in authenticity assessments provided a large number of samples are analyzed to build a database. The obtained metal level data is very useful for compiling food composition tables, thus adding to the existing data for these elements in the South African spirits.
LITERATURE CITED
Aylott, R. I., MacKenzie, W. M. (2010). Analytical strategies to confirm the generic authenticity of Scotch whisky. J. Inst. Brew. 116, 215-229. [ Links ]
Adam, T., Duthie, E., Feldmann, J. (2002). Investigations into the use of copper and other metals as indicators for the authenticity of Scotch whiskies. J. Inst. Brew. 108, 459-464. [ Links ]
AHPA: American Herbal Products Association, (2009). Heavy Metals: Analysis and Limits in Herbal Dietary Supplements. AHPA: Silver Spring, MD. [ Links ]
Álvarez, M., Moreno, I. M., Jos, A., Cameán, A. M., and Gonzalez, A. G. (2007). Differentiation of two Andalusian DO 'fino' wines according to their metal content from ICP-OES by using supervised pattern recognition methods. Microchem. J. 8, 72-76. [ Links ]
Amidzi Klari, D., Klari, I., Veli, D., Vedrina Dragojevi, I. (2011). Evaluation of mineral and heavy metal contents in Croatian blackberry wines. Czech J. Food Sci. 29, 260-267. [ Links ]
Azenha, M. A. G. O., Vasconcelos, T. S. (2000). Assessment of the Pb and Cu in vitro availability in wines by means of speciation procedures. Food Chem. Toxicol. 38, 899-912. [ Links ]
Esteki, M., Simal-Gandara, J., Shahsavari, Z., Zandbaaf, S., Dashtaki, E., van Vander Heyden, Y. (2018). A review on the application of chromatographic methods, coupled to chemometrics, for food authentication (Chromatography-chemometrics in food authentication). Food Control. 93, 165-182. [ Links ]
Barbeira, P. J. S., Stradiotto, N. R. (1997). Simultaneous determination of trace amounts of zinc, lead and copper in rum by anodic stripping voltammetry. Talanta. 44, 185-188. [ Links ]
Cabanis, J. C., Cabanis, M. T., Cheynier, V., Teissedre, P. T. (2003). Tablas de composición. In: Flanzy C, editor. Enología: Fundamentos Científicos y Tecnológicos, 2a edn. Madrid: AMV ediciones, Mundi-Prensa. [ Links ]
Camean, A. M., Moreno, I., Lopez-Artiguez, M., Repetto, M., Gonzalez, A. G. (2001). Differentiation of Spanish brandies according to their metal contents. Talanta. 54, 53-59. [ Links ]
Codex Alimentarius. General Requirements for Natural Flavourings (CAC/ GL 29.1987). Available online: www.codexalimentarius.net (accessed on 12 November 2018). [ Links ]
CODEX. (2011) Working Document for Information and Use in Discussions Related to Contaminants and Toxins in the GSCTFF; Codex Alimentarius Commission: Rome, Italy (pp. 13-15). [ Links ]
Das, K. K., Das, S. N., Dhundasi, S. A. (2008). Nickel, its adverse health effects & oxidative stress. Indian J. Med. Res. 128, 412-425. [ Links ]
Hamada, Y. Z. (2016). Metal Ions Role in Biological Systems. Electron. J. Biol. S2, 1-1. [ Links ]
Han, J., Shang, Q., Du, Y. (2009). Review: effect of environmental cadmium pollution on human health. Health. 1, 159-166. [ Links ]
Esteki, M., Simal-Gandara, J., Shahsavari, Z., Zandbaaf, S., Dashtaki, E., van Vander Heyden, Y. (2018). A review on the application of chromatographic methods, coupled to chemometrics, for food authentication (Chromatography-chemometrics in food authentication). Food Control. 93, 165-182. [ Links ]
González-Arjona, D., González-Gallero, V., Pablos, F., González, A. G. (1999). Authentication and differentiation of Irish whiskys by higheralcohol congener analysis. Anal. Chim. Acta. 381, 257-264. [ Links ]
Ibanez, J., Carreón, A., Barcena-Soto, M., Casillas, N. (2008). Metals in alcoholic beverages: A review of sources, effects, concentrations, removal, speciation, and analysis. J. Food Compos. Anal. 21. 672-683. [ Links ]
Iwegbue, C. M. A. (2010) Composition and daily intakes of some trace metals from canned beers in Nigeria. J. Inst. Brew. 116, 312-315. [ Links ]
Iwegbue, C. M. A, Overah, L. C., Bassey, F. I., Martincigh, B. S., 2014. Trace metal concentrations in distilled alcoholic beverages and liquors in Nigeria. J. Inst. Brew. 120, 521-528. [ Links ]
Genchi, G., Sinicropi, M. S., Lauria, G., Carocci, A., Catalano, A. (2020). The effects of cadmium toxicity. Int. J. Environ. Res. Public Health. 17(11), 3782. [ Links ]
Gerbig, S., Neese, S., Penner, A., Spengler, B., Schulz, S. (2017). Real-Time food authentication using a miniature mass spectrometer. Anal. Chem. 89, 10717-10725. [ Links ]
Gremaud, G., Quaile, S., Piantini, U., Pfammatter, E., Corvi, C. (2004). Characterization of Swiss vineyards using isotopic data in combination with trace elements and classical parameters. Eur. Food Res. Technol. 219, 97-104. [ Links ]
Kment, P., Mihaljevi, M., Ettler, V., Sebek, O., Strnad, L., and Rohlová, L. (2005). Differentiation of Czech wines using multielement composition - A comparison with vineyard soil. Food Chem. 91, 157-165. [ Links ]
Food Informatics (2005). Department of Nutrition, Danish Institute for Food and Veterinary Research. [ Links ]
Frías, S., Pérez Trujillo, J. P., Pena, E. M., Conde, J. E. (2001). Classification and differentiation of bottled sweet wines of Canary Islands (Spain) by their metallic content. Eur. Food Res. Technol. 213, 145-149. [ Links ]
Heller, M., Vitali, L., Oliveira, M. A. L., Costa, A. C. O., Micke, G. A. (2011). A rapid sample screening method for authenticity control of whisky using capillary electrophoresis with online preconcentration. J. Agric. Food Chem. 59, 6882-6888. [ Links ]
Leyssens, L., Vinck, B., Van Der Straeten, C., Wuyts, F., Maes, L. (2017). Cobalt toxicity in humans-A review of the potential sources and systemic health effects. Toxicology. 387, 43-56. [ Links ]
Liao, Z., Chen, Y., Ma, J., Md. Islam, S, Weng L., Li, Y. (2019). The effects of long-term fertilization on Cd, Cu, and Zn accumulation in greenhouse soils from the Shouguang District, Shandong Province, China. Int. J. Environ. Res. Public Health. 16 (15) DOI: 10.3390/ijerph16152805. [ Links ]
MacKenzie, W. M., Aylott, R. I., (2004). Analytical strategies to confirm Scotch whisky authenticity. Part II: Mobile brand authentication. Analyst. 129, 607-612. [ Links ]
Maret, W. (2016). The Metals in the Biological Periodic System of the Elements: Concepts and Conjectures. Int. J. Mol. Sci. 17, 66. [ Links ]
Miranda, K., Dionísio, A. G. G., Pereira-Filho, E. R. (2010). Copper determination in sugar cane spirits by fast sequential flame atomic absorption spectrometry using internal standardization. Microchem. J. 96, 99-101. [ Links ]
Navarro, M., Velasco, C., Jodral, A., Terrés, C., Olalla, M., Lopez H., Lopez M. C. (2007). Copper, zinc, calcium and magnesium contents in alcoholic beverages and by products from Spain: nutritional supply. Food Addit. Contam. 24, 685-694. [ Links ]
Nascimento, R. F., Bezerra, C. W. B., Furuya, S. M. B., Schultz, M. S., Polastro, L. R., Lima Neto, B. S., Franco, D. W. (1999). Mineral profile of Brazilian cachagas and other international spirits. J. Food Compos. Anal. 12, 17-25. [ Links ]
Okareh, O. T., Oyelakin, T. M., Ariyo, O. (2018). Phytochemical properties and heavy metal contents of commonly consumed alcoholic beverages flavoured with herbal extract in Nigeria. Beverages. 4, 60. [ Links ]
Oladeji, S. O., Saeed, M. D. (2015) Assessment of cobalt levels in wastewater, soil and vegetable samples grown along Kubanni stream channels in Zaria, Kaduna State, Nigeria. Afr. J. Environ. Sci. Technol. 9, 765-772. [ Links ]
Onionwa, P. C., Adeyemo, A. O., Idowu, O. E., Ogabiela, E. E. (2001). Copper and zinc contents of Nigerian foods and estimates of the adult dietary intakes. Food Chem. 72, 89-95. [ Links ]
Olivieri, C., Agay, B., Badry, P., Bellenque-Sanzzedde, L., Boudou, F., Capello, F., Chambon, H., Sabate, B. (2003). Preparación y acondicionamiento de los vinos. In: Flanzy C, editor. Enología: Fundamentos Científicos y Tecnológicos, 2a edn. Madrid: AMV ediciones, Mundi-Prensa. [ Links ]
Puech, J. L., Leante, R., Moseale, J. R., Mourgeues, J. (2003). Barrica y envejecimiento de los aguardientes. In: Flanzy C, editor. Enología: Fundamentos Científicos y Tecnológicos, 2a edn. Madrid: AMV ediciones, Mundi-Prensa. [ Links ]
Pohl, P. (2007). What do metals tell us about wine? Trends Anal. Chem. 26, 941-949. [ Links ]
Rai, P.K., Lee, S.S., Zhang, M., Tsang Y.F., Kim K.-H. (2019). Heavy metals in food crops: Health risks, fate, mechanisms, and management. Environ. Int. 125, 365-385. [ Links ]
Salako, S. G., Adekoyeni, O. O., Adegbite, A. A., Hammed, T. B. (2016). Determination of metals content of alcohol and non-alcoholic canned drinks consumed at Idiroko Border Town Ogun State Nigeria. Br. J. Appl. Sci. Technol. 12, 1-8. [ Links ]
Salvo, F., La Pera, L., Di Bella, G., Nicotina, M., Dugo, G. (2003). Influence of different mineral and organic pesticide treatments on Cd(II), Cu(II), Pb(II), and Zn(II) contents determined by derivative potentiometric stripping analysis in Italian white and red wines. J. Agric. Food Chem. 51, 1090-1094. [ Links ]
Sauvage, L., Frank, D., Stearne, J., Millikan, M. B. (2002). Trace metal studies of selected white wines: An alternative approach. Analytica Chimica Acta, 458, 223-230. [ Links ]
Silva, A. L. O., Paulo, R. G., Silvana, D. C., Josino, C. (2005). Dietary intake and health effects of selected toxic elements. Braz. J. Plant Physiol. 17, 79-93. [ Links ]
Stanziani, A. (2009). Information, quality and legal rules: Wine adulteration in nineteenth century. France Business and History. 51, 268-291. [ Links ]
Tsakiris, A., Kallithraka, S., Kourkoutas, Y. (2016). Brandy and Cognac: Manufacture and Chemical Composition. Encyclopedia of Food and Health. 10.1016/B978-0-12-384947-2.00081-7. [ Links ]
Valadez-Vega, C., Zúniga-Pérez, C., Quintanar-Gómez, S., Morales-Gonzalez, J. A., Madrigal-Santillán, E., Villagómez-Ibarra, J. R., Sumaya-Martínez, M. T. and García-Paredes, J. D. (2011). Lead, Cadmium and Cobalt (Pb, Cd, and Co) Leaching of Glass-Clay Containers by pH Effect of Food. Int. J. Mol. Sci. 12, 2336-2350. [ Links ]
Vogiatzis, K. D., Polynski, M. V., Kirkland, J. K. Townsend, J., Hashemi, A., Liu, C., Pidko E.A. (2019). Computational approach to molecular catalysis by 3d transition metals: Challenges and opportunities. Chem. Rev. 119, 2453-2523. [ Links ]
Walker, G. S. (2017). Food authentication and traceability: An Asian and Australian perspective. Food Control. 72, 168-172. [ Links ]
Wani, A. L., Ara, A., Usmani, J. A. (2015). Lead toxicity: a review. Interdiscip. Toxicol. 8(2), 55-64. [ Links ]
World Health Organization (2003). Guidelines for drinking water quality. W.H.O. Geneva. [ Links ]
Woldemariam, D. M., Chandravanshi, B. S. (2011). Concentration levels of essential and non-essential elements in selected Ethiopian wines. Bull. Chem. Soc. Ethio. 25, 169-180. [ Links ]
Submitted for publication: August 2020
Accepted for publication: March 2021
Corresponding authors: E-mail address: thuleendlovu@gmail.com, vjaarsveldf@flrc.agric.za, CalebO@arc.agric.za
Acknowledgements: This work was based upon research supported in part by the Agricultural Research Council, South Africa. The Department of Science and Technology and National Research Foundation (NRF) Professional Development Programme (PDP) Block Grant awarded to Dr Ndlovu is gratefully acknowledged. The grant holder acknowledges that opinions, findings and conclusions or recommendations expressed in any publication generated by the NRF supported research are those of the authors, and that the NRF accepts no liability whatsoever in this regard

