


Services on Demand
Article
 English (pdf)
 Article in xml format
 Article references
Indicators

Related links
-
 Cited by Google
 -
 Similars in Google
Share

 Permalink
South African Journal of Enology and Viticulture
On-line version ISSN 2224-7904
Print version ISSN 0253-939X
S. Afr. J. Enol. Vitic. vol.42 n.1 Stellenbosch 2021
http://dx.doi.org/10.21548/42-1-3852
ARTICLES
A Review of Tannin Determination Methods Using Spectro-photometric Detection in Red Wines and Their Ability to Predict Astringency
C. Wilhelmy; C. Pavez; E. Bordeu; N. Brossard*
Department of Fruit Production and Enology, School of Agricultural and Forest Sciences, Pontificia Universidad Católica de Chile
ABSTRACT
Astringency is an important sensory attribute that influences red wine quality. The astringent sensation inside the mouth is caused by a group of molecules called tannins. These molecules in wine can be determined and analysed by spectrophotometric, analytical and recently electrochemical methodologies. This article focuses on the three methods most frequently used by the wine industry: Bate Smith or acid hydrolysis method, Adams Harbertson assay or BSA tannin assay, and methylcellulose precipitation (MCP) method. These methods differ on the principle upon which they are based, as well as on the kind of tannin that they can determine. The purpose of this article is to present the main advantages and disadvantages of the three spectrophotometric methods acid hydrolysis, BSA assay and MCP methods for tannin determination in red wine, in order to review their efficacy, group of tannins each method can determine, and their suitability for astringency prediction.
Keywords: Tannin content, Bate Smith, acid hydrolysis, Adams Harbertson, BSA tannin assay, methyl cellulose precipitation, astringency, red wines
INTRODUCTION
Within the multiple parameters that are used to characterize red wines, astringency is one of the factors that is important in assessing their quality (Brossard et al., 2016; García-Estévez et al., 2017). Tannins, which are known to be the main contributors to astringency in red wine, are secondary metabolites of plants and are usually classified as condensed tannins or proanthocyanidins, and hydrolysable tannins (Sarneckis et al., 2006).
Condensed tannins are flavan-3-ol polymers composed by different isomeric forms of catechin and gallocatechin (Aron & Kennedy, 2008; Kuhnle, 2018) and they are usually linked by C4-C8 and C4-C6 bonds giving rise to varying degrees of polymerization (Pascal et al., 2007; Vidal et al., 2004), expressed as mean degree of polymerization (mdP). Condensed tannins originate in the grape berry, where they are found both in skin and seeds (Harbertson et al., 2002). On the other hand, hydrolysable tannins are molecules that are easily decomposed in the presence of a weak acid and/or high temperatures to yield pyrogallol. Hydrolysable tannins are divided into gallotannins and ellagitannins, which yield different products under acid hydrolysis. Gallotannins produce a sugar molecule and gallic acid, whilst ellagitannins yield the same reaction products and additionally a molecule of ellagic acid (Smeriglio et al., 2017). Hydrolysable tannins can react among themselves to form large polymeric complexes. Hydrolysable tannins may also be present in red wine as a result of extraction from oak barrels or through the addition of commercial tannins.
Both condensed and hydrolysable tannins exist in a wide range of molecular weights, and can be found bound to other compounds present in red wines, such as sugars (Werner, 2011) or gallic acid (Mercurio et al., 2007). The associations between tannins and other red wine compounds, add more complexity to the chemical structure of tannins (Jensen et al., 2008; Mercurio & Smith, 2008), making the development of reliable methods for wine tannin determination and quantitation a challenging task.
From the sensory point of view, one of the most important characteristics of tannins is their ability to interact with salivary proteins present inside the mouth and produce their precipitation (Bajec & Pickering, 2008). The astringency mouthfeel is the result of interaction between tannins and a class of salivary proteins called proline-rich proteins (PRPs) (Mcrae & Kennedy, 2011). The subsequent aggregation and precipitation of the resulting complexes have been shown to reduce the lubricity of saliva, increasing friction between oral surfaces (Quijada-Morín et al., 2012). The precipitation reaction inside the mouth leads to the formation of tannin-protein aggregates, producing the loss of oral lubrication, which causes the astringent sensation (Upadhyay et al., 2016). Astringency perception associated with red wine consumption has been commonly described as a tactile sensation of drying, puckering, roughening and shrinking in the oral cavity (Gawel et al., 2000; Soares et al., 2016).
The astringent quality of some foods has been a topic of debate in the literature, with some authors defining astringency as a flavour (Bajec & Pickering 2008), and others stating that astringency is a tactile sensation associated to food texture (Bajec & Pickering, 2008; Ployon et al., 2018). The vocabulary used to describe the astringent sensation has also been a matter of study. Gawel et al.(2000) developed a series of terms to describe the astringent sensation of red wines organized in a mouth feel wheel (MFW). The MFW describes 13 different sub-qualities of astringency, with each sub-quality being divided into smaller tactile groups to better describe it. Despite the MFW being useful as a guide, the complexity of the terminology is hard to fully understand for tasters, and wine consumers. Additionally, extensive training is needed for applying the MFW to wine sensory analysis (Vidal et al., 2015), as astringency is a multifactorial sensation, which makes its sensory evaluation more complex (Ferrer-Gallego et al., 2014).
Regarding the impact of tannin content on wine quality, a proportional relationship between the amount of tannins and the intensity of the astringency perceived during wine consumption has been observed (Gawel et al., 2007). However, other factors are also important to consider: for example, astringency resulting from skin tannins is described as pleasant and, thus, favourable for wine quality (Cortell et al., 2005). On the other hand, astringency resulting from seed tannins is associated with undesired sensory "green" qualities in wine, associated to a greater proportion of galloyl groups that increase the affinity towards proteins due to hydrogen bonds which stabilize the tannin-protein interaction (Smith et al., 2015; Ferrer-Gallego et al., 2016; García-Estévez et al., 2017). Furthermore, it is important to consider the different cellar techniques which may enhance tannin extraction from grape berries into the must and therefore increase astringency, for instance the use of pectolytic enzymes, pre and post fermentative maceration, and saignée (Harbertson et al., 2009).
In the literature, different methods for wine tannin analysis, such as those based on tannin precipitation and colourimetric detection have been reported. The present study will focus on a review of the most used tannin analysis methods; Bate Smith or acid hydrolysis method, Adams Harbertson or BSA tannin assay, and methyl cellulose precipitation (MCP). In order to understand what each method is measuring, the chemical basis of the method is reviewed, and later, tannin concentrations in different red wines, as measured by each method, are compared, in order to assess variability of tannin measured by each one of the three methods herein reviewed. Differences in the values reported by each method could be explained by the chemical nature of each method. Also, on the basis of the chemical basis of the method, advantages and disadvantages of each method are discussed. Then, correlations between tannin content as evaluated by each method, with sensory astringency, are also reviewed. Likewise, differences in how each method correlates with sensory astringency could also be explained by the chemical nature of the methods, which could thus have an impact on each method reliability for the purpose of astringency prediction.
METHODS USED FOR TANNIN ANALYSIS
Wine tannin can be determined by means of colourimetric, gravimetric, chromatographic, or precipitation methods (Sarneckis et al., 2006). Additionally, indirect methods for astringency prediction in wine have been reported, such as the gelatine index (Sartini et al., 2011). Colourimetric assays for tannin determination are based on the reaction of the tannin with another chemical molecule to yield a coloured compound. The resulting concentration of the coloured compound is quantified by spectrophotometry using a calibration curve, and the tannin content in the wine analysed can thus be easily determined (Herderich & Smith, 2005). An example of this kind of method is the Bate Smith method, based on the Bate Smith reaction of condensed tannins (Ribéreau-Gayon & Stonestreet, 1966).
Precipitation methods for tannin determination rely on selective tannin precipitation with particular chemical reagents (Herderich & Smith, 2005). Hagerman and Butler (1978) pioneered the protein precipitation method for tannin determination using bovine serum albumin (BSA) to precipitate and quantify tannins. The method was later modified by Adams and Harbertson (Harbertson et al., 2003) and is nowadays known as the BSA assay. Likewise, the MCP method developed by Sarneckis et.al. (2006) is also a precipitation method, where the polysaccharide methyl cellulose is used to precipitate and quantify tannins. Currently, these two last methods are the most used for tannin determination in wine samples (Scollary, 2010).
Bate Smith Method or acid hydrolysis
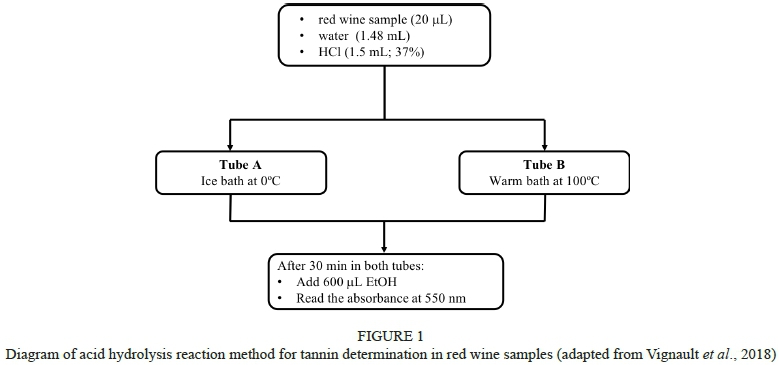
The Bate Smith method is a colourimetric method based on the hydrolysis reaction of proanthocyanins in a heated acidic medium to give coloured anthocyanin pigments. The analysis must be performed in parallel using two glass tubes, where only one tube is submitted to the acidic hydrolysis. This is necessary to correctly assess the colour change after the hydrolysis reaction. For the analysis, the wine sample is diluted in a 1:50 ratio with distilled water. Afterwards, 6 mL of hydrochloric acid (37% fuming) are added to 4 mL of the diluted wine samples. The reaction tube is heated at 100°C for 30 minutes to perform the acidic hydrolysis. Meanwhile, the tube that was not submitted to the acidic hydrolysis is saved for the next step. Before the spectrophotometric measurement, 1 mL of ethanol (95% v/v) must be added to both tubes, with and without hydrolysis (Ribéreau-Gayon & Stonestreet, 1966). The consequent colour formation in the reaction tube is directly proportional to the absorbance measured at 550 nm by the spectrophotometer and represents the tannin concentration expressed as g/L of (+)-catechin equivalents (Cáceres-Mella et al., 2013). An adaptation of this methods was reported (Vignault et al., 2018). In this procedure (Figure 1) the red wine sample (20 μL), water (1.48 mL) and hydrochloric acid (1.5 mL, 37%) are placed in two tubes. Tube A is placed in an ice bath (0°C) while tube B is placed in a warm bath (100°C). After 30 min, 600 μL of ethanol are added to both tubes to stop the reaction. The proanthocyanidin concentration in g/L is obtained multiplying the difference in absorbance at 550 nm between tube B and tube A by 19.33, which is the absorptivity coefficient of cyanidin after the acidic cleavage of the condensed tannins (Bate-Smith reaction), as summarised in equation 1.

The main advantage of this method is its easy implementation and reliability (Cáceres-Mella et al., 2013). However, some limitations regarding this method have been reported. First, the acid hydrolysis reaction only gives an estimation of the total tannin content without considering the chemical structure of tannins present in the wine sample analysed (Ribéreau-Gayon et al., 2006). Moreover, tannin concentration in wine is often overestimated, and it is possible to observe an increase over time, which does not correspond to an increase in tannin content (Aleixandre-Tudo et al., 2017). Also, the hydrolysis reaction performed at high temperature (100°C) for a long period, can lead to caramelization of sugars with a consequent browning, known as Maillard reaction. This reaction is particularly important in sweet wines because it can lead to an overestimation of tannin measurement (Oliveira et al., 2011).
Adams Harbertson assay
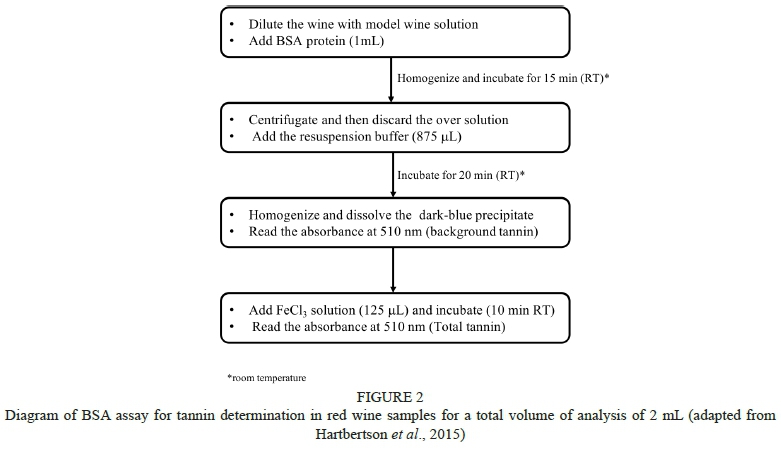
The Adams Harbertson or BSA assay (Harbertson et al., 2003) is a modification of the precipitation method published by Hagerman and Butler in 1978. The method was first adapted for wine analysis by Adams & Harbertson (1999), and then modified by Harbertson et al. (2002) and Harbertson et al. (2003). First, the wine sample has to be diluted in a model wine (12 % v/v of ethanol; pH 3.3). The diluted sample reacts with the globular bovine serum albumin (BSA) protein derived from cow's blood, giving as a result a precipitate after the centrifugation of the reaction tube. After discarding the supernatant, the tannin-protein complex is resuspended in a sodium dodecyl sulphate (SDS) and 5% triethanolamine (TEA) resuspension buffer and the absorbance at 510 nm (background tannin) is obtained. After an incubation period with the resuspension buffer, ferric chloride (0.27 g FeCl3/100 mL solution) is added and, finally, the absorbance of the solution is measured at 510 nm (total tannin). Tannin concentration in the sample is given by the subtraction between total tannin and background tannin. Quantitation of tannin in wine samples is performed by interpolation of this value in a standard calibration curve. The results obtained are expressed in g/L of (+)-catechin equivalents (Harbertson et al., 2003). The modification incorporated by Adams and Harbertson to the original method described by Hagerman and Butler, includes anthocyanins bleaching with bisulphite after the protein-tannin pellet precipitation. This modification allows to distinguish between large and small polymeric pigments. Recently, a modification on the composition of the resuspension buffer was reported (Harbertson et al., 2015), where the original resuspension buffer of SDS at pH 9.4 was replaced by urea (8.3 mol/L, pH 7.8). Results obtained after the analysis of 44 red wine samples using this modification showed that the urea buffer significantly increases the amount of tannin recovered and reduces the background absorbance shift. The new conditions assayed at neutral pH (Figure 2) may contribute to the stability of the protein-tannin complex and, therefore, improve tannin yield.
An experiment with isolated condensed tannins from cacao, from monomer to octamer, determined that the BSA assay has the ability to precipitate condensed tannins of different size, from trimers to octamers. However, this method is not able to determine monomers and dimers because BSA does not cause their precipitation (Harbertson et al., 2014). The reliability of tannin determination in wine samples using BSA assay is strongly influenced by very high tannin concentrations present in wines and also by the existence of a threshold tannin level necessary to produce protein precipitation (Jensen et al., 2008). Both factors can cause an underestimation of tannin concentration of the samples analysed using the BSA assay. In his study, Jensen et al. (2008) recommends to carefully dilute wine samples in order to obtain absorbance responses between 0.3 to 0.75 units. Additionally, a tannin-protein ratio between 17 to 45 (mole of tannin CE/mole BSA) was calculated, so as to ensure a proficient precipitation of tannins according to the saturation stoichiometry of BSA.
Results obtained by Kemp et al. (2011), showed that tannin precipitation using the BSA assay exhibited a linear behaviour related to tannin concentration since protein is in excess (for the range 0.40 - 1.80 mg BSA/mL). Additionally, this study supports the suggestion made by Jensen et al. (2008) about the existence of a tannin threshold concentration for precipitation with BSA to occur. However, they suggest a minimum tannin concentration of 100 mg CE/L, instead of -140 mg CE/L proposed before. In addition to this, it has been reported that the results of the BSA assay can vary on the basis of variables such as tannin and protein solution homogenization and contact time between tannins and BSA protein (Ropiak et al., 2017).
Methyl cellulose precipitation method
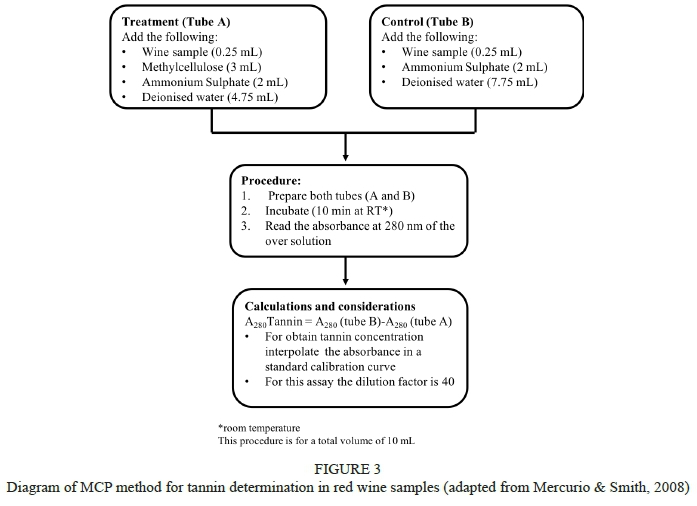
The MCP method was published in 2006 by Sarneckis et al. This method is based on the ability of tannin to precipitate with the polysaccharide methyl cellulose, and it can be used for tannin analysis of wine, 50% ethanol grape extract and aqueous tannin solutions. The determination is performed spectrophotometrically at 280 nm by the difference in absorbance of the supernatant obtained before and after tannin precipitation with a 0.04% methyl cellulose solution in the presence of a saturated ammonium sulphate solution (Figure 3). Quantitation of tannin in the wine or grape extract samples is performed by fitting a standard calibration curve.
Tannin results are expressed in g/L of (-) - epicatechin equivalents. In order to validate the method, Sarneckis et al. (2006) compared the tannin measured by the MCP precipitation with tannin determination by reverse-phase high performance liquid chromatography (HPLC). For this purpose, 121 red wines and 54 grape extracts samples were used. All samples were analysed by both MCP and HPLC methods. Validation results exhibited a good correlation for the determination of total tannin content between 0.1 and 3.0 g/L of epicatechin equivalents (r = 0.74) and a coefficient of variation of 3.0% (Sarneckis et al., 2006).
According to Sarneckis et al. (2006) the MCP method is selective for condensed tannins and does not suffer interference from other 280 nm absorbing phenolics such as anthocyanins or catechin monomers. The spectrophotometric determination of tannins at 280 nm avoids any need for indirect quantitation methods such as radioactive tracers (Henson et al., 2004) or non-specific colourimetric assays (Harbertson et al., 2003). Furthermore, a high throughput version using a 96-well plate reader has been proposed (Mercurio et al., 2007). This modification of the original method leads to a reduction of sample and reagents to a miniaturised format of 1mL. Validation studies conducted by Mercurio et al. (2007) showed that this format is equally efficient and reproducible as the analogous original version. The main advantage of the MCP method is that it is simple, fast, easy to implement and robust (Sarneckis et al., 2006; Mercurio & Smith, 2008). This versatility makes the MCP method especially useful for quality control in the wine industry.
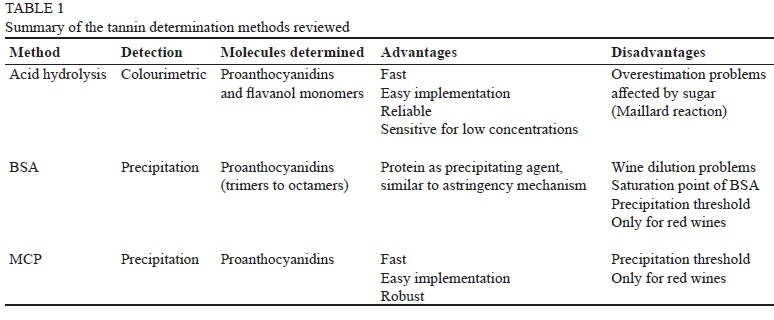
It is important to mention that significant differences in tannin concentration have been reported for the same wine samples using the MCP and BSA assays (Mercurio & Smith, 2008; Seddon & Downey, 2008; Harbertson & Downey, 2009; Cáceres-Mella et al., 2013). The main explanation for this behaviour is that MCP tannin assay quantifies as tannin the contribution from anthocyanin subunits incorporated into the tannin. On the other hand, the BSA assay would not include the anthocyanin compounds incorporated into the tannins because the ferric chloride step to produce the final colour change does not react with anthocyanins (Mercurio & Smith, 2008). Additionally, the BSA assay is not able to cause the precipitation of dimer and monomeric molecules of tannins (Harbertson et al., 2014). Apparently, tannin size is the most important factor for the formation of the protein-tannin complex, although other factors related to tannin structure could be equally important (Koerner et al., 2009; Ropiak et al., 2017). Additionally, it has been reported that the polysaccharide methylcellulose has a higher binding affinity for condensed tannin than the globular protein BSA (Kemp et al., 2011), which could affect tannin concentration results obtained using both MCP and BSA assays. Finally, Table 1 summarises the information of the three methods reviewed.
Other methods available for tannin analysis
It is important to mention that the methods reviewed in this study are not the only options available to determine and quantify tannins in red wines and grape extracts. A modification of the acid hydrolysis method has been reported, which uses the same chemical principle of the Bate Smith reaction but employing a mixture of n-butanol/HCl (95:5) to perform the tannin hydrolysis (Porter et al., 1985).
A gravimetric method based on tannin precipitation by a copper-acetate complex has been reported as an alternative to the Folin-Ciocalteu analysis (Yebra et al., 1995). Tannin measurement is performed indirectly by the quantitation of the unprecipitated copper using atomic absorption spectrometry. Results are expressed in μg/mL of tannic acid with a detection limit of 0.7 μg/mL. Recoveries of tannic acid added to three wine samples and one tea sample ranged between 96.1 and 104.3%, which shows the reliability of the method.
Another method reported is based on the reduction of Fe (III) to Fe (II) by tannins, producing a coloured dark blue solution. The Fe (II) obtained reacts with phenanthroline to from a coloured orange-red complex. The obtained complex exhibits UV-vis absorption at 335 and 540 nm (Tinkilic & Uyanik, 2001). However, this method reports unreliable tannin concentration, especially for beer and wine matrices.
A predictive method which combines Fourier transform mid-infrared (FT-MIR) spectroscopy and chemometric techniques has also been developed using protein precipitation and phloroglucinolysis as analytical reference methods (Fernández & Agosin, 2007). This method was able to determine tannin concentration as well as the mDP of tannins by means of the analysis of FT-MIR spectrum, by multivariate analysis using Partial Least Squares (PLS). High correlation and accuracy for the prediction of tannin concentration (r = 0.995; RMSEP = 9.4%) and mDP (r = 0.958; RMSEP = 10.3%) was obtained, with protein precipitation and phloroglucinolysis used as analytical reference methods. Similarly, using near-infrared spectroscopy (NIR) combined with chemometrics, a large number of methods have been reported, especially for the determination of the total polyphenolic content in wines. However, among all the articles published, only three of them (Cozzolino et al., 2008; Ferrer-Gallego et al., 2011; Zhang et al., 2017) paid special attention to tannin quantitation with good results.
TANNIN ANALYSIS AND ASTRINGENCY PERCEPTION IN RED WINES
The main challenge for tannin analysis has been to correlate tannin content with perceived astringency, as evaluated by trained panels, and also to be able to predict astringency in terms of wine quality (Kennedy et al., 2006; Gawel et al., 2007). So far, the only direct way of determining sensory astringency has been using a trained sensory panel, but even when these panels are comprised of expert panellists, they are difficult to train with an objective vocabulary, are time consuming and expensive (Ren et al., 2017).
Table 2 presents the results of studies that have analysed the relationship between tannin concentration in red wine using at least one of the three methods reviewed in the present article, with perceived sensory astringency. In spite of colourimetric methods being usually described as having low specificity to tannins (Herderich & Smith, 2005), tannin determination of 57 red wine samples using acid hydrolysis showed good correlation results (R2=0.8) with the sensory astringency perceived by a trained panel (Rinaldi et al., 2012).
Currently, in the winemaking industry, both MCP and BSA assay are the most used methods for astringency prediction, based on the tannin content of red wine, with good linear correlation coefficient (R2) with sensory astringency (Scollary et al., 2012). In particular, 4 studies which compare the tannin content with the BSA method and sensory astringency perceived showed correlation coefficients (R2) from 0.47 to 0.90 (Kennedy et al., 2006; Mercurio & Smith, 2008; Cáceres-Mella et al., 2013; Boulet et al., 2016). For the MCP method 3 different studies showed correlation coefficients (R2) from 0.59 to 0.86 (Mercurio & Smith, 2008; Cáceres-Mella et al., 2013; Brossard et al., 2016). It is important to mention that the study with lowest correlation coefficients, for both BSA (R2 = 0.47) and MCP (R2 = 0.59), included five rosé and five white wine (Sauvignon Blanc) samples, demonstrating that both the MCP and the BSA assay are not proficient for tannin determination for these kind of wines, as both methods consider aggregation between the precipitating agent and proanthocyanidins, which leads to pellet formation. The low concentration of procyanidins in rosé and white wines would not be high enough to reach the threshold for pellet formation (Cáceres-Mella et al., 2013)
Among all the tannin determination methods reviewed in this article, precipitation methods for tannin determination, such as the BSA and the MCP assay are specially interesting for astringency prediction because the interaction between tannins and the precipitant agent is similar to the astringency mechanism (Soares et al., 2018). Furthermore, the results enounced in Table 2 show that both of these methods are equally proficient for astringency prediction in red wines samples.
Last, even while precipitation methods give only relative information about wine tannin, they are useful from a viticultural or winemaking perspective because they are easy to use and implement in a winery, unlike HPLC tannin determinations, which are appropriate for analytical studies where the absolute amount of tannin, and tannin subunit composition are important.
CONCLUSIONS
Tannin quantitation is an important issue for the wine industry because, from a sensory point of view, tannins are one of the main molecules responsible for astringency and mouthfeel perception in red wines. Therefore, having a reliable, fast, proficient, and easy-to-implement method for tannin determination in red wines is a useful tool for astringency management during winemaking.
Among all tannin determination methods reviewed in the present article, the acid hydrolysis method has been used in several studies, mostly in Europe. The latter is mainly because this method is easy to implement and cost effective. However, acid hydrolysis may overestimate tannin concentration because it exhibits interaction with other wine components like sugars and additionally gives only an estimation of the total tannin content and does not differentiate between the different tannin structures that may be present in wine.
Both MCP and BSA assays are methods based on the precipitation of tannins, which is similar to the astringency mechanism inside the mouth. The two methods are specific for tannins derived from flavan-3-ol family or proanthocyadins. Results obtained for wine samples using both methods have shown that the MCP method usually exhibits higher values for total tannin content, than the BSA assay. This behaviour has been mainly attributed to the fact that BSA is only able to precipitate tannin of a specific size (from trimers to octamers) and does not precipitate polymeric pigment associated to tannin, which induces an underestimation in the total tannin content compared with the values obtained using MCP analysis.
Comparisons of MCP and BSA assay with instrumental methods, such as HPLC, have shown that instrumental methods are generally more precise and give more information about tannin composition and chemical structure. However, neither instrumental nor spectrophotometric tannin determination methods can give the exact tannin composition of wine, because currently there are few commercial standards available. It is thus only possible to estimate a degree of polymerization based on the identity of the monomeric terminal units.
Finally, the best method to determine the tannin content in wine samples is dependent on the information required by the researcher. For accurate research about chemical structure, the best option are instrumental methods, for instance HPLC. On the other hand, for daily routine analysis in a wine cellar the acid hydrolysis, MCP or BSA assay, are good options. However, if the aim of the analysis is to predict the intensity of astringency it is more suitable to use either the MCP or BSA assays. Finally, it would be interesting to test tannin determination methods with different enological practices, grape varieties, and with the use of hydrolysable tannins, so as to establish their performance and, thus, practical application for the wine industry.
LITERATURE CITED
Adams, D.O. & Harbertson, J.F., 1999. Use of Alkaline Phosphatase for the Analysis of Tannins in Grapes and Red Wines Am. J. Enol. Vitic. 50, 3. [ Links ]
Aleixandre-Tudo, J.L., Buica, A., Nieuwoudt, H., Aleixandre, J.L. and du Toit, W., 2017. Spectrophotometric analysis of phenolic compounds in grapes and wines J. Agric. Food Chem. 65, 20, 4009-4026. [ Links ]
Aron, P.M. & Kennedy, J.A., 2008. Flavan-3-ols: Nature, occurrence and biological activity Mol. Nutr. Food Res. 52, 1, 79-104. [ Links ]
Bajec, M.R. & Pickering, G.J., 2008. Astringency: Mechanisms and perception Crit. Rev. Food Sci. Nutr. 48, 9, 858-875. [ Links ]
Boulet, J.C., Trarieux, C., Souquet, J.M., Ducasse, M.A., Caillé, S., Samson, A., Williams, P., Doco, T. and Cheynier, V., 2016. Models based on ultraviolet spectroscopy, polyphenols, oligosaccharides and polysaccharides for prediction of wine astringency Food Chem. 190, 357-363. [ Links ]
Brossard, N., Cai, H., Osorio, F., Bordeu, E. and Chen, J., 2016. "Oral" tribological study on the astringency sensation of red wines J. Texture Stud. 47, 5, 392-402. [ Links ]
Cáceres-Mella, A., Pena-Neira, Á., Narváez-Bastias, J., Jara-Campos, C., López-Solís, R. and Canals, J.M., 2013. Comparison of analytical methods for measuring proanthocyanidins in wines and their relationship with perceived astringency Int. J. Food Sci. Technol. 48, 12, 2588-2594. [ Links ]
Cortell, J.M., Halbleib, M., Gallagher, A.V., Righetti, T.L. and Kennedy, J.A., 2005. Influence of vine vigor on grape (Vitis vinifera L. cv. Pinot noir) and wine proanthocyanidins J. Agric. Food Chem. 53, 14, 5798-5808. [ Links ]
Cozzolino, D., Cynkar, W.U., Dambergs, R.G., Mercurio, M.D. and Smith, P.A., 2008. Measurement of condensed tannins and dry matter in red grape homogenates using near infrared spectroscopy and partial least squares J. Agric. Food Chem. 56, 17, 7631- 7636. [ Links ]
Fernandez, K. & Agosin, E., 2007. Quantitative analysis of red wine tannins using Fourier-transform mid-infrared spectrometry J. Agric. Food Chem. 55, 18, 7294-7300. [ Links ]
Ferrer-Gallego, R., Hernández-Hierro, J.M., Rivas-Gonzalo, J.C. and Escribano-Bailón, M.T., 2011. Determination of phenolic compounds of grape skins during ripening by NIR spectroscopy LWT - Food Sci. Technol. 44, 4, 847-853. [ Links ]
Ferrer-Gallego, R., Hernández-Hierro, J.M., Rivas-Gonzalo, J.C. and Escribano-Bailón, M.T., 2014. Sensory evaluation of bitterness and astringency sub-qualities of wine phenolic compounds: Synergistic effect and modulation by aromas Food Res. Int. 62, 1100-1107. [ Links ]
Ferrer-Gallego, R., Brás, N.F., García-Estévez, I., Mateus, N., Rivas-Gonzalo, J.C., de Freitas, V. and Escribano-Bailón, M.T., 2016. Effect of flavonols on wine astringency and their interaction with human saliva Food Chem. 209, 358- 364. [ Links ]
Garcia-Estevez, I., Perez-Gregorio, R., Soares, S., Mateus, N. and de Freitas, V., 2017. Oenological perspective of red wine astringency J. Int. des Sci. la Vigne du Vin 51, 3, 237-249. [ Links ]
Gawel, R., Oberholster, A. and Francis, I.L., 2000. A 'Mouth-feel Wheel': terminology for communicating the mouth-feel characteristics of red wine Aust. J. Grape Wine Res. 6, 3, 203-207. [ Links ]
Gawel, R., Francis, L. and Waters, E.J., 2007. Statistical correlations between the in- mouth textural characteristics and the chemical composition of Shiraz wines J. Agric. Food Chem. 55, 7, 2683-2687. [ Links ]
Hagerman, A.E. & Butler, L.G., 1978. Protein Precipitation Method for the Quantitative Determination of Tannins J. Agric. Food Chem. 26, 4, 809812. [ Links ]
Harbertson, J.F., Kennedy, J.A. and Adams, D.O., 2002. Tannin in skins and seeds of Cabernet Sauvignon, Syrah, and Pinot noir berries during ripening Am. J. Enol. Vitic. 53, 1, 54-59. [ Links ]
Harbertson, J.F., Picciotto, E.A. and Adams, D.O., 2003. Measurement of Polymeric Pigments in Grape Berry Extracts and Wines Using a Protein Precipitation Assay Combined with Bisulfite Bleaching Am. J. Enol. Vitic. 54, 4, 301- 306. [ Links ]
Harbertson, J.F. & Downey, M.O., 2009. Technical brief investigating differences in tannin levels determined by methylcellulose and protein precipitation Am. J. Enol. Vitic. 60, 2, 246-249. [ Links ]
Harbertson, J.F., Mireles, M.S., Harwood, E.D., Weller, K.M. and Ross, C.F., 2009. Chemical and sensory effects of saignée, water addition, and extended maceration on high brix must Am. J. Enol. Vitic. 60, 4, 450-460. [ Links ]
Harbertson, J.F., Kilmister, R.L., Kelm, M.A. and Downey, M.O., 2014. Impact of condensed tannin size as individual and mixed polymers on bovine serum albumin precipitation. Food Chem. 160, 16-21. [ Links ]
Harbertson, J.F., Mireles, M. and Yu, Y., 2015. Improvement of BSA tannin precipitation assay by reformulation of resuspension buffer Am. J. Enol. Vitic. 66, 1, 95-99. [ Links ]
Henson, G.L., Niemeyer, L., Ansong, G., Forkner, R., Makkar, H.P. and Hagerman, A.E., 2004. A modified method for determining protein binding capacity of plant polyphenolics using radiolabelled protein Phytochem. Anal. 15, 3, 159-163. [ Links ]
Herderich, M.J. & Smith, P.A., 2005. Analysis of grape and wine tannins: Methods, applications and challenges Aust. J. Grape Wine Res. 11, 2, 205214. [ Links ]
Jensen, J.S., Werge, H.H.M., Egebo, M. and Meyer, A.S., 2008. Effect of wine dilution on the reliability of tannin analysis by protein precipitation Am. J. Enol. Vitic. 59, 1, 103-105. [ Links ]
Kemp, B., Harrison, R. and Hider, R., 2011. Effect of protein-tannin ratio and tannin concentration on the bovine serum albumin (BSA)-Based precipitation method for red wine tannin concentration J. Int. des Sci. la Vigne du Vin 45, 1, 39-46. [ Links ]
Kennedy, J.A., Ferrier, J., Harbertson, J.F. and des Gachons, C.P., 2006. Analysis of Tannins in Red Wine Using Multiple Methods: Correlation with Perceived Astringency 4, 481- 485. [ Links ]
Koerner, J.L., Hsu, V.L., Lee, J. and Kennedy, J.A., 2009. Determination of proanthocyanidin A2 content in phenolic polymer isolates by reversed-phase high-performance liquid chromatography J. Chromatogr. A 1216, 9, 1403-1409. [ Links ]
Kuhnle, G.G.C., 2018. Nutrition epidemiology of flavan-3-ols: The known unknowns Mol. Aspects Med. 61, 2-11. [ Links ]
Mcrae, J.M. & Kennedy, J.A., 2011. Wine and Grape Tannin Interactions with Salivary Proteins Molecules 16, 2348-2364. [ Links ]
Mercurio, M.D., Dambergs, R.G., Herderich, M.J. and Smith, P.A., 2007. High throughput analysis of red wine and grape phenolics - Adaptation and validation of methyl cellulose precipitable tannin assay and modified somers color assay to a rapid 96 well plate format J. Agric. Food Chem. 55, 12, 4651-4657. [ Links ]
Mercurio, M.D. & Smith, P.A., 2008. Tannin Quantification in Red Grapes and Wine: Comparison of Polysaccharide- and Protein-Based Tannin Precipitation Techniques and Their Ability to Model Wine Astringency J. Agric. Food Chem. 56, 14, 5528-5537. [ Links ]
Oliveira, C.M., Ferreira, A.C.S., De Freitas, V. and Silva, A.M., 2011. Oxidation mechanisms occurring in wines Food Res. Int. 44, 5, 1115-1126. [ Links ]
Pascal, C., Poncet-Legrand, C., Imberty, A., Gautier, C., Sarni-Manchado, P., Cheynier, V. and Vernhet, A., 2007. Interactions between a Non Glycosylated Human Proline-Rich Protein and Flavan-3-ols Are Affected by Protein Concentration and Polyphenol/Protein Ratio J. Agric. Food Chem. 55, 12, 4895-4901. [ Links ]
Ployon, S., Morzel, M., Belloir, C., Bonnotte, A., Bourillot, E., Briand, L., Lesniewska, E., Lherminier, J., Aybeke, E. and Canon, F., 2018. Mechanisms of astringency: Structural alteration of the oral mucosal pellicle by dietary tannins and protective effect of bPRPs Food Chem. 253, January, 79-87. [ Links ]
Porter, L.J., Hrstich, L.N. and Chan, B.G., 1985. The conversion of procyanidins and prodelphinidins to cyanidin and delphinidin Phytochemistry 25, 1, 223-230. [ Links ]
Quijada-Morín, N., Regueiro, J., Simal-Gándara, J., Tomás, E., Rivas-Gonzalo, J.C. and Escribano-Bailón, M.T., 2012. Relationship between the sensory-determined astringency and the flavanolic composition of red wines J. Agric. Food Chem. 60, 50, 12355-12361. [ Links ]
Ren, M., Wang, X., Du, G., Tian, C., Zhang, J., Song, X. and Zhu, D., 2017. Influence of different phenolic fractions on red wine astringency based on polyphenol/protein binding South African J. Enol. Vitic. 38, 1, 118-124. [ Links ]
Ribéreau-Gayon, P. & Stonestreet, E., 1966. Dosage des tanins du vin rouge et détermination de leur structure Chim. Anal. 48, 4, 188. [ Links ]
Ribéreau-Gayon, P., Glories, Y., Maujean, A. and Dubourdieu, D. eds., 2006. Handbook of Enology, Volume 2: The Chemistry of Wine-Stabilization and Treatments. Vol. 2. John Wiley & Sons. [ Links ]
Rinaldi, A., Gambuti, A. and Moio, L., 2012. Application of the SPI (Saliva Precipitation Index) to the evaluation of red wine astringency Food Chem. 135, 4, 2498-2504. [ Links ]
Ropiak, H.M., Lachmann, P., Ramsay, A., Green, R.J. and Mueller-Harvey, I., 2017. Identification of structural features of condensed tannins that affect protein aggregation PLoS One 12, 1, 1-24. [ Links ]
Sarneckis, C.J., Dambergs, R.G., Jones, P., Mercurio, M., Herderich, M.J. and Smith, P.A., 2006. Quantification of condensed tannins by precipitation with methyl cellulose: Development and validation of an optimised tool for grape and wine analysis Aust. J. Grape Wine Res. 12, 1, 39-49. [ Links ]
Sartini, E., Parpinello, G.P., Galassi, S. and Versari, A., 2011. Characterization of UVA Longanesi red wine by selected parameters related to astringency Int. J. Food Prop. 14, 5, 1081-1089. [ Links ]
Scollary, G.R., 2010. Grape and Wine Research and Development Corporation Tannin Review. Australia www.gwrdc.com.au/site/page.cfm. [ Links ]
Scollary, G.R., Pásti, G., Kállay, M., Blackman, J. and Clark, A.C., 2012. Astringency response of red wines: Potential role of molecular assembly Trends Food Sci. Technol. 27, 1, 25- 36. [ Links ]
Seddon, T.J. & Downey, M.O., 2008. Comparison of analytical methods for the determination of condensed tannins in grape skin Aust. J. Grape Wine Res. 14, 1, 54-61. [ Links ]
Smeriglio, A., Barreca, D., Bellocco, E. and Trombetta, D., 2017. Proanthocyanidins and hydrolysable tannins: occurrence, dietary intake and pharmacological effects Br. J. Pharmacol. 174, 11, 1244-1262. [ Links ]
Smith, P.A., McRae, J.M. and Bindon, K.A., 2015. Impact of winemaking practices on the concentration and composition of tannins in red wine Aust. J. Grape Wine Res. 21, 601-614. [ Links ]
Soares, S., Ferrer-Galego, R., Brandao, E., Silva, M., Mateus, N. and Freitas, V.D., 2016. Contribution of Human Oral Cells to Astringency by Binding Salivary Protein/Tannin Complexes J. Agric. Food Chem. 64, 41, 7823-7828. [ Links ]
Soares, S., García-Estévez, I., Ferrer-Galego, R., Brás, N.F., Brandão, E., Silva, M., Teixeira, N., Fonseca, F., Sousa, S.F., Ferreira-da-Silva, F. and Mateus, N., 2018. Study of human salivary proline- rich proteins interaction with food tannins Food Chem. 243, 175-185. [ Links ]
Tinkilic, N. & Uyanik, A., 2001. Spectrophotometric determination of the tannin contents of various Turkish black tea, beer and wine samples Int. J. Food Sci. Nutr. 52, 3, 289-294. [ Links ]
Upadhyay, R., Brossard, N. and Chen, J., 2016. Mechanisms underlying astringency: Introduction to an oral tribology approach J. Phys. D. Appl. Phys. 49, 10. [ Links ]
Vidal, L., Giménez, A., Medina, K., Boido, E. and Ares, G., 2015. How do consumers describe wine astringency? Food Res. Int. 78, 321-326. [ Links ]
Vidal, S., Francis, L., Noble, A., Kwiatkowski, M., Cheynier, V. and Waters, E., 2004. Taste and mouth-feel properties of different types of tannin-like polyphenolic compounds and anthocyanins in wine Anal. Chim. Acta 513, 1, 57-65. [ Links ]
Vignault, A., González-Centeno, M.R., Pascual, O., Gombau, J., Jourdes, M., Moine, V., Iturmendi, N., Canals, J.M., Zamora, F. and Teissedre, P.L., 2018. Chemical characterization, antioxidant properties and oxygen consumption rate of 36 commercial oenological tannins in a model wine solution Food Chem. 268, May, 210-219. [ Links ]
Werner, K., 2011. Changes in polysaccharides, tannin and total phenols throughout sur lies aging of Cabernet Sauvignon Wine University of California Davis. [ Links ]
Yebra, M.C., Gallego, M. and Valcarcel, M., 1995. Indirect flow-injection determination of tannins in wines and tea by atomic absorption spectrometry Anal. Chim. Acta 308, 1-3, 357-363. [ Links ]
Zhang, N., Liu, X., Jin, X., Li, C., Wu, X., Yang, S., Ning, J. and Yanne, P., 2017. Determination of total iron-reactive phenolics, anthocyanins and tannins in wine grapes of skins and seeds based on near-infrared hyperspectral imaging Food Chem. 237, 811-817. [ Links ]
Submitted for publication: January 2020
Accepted for publication: November 2020
* Corresponding author: Natalia Brossard; ndbrossa@uc.cl; TEL: +56 22 354 4165

