


Services on Demand
Article
 English (pdf)
 Article in xml format
 Article references
Indicators

Related links
-
 Cited by Google
 -
 Similars in Google
Share

 Permalink
South African Journal of Enology and Viticulture
On-line version ISSN 2224-7904
Print version ISSN 0253-939X
S. Afr. J. Enol. Vitic. vol.41 n.2 Stellenbosch 2020
http://dx.doi.org/10.21548/41-2-4195
ARTICLES
Alteration Index Three Facilitates Interpretation of ß-Glucosidase, Acid-phosphatase and Urease Activities in Soils Irrigated with Diluted Winery Wastewater
I. van Huyssteen*; A.R. Mulidzi; A.H. Meyer; J. Wooldridge
Soil and Water Science Division, ARC Infruitec-Nietvoorbij (The Fruit, Vine and Wine Institute of the Agricultural Research Council), Private Bag X5026, 7599, Stellenbosch, South Africa
ABSTRACT
Soil enzyme activity data from a lysimeter pot trial involving four dissimilar soils irrigated over two simulated seasons (SS) with winery wastewater (WW) and municipal water (MW), were converted to numerical scores using the alteration index three (AI3). Unlike the activities of individual enzymes which are substrate specific and do not reflect the overall status of the soil microbiome, AI3 enabled differences in treatment-induced alteration states between combinations of soil and water to be quantified and statistically assessed. The more negative AI3 scores corresponded to a more altered state in the WW than the MW treatments, after SS3 than after SS4 and in the 0-10 cm compared to the 10-20 cm soil depth interval. AI3 is therefore a potentially useful adjunct to soil enzyme activity assays in monitoring and management of biological activity in vineyard soils. These findings, however, require verification under commercial vineyard conditions.
Keywords: Alteration index three, Soil enzyme activity, Winery wastewater irrigation, Soil health
INTRODUCTION
Wineries produce substantial volumes of wastewater, so re-using this wastewater to irrigate vineyards could hold many potential benefits for the wine industry (Conradie et al., 2014; Howell & Myburgh, 2018). However, there are legal requirements in terms of the General Authorisations published in the Government Notice Nr. 399 (26 March 2004) in terms of section 39 of the National Water Act (1998) that govern the use of winery wastewater for irrigation purposes. Untreated winery wastewater may not be discharged into the environment but has to be treated prior to discharge.
The quantity and composition of winery wastewater (WW) vary, depending on the processes taking place in the winery, most of which are seasonal (Howell & Myburgh, 2018). Changes in water quality may affect soil chemistry and physical parameters such as hydraulic conductivity, ponding and gas exchange, all of which are likely to affect soil microbiology, enzyme activity and organic matter decomposition. Both water quality and soil enzyme activities should, therefore, be monitored frequently, for which a fast and reliable method of analysis, and easy data interpretation is essential.
Soil enzyme activities, notably that of ß-glucosidase, phosphatase and urease (carbon (C), phosphorus (P) & nitrogen (N) cycling, respectively), are rapid and sensitive indicators of soil health and soil ecosystem sustainability (Pascual et al., 2000; Moebius-Clune et al., 2016; Adetunji et al., 2017), and are commonly used in biological assays (Adetunji et al., 2017). However, because soil enzymes are substrate specific, their individual activities are not indicative of overall biological activity (Adetunji et al., 2017). Neither do the activities of all soil enzymes react in the same way when soil or irrigation water parameters change (Mulidzi & Wooldridge, 2016). Consequently, the activities of single, or even of multiple enzymes are not readily interpreted. Interpretation of soil enzyme activities may nevertheless be facilitated by converting the enzyme activities to indexes (Puglisi et al., 2006).
Alteration index three (AI3), which was developed and validated by Puglisi et al. (2006), is a data reduction process that combines and balances the activities of ß-glucosidase, phosphatase and urease into scores reflecting the degree of positive or negative change (alteration). This alteration may have been brought about in the soil microbiome by natural (e.g. erosion (Garcia & Hernandez, 1997)) or anthropogenic processes (e.g. pollution (Leirós et al., 1999; Trasar-Cepeda et al., 2000)) and soil organic ameliorants (Meyer et al., 2014)). In an apple orchard where factorial combinations of organic and conventional treatments had been applied, Meyer et al. (2014) reported that AI3 was able to differentiate between treatments, to correlate with soil organic matter (SOM) content, and to correlate with yield and yield efficiency, thereby linking AI3 with orchard soil surface management practices, and with tree performance.
Unlike soil parameters such as pH and P content, AI3 scores do not have ideal, or target values. They range from negative to positive (Puglisi et al., 2006) and are commonly used to compare treated (altered) with untreated but otherwise similar soils (controls). After reviewing published data notably that of Caravaca et al. (2002), Puglisi et al. (2006) concluded that AI3 scores were more negative where control soils were generally characterised by higher total organic carbon contents (TOC) than negatively altered (treated) soils. Ghosh et al. (2020) also showed that AI3 scores become increasingly more negative with increasing soil organic content. For example, they showed that, in the 0-15 cm soil layers of soybean-wheat, AI3 tracked soil organic carbon (SOC) levels of 0.62, 0.68, 0.82, 0.90, 0.89, 1.04 with scores of, respectively, -28.5, -29.7, -30.8, -33.0, -35.2, -36.9. On the contrary, AI3 scores could also become progressively less negative, or even positive, as the degree of alteration increased, and vice versa. To this effect, Leirós et al. (1999) showed that, 28 days after application, AI3 tracked copper application rates of 0, 1 000, 2 000, 5 000 and 10 000 mg/kg with scores of, respectively, -257, -176, -111, -54 and 12. Alteration index three may also be used as an indicator of rehabilitation, as where Hinojosa et al. (2004) observed AI3 scores of -3.1, -24.4 and -36.6, in mining effluent, for polluted, rehabilitated and non-polluted catchments, respectively. According to Puglisi et al. (2006), the discriminating power of AI3 was appreciable (p > 0.005).
From the foregoing, AI3 appears to provide a simpler and more formally derived indication of the extent of soil alteration than can be obtained by interpreting the activities of individual enzymes. To test this supposition AI3 scores were calculated from, and compared with, enzyme activities in differently textured soils that had been irrigated with diluted (WW) and municipal water (MW).
MATERIALS AND METHODS
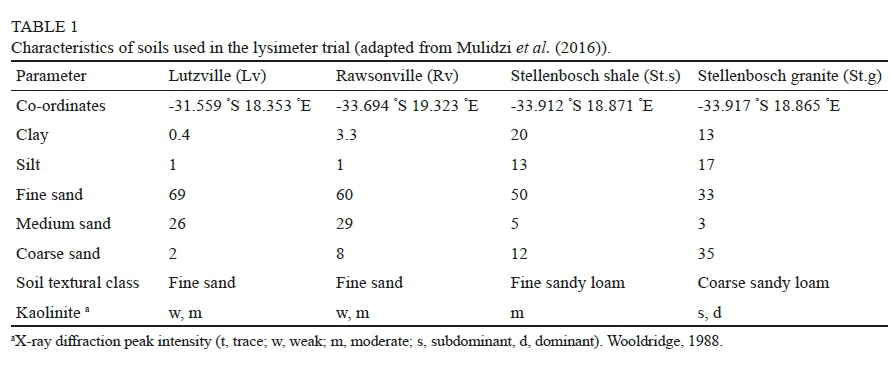
The research of which this article is an extension, has been described by Mulidzi and Wooldridge (2016), and Mulidzi et al. (2016). In summary, composite samples (homogenised after collection) of four pedogenetically different soils were collected from 0-30 cm soil intervals at four actual vineyard locations in the Western Cape (Table 1), packed into pots (200 mm lengths of 150 mm PVC pipe on perforated bases, compressed to a bulk density of 1 400 kg.m-3) and drip irrigated to saturation whenever the gravimetric soil water potential decreased by 85%, using either MW, or WW that had been diluted (Myburgh et al., 2015) with MW to a chemical oxygen demand (COD) of 3000 mg/L. Alluvial vineyard soil (Longlands form) from Rawsonville (Rv), an aeolian veld soil (Garies form) from Lutzville (Lv), as well as shale (St.s) and granite (St.g) derived soils (Oakleaf and Cartref forms, respectively) from Stellenbosch were used in this experiment (Soil Classification Work Group, 1991). Initial pH, COD and P levels in the MW were 7.4, 27.9 and 1.1 mg/L, respectively. Corresponding values for the WW were 5.4, 3210 and 4.7 mg/L, respectively. Difficulties were experienced in restoring field capacity in some of the soils, ponding and run-off of water being observed in some cases, and lack of drainage after irrigation in others (Mulidzi et al., 2016).
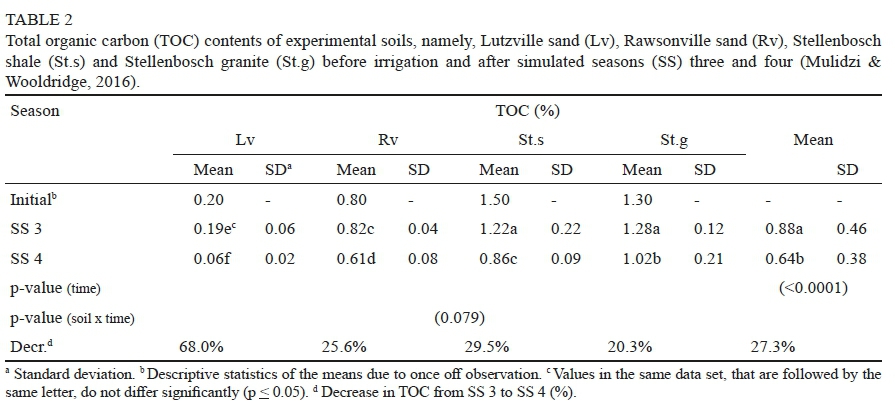
After six irrigation events (one simulated season (SS)), a pot was removed from each water x soil treatment for analysis. Four such simulated seasons were applied, but the samples from SS1 and SS2 were set aside on the grounds that equilibrium had probably not been reached during these seasons. After SS3 and SS4, the soil from the 0-10 cm and 10-20 cm depth intervals from each pot were analysed to determine the activities of β-glucosidase, acid phosphatase and urease by colourimetry (Tabatabai & Bremner, 1969; Eivazi & Tabatabai, 1988; Kandeler & Gerber, 1988). Total organic carbon (TOC) levels were determined by the Walkley and Black method (1934) in the original soil samples and after SS3 and SS4 (Table 2).
The enzyme activity data were converted to AI3 scores (Table 3) using the relationship of Puglisi et al. (2006):

where enzyme activities were expressed in micromoles of, respectively, p-nitrophenyl-ß-D-glucoside and p-nitro-phenylphosphate per gram of soil per hour, and micrograms of urea per gram of soil per hour. The loadings (7.87, 8.22 and 0.49) used in this relationship were derived by Puglisi et al. (2006) using a dimension reducing technique resembling principle component analysis (CDA) and the canonical discriminant analysis procedure (PROC CANDISC and PROC STEPDISC (SAS Institute, 1985)).
Each of the soil (4) x water (2) treatments was replicated in four blocks in a fully randomized split-plot design with soil and water as main treatments and simulated season and depth interval as sub-plot factors. The data were tested for normality by the method of Shapiro & Wilk (1965) and found to be acceptably normally distributed and subjected to analysis of variance (ANOVA) using SAS version 9.2 (SAS Institute, 2008). Student's t-test and least significant difference values (LSD) were calculated at the 5% probability level to facilitate comparison between treatment means (Ott, 1998). Means within data sets that differed at the 5% probability level were considered significantly different.
RESULTS AND DISCUSSION
The enzyme activity, soil and water data used in this article are derived from the research of Mulidzi et al. (2016) and Mulidzi and Wooldridge (2016). In the present article these data are discussed in the context of AI3.
Effects of soils on AI3
Mulidzi and Wooldridge (2016) reported that acid phosphatase activities responded to the soil treatments differently than urease and ß-glucosidase, implying that interpretation of activities of disparate groups of enzymes will only be successful if variation in enzyme activity is taken into account, as in the AI3 relationship.
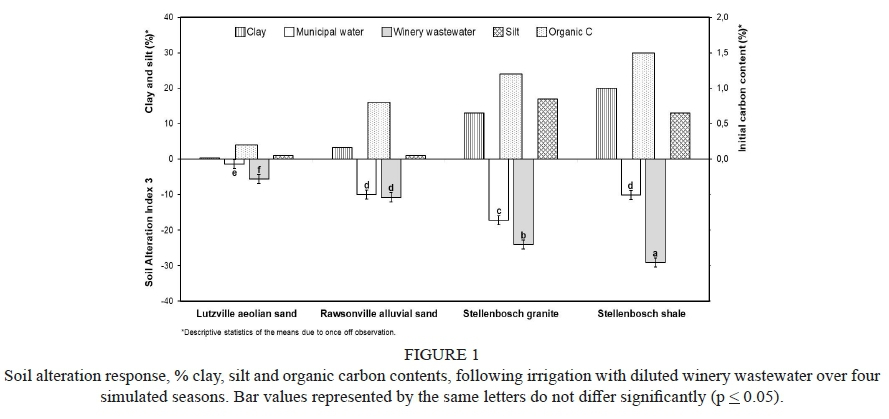
Averaged over all treatments, AI3 scores became increasingly negative, indicating a progressive change in soil alteration, in the sequence: Lv < Rv < St.s < St.g, i.e. with increasing clay, silt and TOC content (Tables 2 & 3). Figure 1 supports this link between AI3, clay, silt and TOC; components that are usually associated with soil quality.
This indicated that AI3 was able to distinguish between soil quality, with Lv and Rv (i.e. sandy soils) being low fertility soils, and St.s and St.g (i.e. fine and coarse sandy loam soils) of better quality, associated with their higher TOC, silt and clay contents (Tables 2 & 3). A large portion of enzymes is protected by physio-chemically adsorption to soil clay minerals where they are immobilized and stabilized (Tabatabai, 1994), thereby influencing their activity (Dick & Tabatabai, 1992). Enzymes also naturally bind to the humus fraction in organic matter through various mechanisms (Ladd & Butler, 1975). Since organic matter also bind to clay minerals, it increases the surface area and number of active sites compared to silt and sand (Frankenberger & Johanson, 1982), thereby enhancing enzyme adsorption. Thus, soils with a higher clay and organic matter content tend to have higher soil enzyme activities than sandy soils (Dick et al., 1996) because they have a greater ability to store organic matter than sandy soils (Gispert et al., 2013). As derived from Mulidzi & Wooldridge (2016) and confirmed by AI3, activities of the three enzymes were higher in St.s and St.g soils, inferring that these soils function better than the low fertility sandy soils. It stresses the importance of knowing the clay and organic matter content of a soil that is to be altered because this determines its ability to protect microbial secreted enzymes responsible for decomposing organic matter and thus, the release of plant nutrients.
The AI3 scores did not differ between St.s and St.g despite differences in clay (Table 1), silt and organic carbon content, although the activities of the three individual enzymes differed significantly (Mulidzi & Wooldridge, 2016). This variation in the individual enzyme activity trends between these soils was strongly regulated by the difference in the type of clay mineral content (Olagoke et al. 2019) in each soil or by the combination of clay, silt and TOC. Mulidzi and Wooldridge (2016) reported that the respective activity trends of β-glucosidase, acid phosphatase and urease in St.s followed the exact opposite trend in St.g, thereby influencing the outcome of the AI3 scores. Since the weighting applied to acid phosphatase (8.22) and to β-glucosidase (7.87) in the AI3 equation is higher than that of urease (0.49), small changes in acid phosphatase and β-glucosidase activities have a greater effect on AI3 than a change of similar magnitude in urease. Therefore, when applied, the AI3 can quantify the balance between the activities of these three enzymes.
The AI3 showed that the degree of alteration in the St.s and St.g after WW irrigation, would be similar in magnitude because both soil types hold similar enzymatic activity potential compared to Lv and Rv soils.
Water source
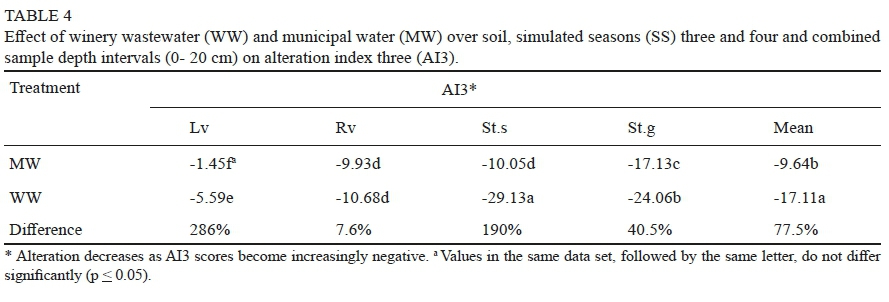
Average (all soils) AI3 scores were more negative in the WW than the MW soils (Table 4), implying a greater degree of alteration in the former. The differences in AI3 ranged from 7.6% in the high-P alluvial vineyard soil (Rv) to 286% in the aeolian soil (Lv), with an average change for the four soils of 77.5%.
An explanation for the more negative AI3 scores from the WW compared with the MW supply is that soil enzyme activity increased significantly after inputs of WW, suggesting that WW may contain substrates that induced the activities of β-glucosidase, acid phosphatase and urease. Previous studies have shown that WW contained easily decomposable organic compounds such as urethane and cellubiose (Fidaleo et al., 2006; Villena et al., 2007) found in grape musts and yeasts that are substrates for urease and β-glucosidase activity, respectively. Winery wastewater also contains traces of phosphorous in the form of inorganic and organic compounds, of which the latter may act as substrate for acid phosphatase activity.
The Lv soils had the highest AI3 WW to AI3 MW ratio (3.9:1), and by implication, was altered the most, i.e. was most responsive to WW irrigation, followed by the St.s (2.9:1) and the St.g (1.4:1), whereas Rv remained relatively unaltered (1.1:1). The intensity of these alterations was nevertheless dependent on soil aggregate stability (Mulidzi & Myburgh, 2014; Mulidzi et al., 2015), as well as a decline in the initial TOC (Table 2).
According to Six and Jastrow (2002) organic matter has a shorter mean residence time in sandy soils (macroaggregates), as was the case with Lv which showed a phenomenal decline of about 70% of the initial TOC. Thus, soil with low clay and organic carbon contents will have the quickest turnover of organic matter after multiple WW inputs. The high clay dispersion reported by Mulidzi & Myburgh (2014) and Mulidzi (2015), together with an excessive decline of 43% in initial TOC after WW inputs caused the alteration in the St.s. Although the St.g showed signs of structural damage (Mulidzi & Myburgh, 2014; Mulidzi, 2015) it still retained
around 80% of the initial TOC after 24 WW inputs. The Rv soil was well-aerated and well-drained during WW inputs (Mulidzi et al., 2016) and retained 80% of its initial TOC, hence its relatively unaltered state.
This study indicated that enzyme activity induced by WW inputs will play an important role in the decomposition of organic matter which will vary across soil textural range.
Simulated season
Average AI3 scores were less negative after SS4 than after SS3 (Table 5). Changes in AI3 between simulated seasons did not appear to be linked to texture (Table 1), but rather to differences in the availability of metabolizable substrate after SS3 sampling date. In support of this assumption the mean TOC levels (across both water treatments) in the SS4 soil samples were 27.3% lower than in SS3 soils and their initial pre-trial state (Table 2); most likely due to leaching of TOC and of enzymes after the initial accumulation or buildup to SS3.
A further explanation for the less negative AI3 scores at SS4, is that repeated additions of MW and WW had also affected the pH of soils. The pH of the MW decreased from 7.4 to 5.6, while that of the diluted WW increased from 5.4 to 7.1, which will in turn affect the optimum range of the three enzyme activities and thus the AI3 scores (data not shown).
Sample depth
AI3 could accurately reflect gradients in mineralizable substrates across a transect of two soil layers with the top layers being consistently higher than the subsoil. For each of the soils, as well as the all-soils average, the AI3 scores were more negative in the 0-10 cm than the 10-20 cm soil depth interval (Table 6), which supports work reported by Mulidzi & Wooldridge (2016). Percentage-wise, the difference between the two depths in each soil ranged in sequence: 61% (Lv) > 58% (St.s) > 33% (Rv) > 16% St.g. That AI3 was more negative (by 39.4% on average) in the 0-10 than the 10-20 cm intervals may have been at least partially due to differences in soil oxygen content and a shortage of metabolizable substrate energy (Jackson et al., 2019).
Treatment interactions
From the season x water interaction (Table 7) it is evident that alteration levels were signified by strongly negative average AI3 scores in the SS3 x WW treatment combination, in which alteration increased in intensity in the soil sequence: Lv > Rv > St.g > St.s. Alteration levels were signified with the least negative mean AI3 scores in the SS4 x MW combination, notably in the fine, sandy Lv soil. Evidently, under the prevailing trial conditions, irrigating soils with WW improved AI3 scores to a greater extent than irrigation with MW. This supports Kumar et al. (2006) who reported that irrigation with WW does not adversely impact microbial activity and, in their research, promoted it.
Implications
As shown in Table 3, AI3 was able to quantify, compare and contrast alteration states, apparently with a reasonable, though as yet unquantified, level of sensitivity. AI3 not only differentiated between soils, water sources, simulated seasons and sample depths but also, using the scores allocated to each combination of the foregoing factors, facilitated direct comparison between combinations of these factors. AI3 scores not only reflect changes in enzyme activity due to natural changes in the environment, such as erosion, or to management practices, as in the present case where WW was substituted with for MW, but also to stages of recovery from such events or practices (Puglisi et al., 2006).
Although AI3 facilitates interpretation of soil enzyme activities, it does not identify the cause of any observed alteration. In terms of the soil health concept, which entails managing soils so that they remain fit for their purpose and able to support crops into the future (Moebius-Clune et al., 2016), monitoring of soil physical, chemical and biochemical parameters must therefore be an ongoing process (Howell & Myburgh, 2018).
CONCLUSIONS
AI3 generates numerical scores from the activities of urease, phosphatase and ß-glucosidase. These scores enable differences in treatment-induced alteration states between applied treatment combinations to be quantified and compared. Uncertainties that arise where the activities of enzymes are interpreted individually are eliminated, although the activities of urease, phosphatase and ß-glucosidase must still be determined. The AI3 index is therefore an aid or adjunct to interpretation rather than an alternative to enzyme analysis. In this role it has potential for use in the monitoring and management of enzymatic activity in vineyard soils. The results obtained from this lysimeter trial must be verified by field testing under vineyard field conditions over a range of soil and water combinations, ideally in combination with different soil surface management practices.
LITERATURE CITED
Adetunji, A.T., Lewu, F.B., Mulidzi, R. & Ncube, B., 2017. The biological activities of ß-glucosidase, acid phosphatase and urease as soil quality indicators: a review. J. Soil Sci. Plant Nutr. 17, 794-807. [ Links ]
Caravaca, F., Masciandaro G. & Ceccanti, B., 2002. Land use in relation to soil chemical and biochemical properties in a semiarid Mediterranean environment. Soil Tillage Res. 68, 23-30. [ Links ]
Conradie, A., Sigge, G.O. & Cloete, T.E., 2014. Influence of winemaking processes on the characteristics of winery wastewater and water usage in wineries. S. Afr. J. Enol. Vitic. 35, 10-19. [ Links ]
Dick, R.P., Breakwell, D.P. & Turco, R.F., 1996. Soil enzyme activities and biodiversity measurements as integrative microbiological indicators. Methods for Assessing Soil Quality, SSSA Special publication 49. [ Links ]
Dick, W.A. & Tabatabai, M.A., 1992. Potential uses of soil enzymes. In F.B. Metting, Jr. (ed.) Soil microbial ecology: Appl. Agri. Environ. Manage. Marcel Dekker, New York, 95-127. [ Links ]
Eivazi, F. & Tabatabai M.A., 1988. Glucosidases and galactosidases in soils. Soil Biol. Biochem. 20, 601-606. [ Links ]
Fidaleo, M., Esti, M. & Moresi, M., 2006. Assessment of urea degradation rate in model wine solutions by acid urease from Lactobacillus fermentum. J. Agric. Food Chem. 54. 6226-6235. [ Links ]
Frankenberger, W.T. & Johanson, J.B., 1982. Effect of pH on enzyme stability in soils. Soil Biol. Biochem. 4, 433-437. [ Links ]
Garcia, C. & Hernandez, T., 1997. Biological and biochemical indicators in derelict soils subjected to erosion. Soil Biol. Biochem. 29, 171-177. [ Links ]
Ghosh, A., Singh, A.B., Kumar, R.V., Manna, M.C., Bhattacharyya, R., Rahman, M.M., Sharma, P., Raiput, P.S. and Misra, S., 2020. Soil enzymes and microbial elemental stoichiometry as bio-indicators of soil quality in diverse cropping systems and nutrient management practices of Indian Vertisols. Appl. Soil Ecol. 145, 103304. [ Links ]
Gispert, M., Emran, M., Pardini, G., Serena, D. & Ceccanti, B., 2013. The impact of land management and abandonment on soil enzymatic activity, glomalin content and aggregate stability. Geoderma 202-203. 51-61. [ Links ]
Hinojosa, M.B., Carreira, J.A., Garcia-Ruiz, R. & Dick, R.P., 2004. Soil moisture pre-treatment effects on enzyme activities as indicators of heavy metal-contaminated and reclaimed soils. Soil Biol. Biochem. 36, 15591568. [ Links ]
Howell, C.L. & Myburgh, P. A., 2018. Management of winery wastewater by re-using it for crop irrigation - A review. S. Afr. J. Enol. Vitic. 39, 116-132. [ Links ]
Jackson, O., Quilliam, R.S., Stott, A., Grant, H. & Subke, J.-A., 2019. Rhizosphere carbon supply accelerates soil organic matter decomposition in the presence of fresh organic substrates. Plant Soil 440, 473-490. [ Links ]
Kandeler, E. & Gerber, H., 1988. Short-term assay of soil urease activity using colourimetric determination of ammonium. Biol. Fert. Soils. 6, 68-72. [ Links ]
Kumar, A., Saison, C., Grocke, S., Doan, H., Correll, R. & Kookana, R., 2006. Impact of winery wastewater on ecosystem health. Final report. CSIRO Centre for Environmental Contaminants Research, CSIRO Land and Water, Adelaide, SA 5064 [ Links ]
Ladd, J.N. & Butler, J.A.H., 1975. Humus-enzyme systems and synthetic, organic polymer-enzyme analogs. Soil Biochem. 4, 143-194. [ Links ]
Leirós, M.C., Trasar-Cepeda, C, Garcia-Fernández, F. & Gil-Sotres, F., 1999. Defining the validity of a biochemical index of soil quality. Biol. Fert. Soils 30, 140-146. [ Links ]
Meyer, A.H., Wooldridge, J. & Dames, J.F., 2014. Relationship between soil alteration index three (AI3), soil organic matter and tree performance in a 'Cripp's Pink'/M7 apple orchard. S. Afr. J. Plant Soil 31, 173-175. [ Links ]
Moebius-Clune, B.N., Moebius-Clune, D.J., Gugino, B.K., Idowu, O.J., Schindelbeck, R.R., Ristow, A.J., van Es, H.M., Thies, J.E., Shayler, M.B., McBride, M.B., Kurtz, K.S.M., Wolfe, D.W. & Abawi, G.S., 2016. Comprehensive assessment of soil health - The Cornell framework, 2nd ed. 3.2, Cornell. [ Links ]
Mulidzi, A.R. & Myburgh, P.A., 2014. Chapter 9: Effect of irrigation with augmented winery wastewater on the chemical properties of four different soils. In: Myburgh, P.A. & Howell, C.L. (eds). The impact of wastewater irrigation by wineries on soils, crop growth and product quality. WRC Report No. 1881/14. Water Research Commission. Private Bag X103, Gezina, Pretoria, 0031. [ Links ]
Mulidzi, A.R., Clark, C.E. & Myburgh, P.A., 2015. Effect of irrigation with diluted winery wastewater on cations and pH. S. Afr. J. Enol Vitic., 36, 402-412. [ Links ]
Mulidzi, A.R., Clarke, C.E. & Myburgh, P.A., 2016. Design of a pot experiment to study the effect of irrigation with diluted winery wastewater on four differently textured soils. Water S.A. 42, 20-25. [ Links ]
Mulidzi, A.R. & Wooldridge, J., 2016. Effect of diluted winery wastewater on enzyme activity in four Western Cape soils. Sustainability in Environment 2, 141-156. [ Links ]
Myburgh, P.A., Lategan, E.L. & Howell, C.L., 2015. Infrastructure for irrigation of grapevines with diluted winery wastewater in a field experiment. Water S.A. 41, 643-647. [ Links ]
Olagoke, F.K., Kalbitz, K. and Vogel, C., 2019. Control of soil extracellular enzyme activities by clay minerals - Perspectives on microbial responses. Soil Syst. 3 (64), 2-16. [ Links ]
Ott, R.L., 1998. An Introduction to statistical methods and data analysis. Belmont, California, Duxbury Press. pp. 807-837. [ Links ]
Pascual, J.A., Garcia, G., Hernandez, T., Moreno, J.L. & Ros, M., 2000. Soil microbiological activity as a biomarker of degradation and remediation processes. Soil Biol. Biochem. 32, 1877-1883. [ Links ]
Puglisi, E., Del Re, A.A.M., Rao, M.A. & Gianfreda, L., 2006. Development and validation of numerical indices integrating enzyme activities of soils. Soil Biol. Biochem. 38, 1673-1681. [ Links ]
SAS Institute, 2008. SAS/STAT® Users Guide Version 9.2., SAS Institute, Campus Drive, Cary, North Carolina, 27513. [ Links ]
Shapiro, S.S. & Wilk, M.B., 1965. An analysis of variance test for normality (complete samples). Biometrika 52, 591-611. [ Links ]
Six, J. & Jastrow, J.D., 2002. Organic matter turnover. Encyclopedia of Soil Science. Marcell Dekker, Inc. New York. 936 - 942. [ Links ]
SOIL CLASSIFICATION WORK GROUP (1991) Soil classification -A taxonomic system for South Africa. Memoirs on Natural Resources of South Africa no. 15. Dept. Agric. Development, Pretoria. [ Links ]
Tabatabai MA. 1994. Enzymes. In: Weaver, R.W., Augle, S., Bottomly, P.J., Bezdicek, D., Smith, S., Tabatabai, M.A. & Wollum, A. (eds). Methods of soil analysis. Part 2: Microbiological and biochemical properties. Soil Science Society of America, Madison, pp. 775-833. [ Links ]
Tabatabai, M.A. & Bremner, J.M., 1969. Use of p-nitrophenyl phosphate for assay of soil phosphatase activity. Soil Biol. Biochem. 1, 301-307. [ Links ]
Trasar-Cepeda, C., Leirós, M.C., Seoane, S. & Gil-Sotres, F., 2000. Limitation of soil enzymes as indicators of soil pollution. Soil Biol. Biochem. 32: 1867-1875. [ Links ]
Villena, M.A., Iranzo, J.F.U., & Pérez, A.I.B., 2007. β - Glucosidase activity in wine yeasts: Application in enology. Enzyme Microb. Technol. 40. 420-425. [ Links ]
Walkley, A. & Black. I.A., 1934. An examination of Degtjareff method for determining soil organic matter and a proposed modification of the chronic acid titration method. Soil Sci. 37, 29-37. [ Links ]
Wooldridge, J., 1988. The potassium supplying power of certain virgin upland soils of the Western Cape. M.Sc. Thesis, Stellenbosch University, Private Bag X1, 7602, Matieland (Stellenbosch), South Africa. [ Links ]
Submitted for publication: July 2020
Accepted for publication: October 2020
* Corresponding author: E-mail address: vhuyssteeni@arc.agric.za
Declaration of competing interests: The authors declare that they have no known competing financial interests or personal relationships that could have influenced the work reported in this paper.
Acknowledgements: The authors wish to thank the staff of Soil and Water Science at ARC Infruitec-Nietvoorbij for technical support and, in particular, Mr. Francois Baron for his dedicated inputs.
FUNDING: The research project was initiated, managed and funded by the Water Research Commission (WRC) and co-funded by Winetech, THRIP (TP1208066038) and the Agricultural Research Council. Any opinions, findings and conclusions or recommendations expressed in any publication generated through THRIP-supported research, are those of the authors and therefore the NRF/THRIP will not accept any liability in that regard. The findings in this publication forms part of NRF project CSRP170524232644 for validation of the AI3 as soil health index in vineyards.

