


Services on Demand
Article
 English (pdf)
 Article in xml format
 Article references
Indicators

Related links
-
 Cited by Google
 -
 Similars in Google
Share

 Permalink
South African Journal of Enology and Viticulture
On-line version ISSN 2224-7904
Print version ISSN 0253-939X
S. Afr. J. Enol. Vitic. vol.41 n.2 Stellenbosch 2020
http://dx.doi.org/10.21548/41-2-4018
ARTICLES
Investigating the Concept of South African Old Vine Chenin Blanc
M. Mafata; J. Brand; V. Panzeri; A. Buica*
South African Grape and Wine Research Institute, Stellenbosch University, Private Bag X1, Matieland, 7602, South Africa
ABSTRACT
Although South African vineyards are still young by European standards, there is a belief in the industry that vines aged 35 or more years produce grapes and wines with specific characteristics ("old vine wines"). The aim of this study was to investigate the existence of the concept of old vine Chenin blanc wines using a typicality rating and sorting tasks. Chenin blanc wines were made from grapes harvested from vines aged five to 45 years old. Winemaking was standardised, with no wood contact. Typicality rating and sorting tasks were performed on young (first-stage) and two-year bottle-aged (second-stage) wines. Principal component analysis (PCA) on rating data demonstrated judge consensus, but no correlation was found between vine age and typicality rating. Sorting results were submitted to agglomerative hierarchical clustering (AHC) performed on the correspondence analysis (CA) and multidimensional scaling (MDS) results for grouping and attributes resulting from the sorting task. The clusters were different for the young wines and two-year bottle-aged wines. The verbal aspect of the sorting demonstrated the judges' agreement on the concept of old vine Chenin blanc, shown by the annotation of the old vine group as 'complex', 'balance', 'rich' and 'good mouthfeel'. However, because the judges did not sort the wines according to vine age, the perceptual aspect of the concept could not be confirmed, its features could not be tested further, and the sensory space could not be built.
Keywords: Typicality, Chenin blanc wine, old vine character, rating, sorting
INTRODUCTION
In comparison to the long history of European and Middle Eastern vines (Stevenson, 2005), South African vineyards are young, with the first vines planted in the 17th century. According to recent statistics, 64% of the Chenin blanc planted (by area under vine) is less than 20 years old and 36% is older than 20 years (SAWIS, 2018). The "old vine" designation has been used as a heritage mark to support the conservation of these vines and was established by the South African Old Vine Project (OVP) in 2017. The OVP demarked South African "old vines" as being 35 years or older, based on information gathered from years of collaborative input from industry experts, including viticulturists and winemakers (Crous, 2016).
Old vines (vineyards, grapes and wines) tend to receive special treatment with regard to viticultural and winemaking practices, documented by several surveys and interviews with industry experts. This special treatment is actively encouraged by the OVP, as it is believed that it will harness the full potential of the old vine and impart the character to the resulting wine. Some of the guidelines include a "holistic approach to weed control", "movement from inorganic fertilisers to organic fertilisers", "a minimalistic approach towards winemaking" for the wines to "be given the chance to reflect their specific terroir", etc. (Old Vine Project [OVP], n.d.). Worldwide, it has been shown that any special treatment of a product (wine or other foodstuff) creates an emotional attachment to the product, along with expectations (Schouteten et al., 2015; Niimi et al., 2019).
The agreement among experts, which is reinforced through the OVP and its experience, is that old vine wines are less intense in fruity attributes but have more complex sensory attributes focused on mouthfeel; additionally, the full potential of the wine is reached after some years in the bottle, with the wines not being released in the harvest year (SASEV, 2018). Anecdotal evidence collected by the authors concerning old vine character (SASEV 2018) has created an interest in substantiating these ideas. In defining and testing the concept of "old vine character", evidence needs to be collected and hypotheses have to be formulated and tested.
Currently, there is little scientific support for the anecdotal evidence, as only one study profiled 16 Chenin blanc wines from vines older than 40 years using descriptive analysis (Crous, 2016). The study evaluated multiple sensory modalities, namely odour and in-mouth sensations, with a focus on mouthfeel. It also used calibrated standards and, where standards were not available, conceptual consensus was established based on discussions among judges. The reasoning for the mouthfeel approach was based on the anecdotal evidence mentioned above (OVP, n.d.; SASEV, 2018) . In the work by Crous (2016), when panellists described old vine Chenin blanc wines, the terms body, concentration, complexity, length, acidity, heat, balance and integration featured prominently. Since the samples were commercial wines made using different protocols, Crous (2016) noted that the effects of winemaking outweighed any possible correlations with the vine age.
One approach to studying old vine character is through establishing its associated typicality features. Wine typicality refers to a group of sensory attributes that, together, become the defining features describing a concept; typicality may be categorised under cultivar, winemaking style, regionality (appellation) or, in this case, old vine character. In this context, typicality is defined as the level (or "degree of representativeness") of a sample to a category, measured against a prototype (Chrea et al., 2005). In the case of a sensory concept, the prototypes or "established references" (Perrin & Pages, 2009) can be different for each assessor due to differences in experience and exposure; hence, typicality judgments may differ among experts. Consistency among assessors suggests the homogeneity of the prototypes, or even the existence of a common prototype and possible conditions for demonstrating a typicality concept (Casabianca et al., 2006). In practice, it was demonstrated that wines that are less representative of the prototype belong to neighbouring categories (Perrin & Pages, 2009) and it is possible for instances of borders between categories to arise (Ballester et al., 2005).
There are four stages to testing concepts of typicality and, according to the methodology proposed by Perrin and Pages (2009), these have to be followed in sequence. Firstly, panel agreement has to be established, followed by conceptual agreement, perceptual agreement and, finally, measuring the feature/drivers can be considered. Each step is dependent on the previous one. If at any point agreement is not achieved, the investigation cannot be continued and the methods or panels have to be revisited.
Typicality can be investigated sensorially in different ways using verbal and/or non-verbal methods (Perrin & Pages, 2009). The reasoning behind this is that the differences between wines considered to be most and least representative of the concept under investigation should manifest both intuitively (as seen in non-verbal methods) and through verbal cues. It is important to understand when to use which type of method (verbal, non-verbal or a combination), how to choose the mode of assessment (gustatory, olfactory or global) and which type of panel to use (experts or trained). Elements to consider when making these decisions are whether or not the concept has been well established previously, whether there are known features that contribute to the concept, and whether these features have standards that can be used for calibration (Perrin & Pages, 2009).
Verbal methods used for typicality studies include descriptive analysis (DA) for the colour of Provence Rosé wines (Coulon-Leroy et al., 2018) and check all that apply (CATA) for the minerality of Burgundy Chardonnay (Ballester et al., 2013). Non-verbal methods include sorting for demonstrating the existence of a Chardonnay wine concept (Ballester et al., 2005), typicality and hedonic rating for minerality in French vs New Zealand Sauvignon blanc (Parr et al., 2015), and other various combinations.
As mentioned previously, the evaluation can be used to investigate the contributions of the features to the concept through gustatory, olfactory or global assessment. Studies have found the differences in the success of the mode of assessment to be based on the dominant features related to the concept. If, for example, the prominent features are known to manifest in the aroma, then the assessment will be on the olfactory stimuli. If, however, a concept has not previously been annotated with features, then a global assessment is used. This type of systematic investigation is illustrated by Ballester et al. (2008) in testing the concept of Chardonnay by both expert and consumer panels. The study found a clear distinction between Chardonnay wines and Melon de Bourgogne (used as a non-Chardonnay example to establish the borders of the concept) by an expert panel. The borders of representativeness were then tested in two ways using rating (to look at the degree of representativeness) and sorting (to look at the membership in the designated groups).
The use of trained and expert panels has also been investigated in the literature. If a concept has features that can be calibrated for using standards and/or definitions, a trained panel may be used (Ballester et al., 2008). Concepts that include features that could not be calibrated, and thus rely on experience, favour expert panels. In this case, it is possible that the conceptual agreement when defining terms and the perceptual agreement when consistently assessing the features in wine are not unified, as was the case with the minerality of Burgundy Chardonnay (Ballester et al., 2013); although the investigation achieved both panel consensus and conceptual agreement on minerality, perceptual agreement could not be reached and hence the features could not be verified.
In this context, the aim of the current study was to investigate the concept of old vine Chenin blanc using typicality rating, sorting, and free word association. Compared to the previous study by Crous (2016), in which the intrinsic features of each wine were measured by DA using a bottom-up approach that is experimentally directed (Lindsay & Norman, 1977), the current work proposes a top-down approach in which the understanding of the concept is first developed before trying to measure its features (Lindsay & Norman, 1977; Brochet & Dubourdieu, 2001). A combination of non-verbal (rating and sorting) and verbal (the added annotation of sensory attributes in the sorting exercise) methods was used. The sensory panel was constituted of industry professionals. Since the previous study noted the potential influence of winemaking (Crous, 2016), the same winemaking protocol was used in this study for all the grapes sourced from vineyards aged five to 44 years. In addition, the wines were evaluated young (first evaluation stage approximately three months after bottling) and after two years of ageing in the bottle (second evaluation stage).
MATERIALS AND METHODS
Grape sources and winemaking
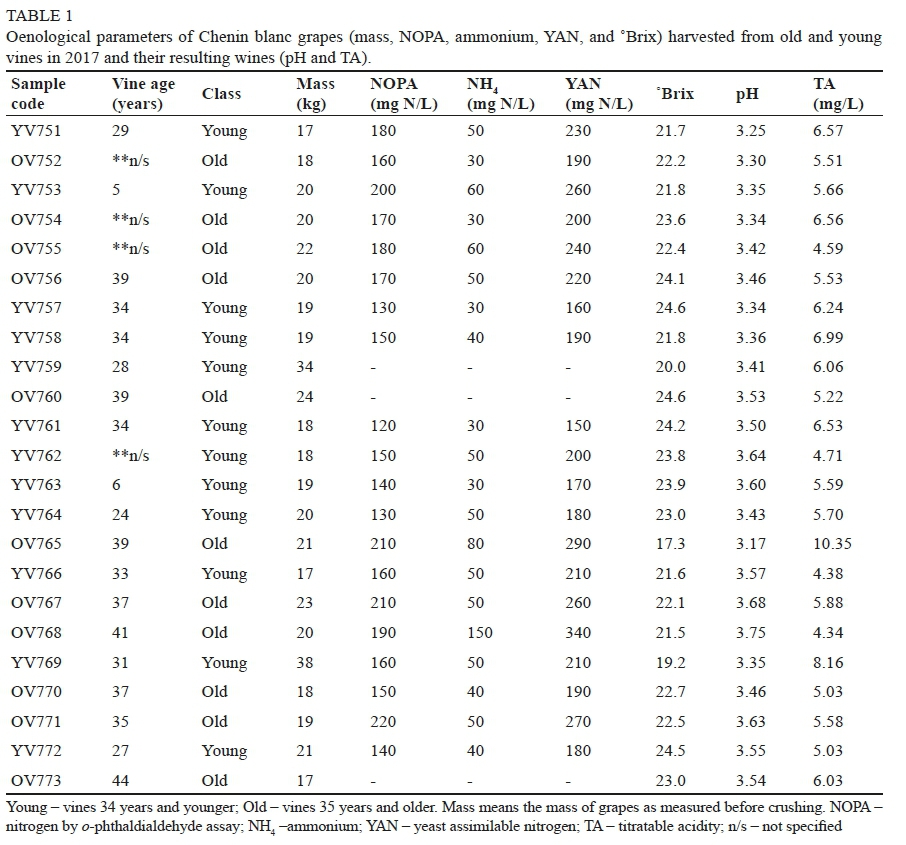
Chenin blanc grapes were sourced from 23 vineyards across the Western Cape province of South Africa. Grapes were harvested in 2017 at commercial maturity according to the growers, ranging from 23°Brix to 25°Brix, with two exceptions at 17.3°Brix (sample 765) and 19.2°Brix (sample 769). Twelve young vines (< 35 years old) and 11 old vines (> 35 years old) were included in the project; vine ages ranged from five to 45 years. Grapes were treated with 30 mg/L sulphur dioxide (SO2) at crushing. The juice was settled overnight at 4°C, racked and allowed to come to room temperature. Juice was inoculated with Vin7 yeast (Zymasil, AEB Group SpA, Bologna, Italy) according to the manufacturer's instructions. The fermentation was allowed to proceed in a temperature-controlled room at 15°C to 18°C. The SO2 levels were adjusted to 50 mg/L post-alcoholic fermentation, and 50 mg/L bentonite was added before cold stabilisation, which took place over two weeks at -4°C. The wine was then racked and bottled without filtration in 750 mL screw cap green bottles (Consol, South Africa). The wines were stored in the vinoteque under controlled temperature and humidity conditions until their evaluation: first as young wines (three months after bottling), then as bottle-aged wines (two years after bottling). Grape juice and wine oenological parameters (Table 1) were measured on a Metrohm 862 compact titrosampler (Herisau, Switzerland) using chemicals (sodium hydroxide, potassium iodide/ potassium iodate and sodium thiosulfate) purchased from Cameron Chemical Consultants (Cape Town, South Africa).
Sensory evaluation
The approach used in this study is based on the methodology published by Ballester et al. (2008). The analysis was performed in a quiet, well-ventilated and odour-free room with the temperature set at 20 ± 2°C. Samples were presented in black ISO glasses, covered with a Petri dish and labelled with a three-digit code. Samples were randomised across judges prior to analysis according to a William's Latin square design. An expert panel of 32 judges in 2018 and 14 in 2019 assessed the 23 wines; the judges were industry professionals with more than five years' experience in the production and evaluation of old vine Chenin blanc. The experimental design was done using Compusense cloud (Compusense, Guelph, Canada).
Two sensory tasks, namely rating and sorting (Valentin et al., 2012), were performed in one session with a 15-minute break and a free word association exercise between them. The first task was a typicality rating on a 100 mm unstructured line scale, ranging from "very bad example" anchored at 0 to "very good example" anchored at 100 (Garrido-Banuelos et al., 2020) and samples were presented monadically. The experts were instructed to rate each sample on the scale according to their judgement for an old vine Chenin blanc wine. Before beginning the second task, judges were asked to list three to five words that came to mind when "typical old vine Chenin Blanc wine" was mentioned. The second task was a flexible sorting exercise with all 23 wines presented at once. This was considered a flexible sorting since the judges were instructed to sort the wines into two groups, namely "young vine CB" or "old vine CB", but they were allowed to create a third group if the samples did not fit either of the two groups. Judges were also asked to give three to five attributes associated with each group. The terms generated during the sorting task were consolidated based on their semantic and synonymous relationship by agreement among the researchers.
Statistical analysis
Rating data was captured as a judge vs wines correlation matrix. Principal component analysis (PCA) was performed on the correlation matrix to evaluate judge consensus (Perrin & Pages, 2009). The data was averaged over the judges and PCA was performed on the resulting correlation matrix to investigate correlations between the different wines (Perrin & Pages, 2009). Data groupings on the basis of the sorting were captured as a co-occurrence matrix and the attributes used to describe the groups were captured as a correlation matrix of wines and attributes. Multidimensional scaling (MDS) was performed on the co-occurrence matrix and correspondence analysis (CA) on the correlation matrix (Salkind, 2012). Regression vector (RV) coefficients were calculated among the CA and MDS biplot co-ordinates for each year, and between the young and the two-year bottle-aged wines (Abdi, 2007). Unweighted pair-average agglomerative hierarchical clustering (AHC), using a similarity-based, Pearson correlation coefficient, was performed on the MDS and on the CA for both the wines' and the attributes' correlation matrices. Statistical analyses were performed in ZLSTAT2018 (Addinsoft, Paris, France).
RESULTS
Judge consensus
In order to evaluate panel consensus, PCAs were conducted on the rating scores for both the young and bottle-aged wines (Fig. 1). The results for the young wines show a cumulative explained variance of 16% for the first three dimensions. Full explained variance (100%) was achieved over 22 dimensions, with all dimensions contributing almost equally (from PC1 with 5.8% to PC22 with 3.7%). Results from the bottle-aged wines showed a cumulative explained variance of 17% for the first three dimensions of the PCA, with the full explained variance being achieved over 21 dimensions (from PC1 with 6.1% to PC21 with 3.7%).

Although the cumulative explained variance for both years of the evaluation was less than 20% for the first three dimensions (Fig. 1), the linear correlation across the first dimension was an indicator of good consensus between the judges. The correlation between judges varied linearly along the first dimension, with judges 12 and 24 being the exception for the first evaluation stage (young wines) and judge 10 for the second (bottle aged). The judges who were not in consensus with the rest of the panel were not excluded from further analyses, because they were within the 95% confidence interval and thus not statistical outliers.
Non-verbal typicality assessments Typicality rating
In order to see if there was a correlation between vine age and the typicality rating, the average scores per sample were plotted against the vine age. If the old vine concept was to be observed, the old vine wines should have been rated higher on the typicality scale than the young vine wines, according to their degree of representativeness of the concept. This was not the case, as linear regression analysis showed no correlation between the average rating score and the vine age for either young wines or bottle-aged wines.
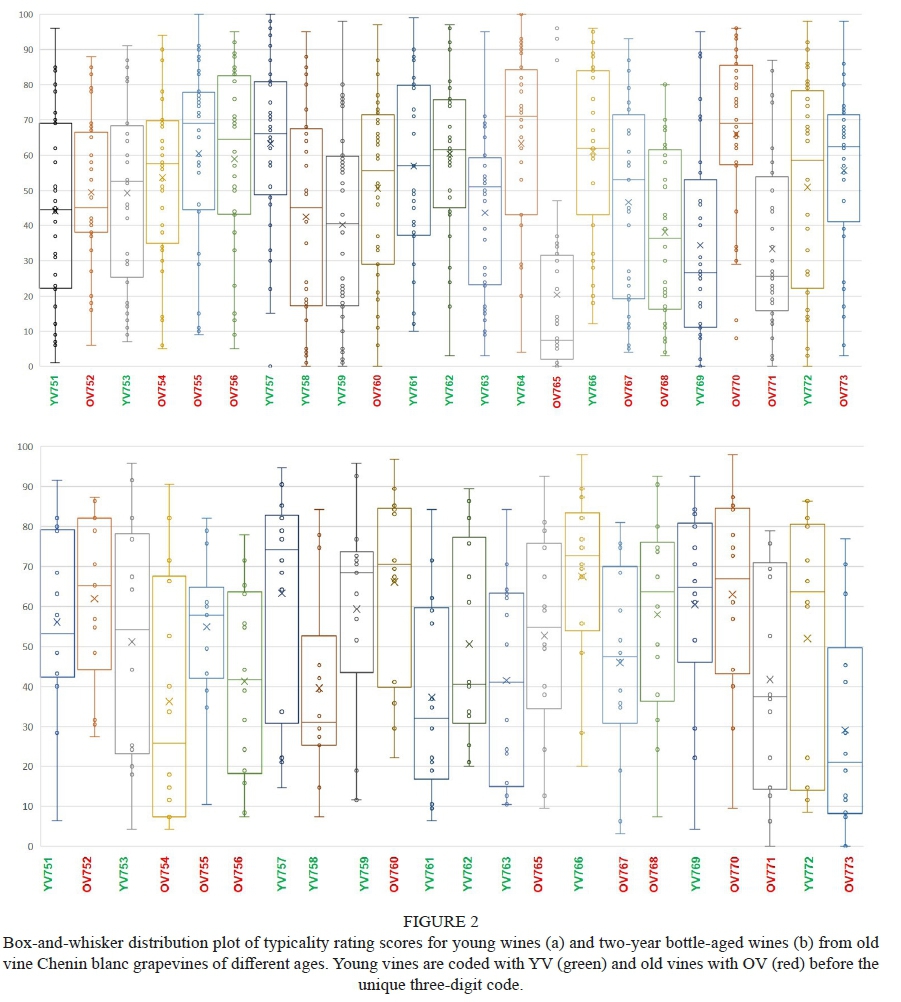
The results for both evaluation stages show a wide distribution of the average typicality scores. Judges used the entire scale (from 0 to 100), with the average scores ranging from 20 to 66 for young wines and 29 to 67 for bottle-aged wines. This result indicates that the judges did not have a unified perception of the wine typicality with regard to the old vine status. Statistically, the score distribution of each sample was not always normal, as some samples had a bimodal distribution whereas others had a random distribution (Fig. 2). For young wines, the wine rated the lowest was OV765, which was made from a 39-year-old vine. Surprisingly, the wine made from the oldest vines (OV773, 44 years old) and youngest vines (YV753, five years old) were rated similarly (56 and 49 for OV773 and YV753, respectively). For bottle-aged wines (second stage), the sample with the lowest rating was the wine from the oldest vines in the set, OV773, which was rated even lower than the wine made from the youngest vines in the sample group (YV753, five-year-old vines).
In order to investigate any relationship between the two years' results, the average scores for each year were plotted against each other. The regression coefficient (R2 = 0.5852) indicated only a trend between the young and bottle-aged wines. This means that any changes that occurred during ageing could neither be correlated with vine ageing nor typicality rating. Given the random distribution of samples, no borders could be imposed based on vine age, and thus no classifications could be made according to age. This means that there was no perceptual agreement between judges when it came to old vine South African Chenin blanc typicality as measured by the rating task.
Multidimensional scaling (MDS) on typicality sorting data
The second non-verbal assessment of the typicality of old vine Chenin Blanc wine was the sorting task. Unlike the rating task, in which the presentation of the samples is monadic, in this second task wines were judged together and grouped according to their similarity under the groups old vine and young vine.
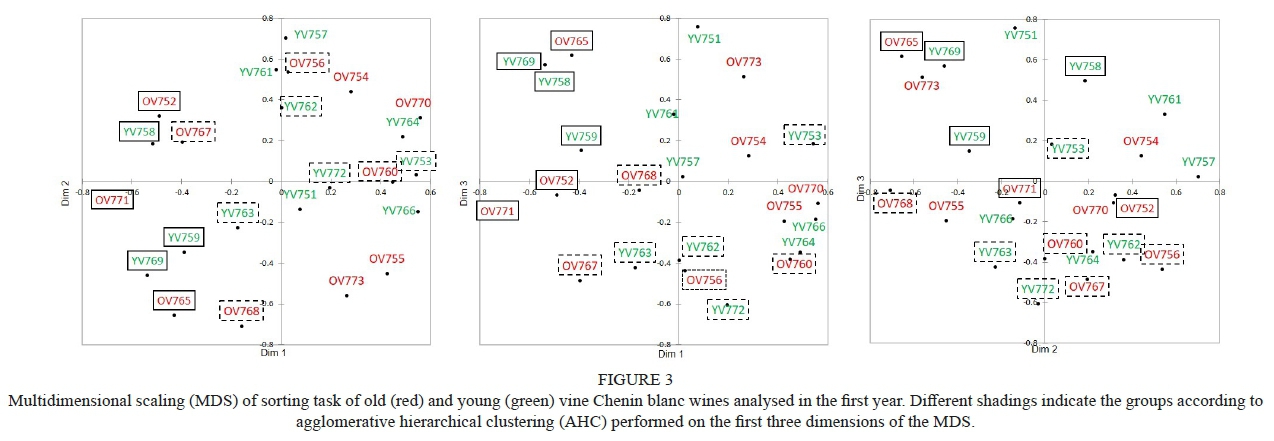
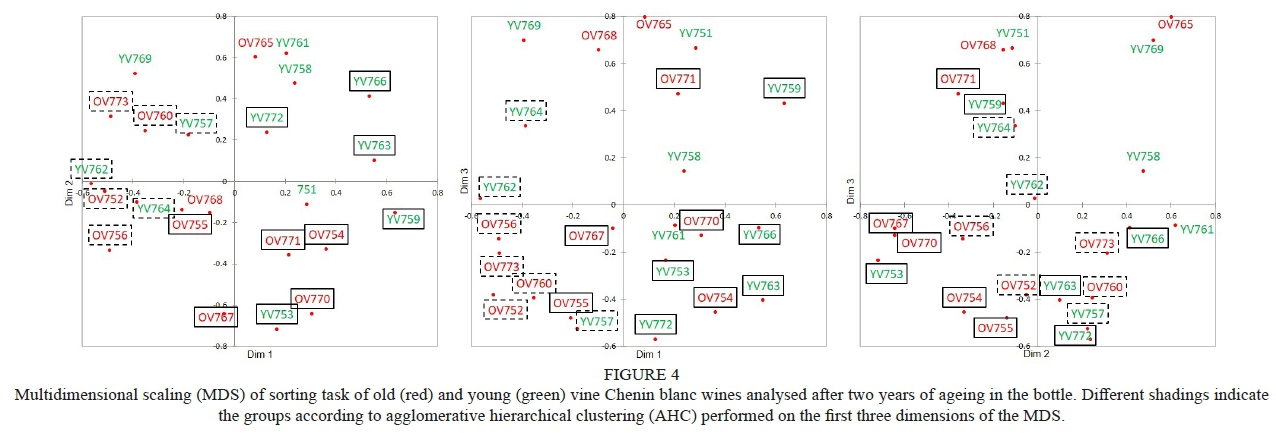
The first three dimensions of the MDS were considered enough for assessing significant relationships between samples based on Kruskral's stress indices (results not shown) for both evaluation stages (young wines and two-year bottle-aged wines). MDS and agglomerative hierarchical clustering (AHC) were then performed on the first three dimensions, and the results are shown in Figs 3 and 4 for the two evaluation stages.
Cluster analysis of the MDS gave three main clusters and showed no grouping of samples according to vine age for either evaluation stage. The wine from the oldest vine (wine OV773, 44-year-old vine) and the youngest vine (YV753, five-year-old vine) were in two separate clusters. For both stages, the distribution within each cluster was random, the distances between the members of each cluster (i.e. samples or branches) was also random and not related to vine age. It can be concluded that clustering was related to neither the categories "old vine"/"young vine" nor to any observable trends according to vine age.
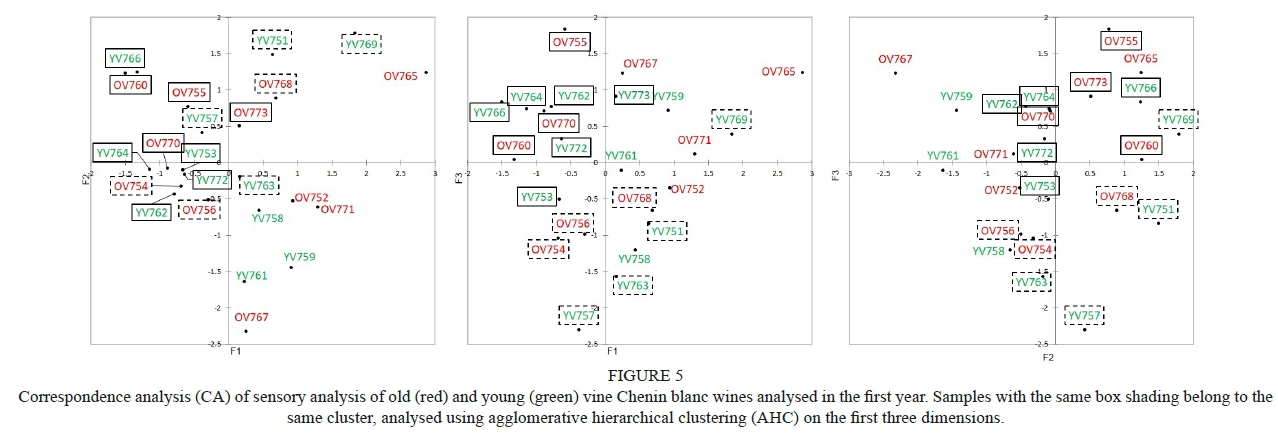
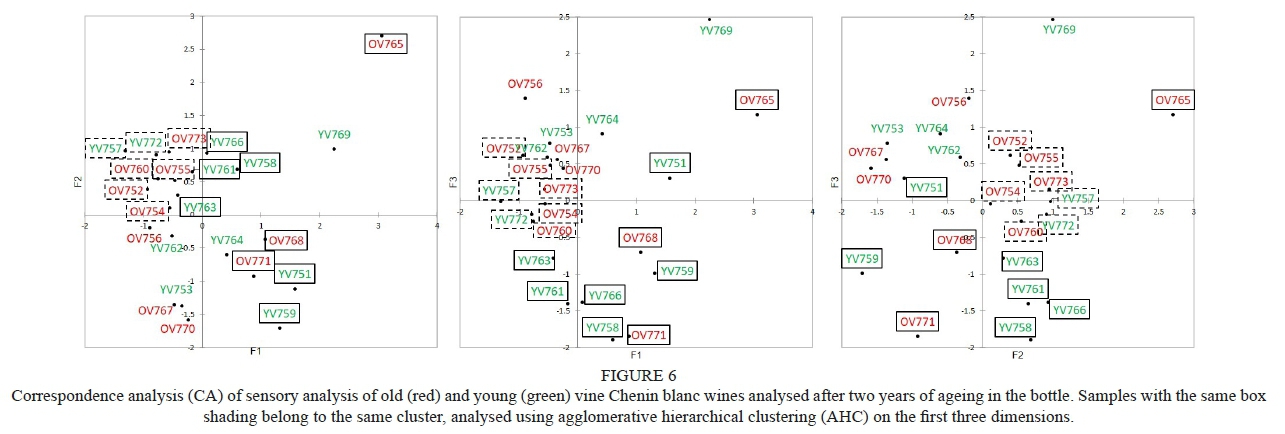
Correspondence analysis (CA) on typicality sorting
Correspondence analysis of the sorting data provided a biplot that showed the correlation between samples (presented in this section) and between attributes (presented under Verbal assessments below).
CA showed the distribution of the total inertia (0.327 and 0.494 for the first and second evaluation stage, respectively) over 22 and 21 dimensions, respectively. The first three dimensions had cumulative percentages of 61% and 64% of the inertia respectively for the two stages. AHC was done only on these first three dimensions (Figs 5 and 6). Three clusters were formed in each case; the clusters contained samples from different vine ages. The clustering of samples was related neither to the "old vine"/"young vine" categories, nor to vine age. Unlike in the MDS, the wine from the oldest vines (OV773, 44 years old) and the wine from the youngest vines (YV753, five years old) belonged to the same cluster for the first evaluation stage and to the same cluster for the second.
Comparison of sample configurations
RV coefficients were calculated in order to assess any differences or similarities between sample configurations generated in the two stages through MDS and CA. The comparison was two-fold: within a stage, MDS to CA, and between the stages, CA to CA and MDS to MDS configurations. The data captured from the rating task also generated one PCA for each evaluation stage that contained sample configurations. However, as one of the samples was not included in the second-stage evaluation, RV coefficients could not be calculated for the rating results.
MDS and CA plots were generated for the verbal and non-verbal aspects of the sorting data. The main difference in these analyses is that the MDS relies only on the associations between samples, whereas the CA uses the attributes to generate the correlation between samples. Since these were done within one task, although looking at different aspects, they should result in a similar relationship between samples. As such, RV coefficients were used to measure the configurational similarity between the CA and MDS plots.
For sorting, the results for young wines showed CA vs MDS RV coefficients of 0.68 and 0.60 for the first two and three dimensions, respectively. The second stage (bottle-aged wines) results showed CA vs MDS RV coefficients of 0.68 and 0.71 for the first two and three dimensions, respectively. Looking at correlations between the two years of evaluation, RV coefficient were calculated for MDS vs MDS (0.37 and 0.34, first two and three dimensions, respectively) and CA vs CA (0.47 and 0.39, first two and three dimensions, respectively). These values were low, meaning that the samples were sorted differently for the different evaluation stages. Although three clusters were formed for both the evaluation stages, the members belonging to each of the clusters were different.
Looking for any similarity between the two datasets (rating and sorting), the configurational space was assessed using RV coefficients. The wine samples were considered observations in the rating data and modelled by PCA; the resulting configuration was used to generate the RV coefficients against the CA and MDS results.
In the case of the evaluation of the young wine, the results showed poor correlation between the configurations for rating by PCA and sorting by MDS (first two dimensions, RV = 0.44; first three dimensions, RV = 0.41) and between rating by PCA and sorting by CA (first two dimensions, RV = 0.52; first three dimensions, RV = 0.474). This could be because of the non-normal distribution of the rating scores for each sample, as discussed above. The membership of the same sample to different groups (young vine and old vine) in the sorting could also contribute to the differences in configurations (i.e. low RV coefficient values). Since sample 764 was excluded from the rating of the bottle-aged wines, the RV coefficients for the second evaluation stage could not be calculated.
Verbal assessment of typicality
Verbal aspects of the sorting task
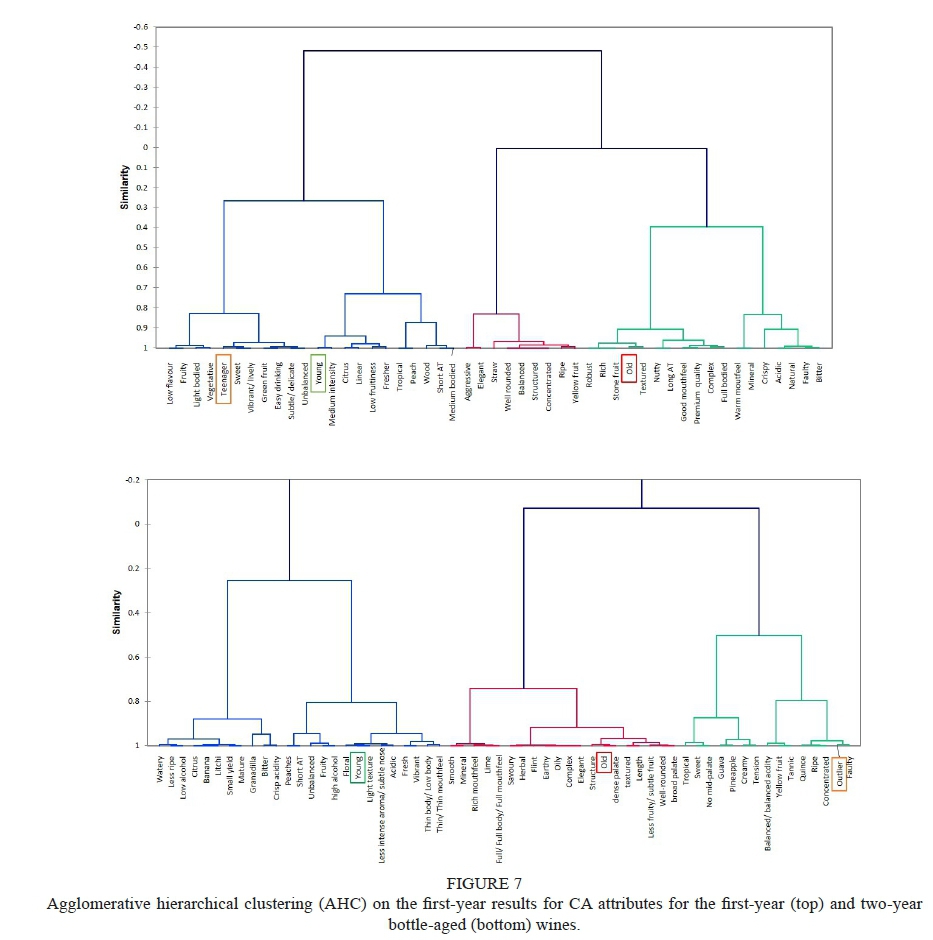
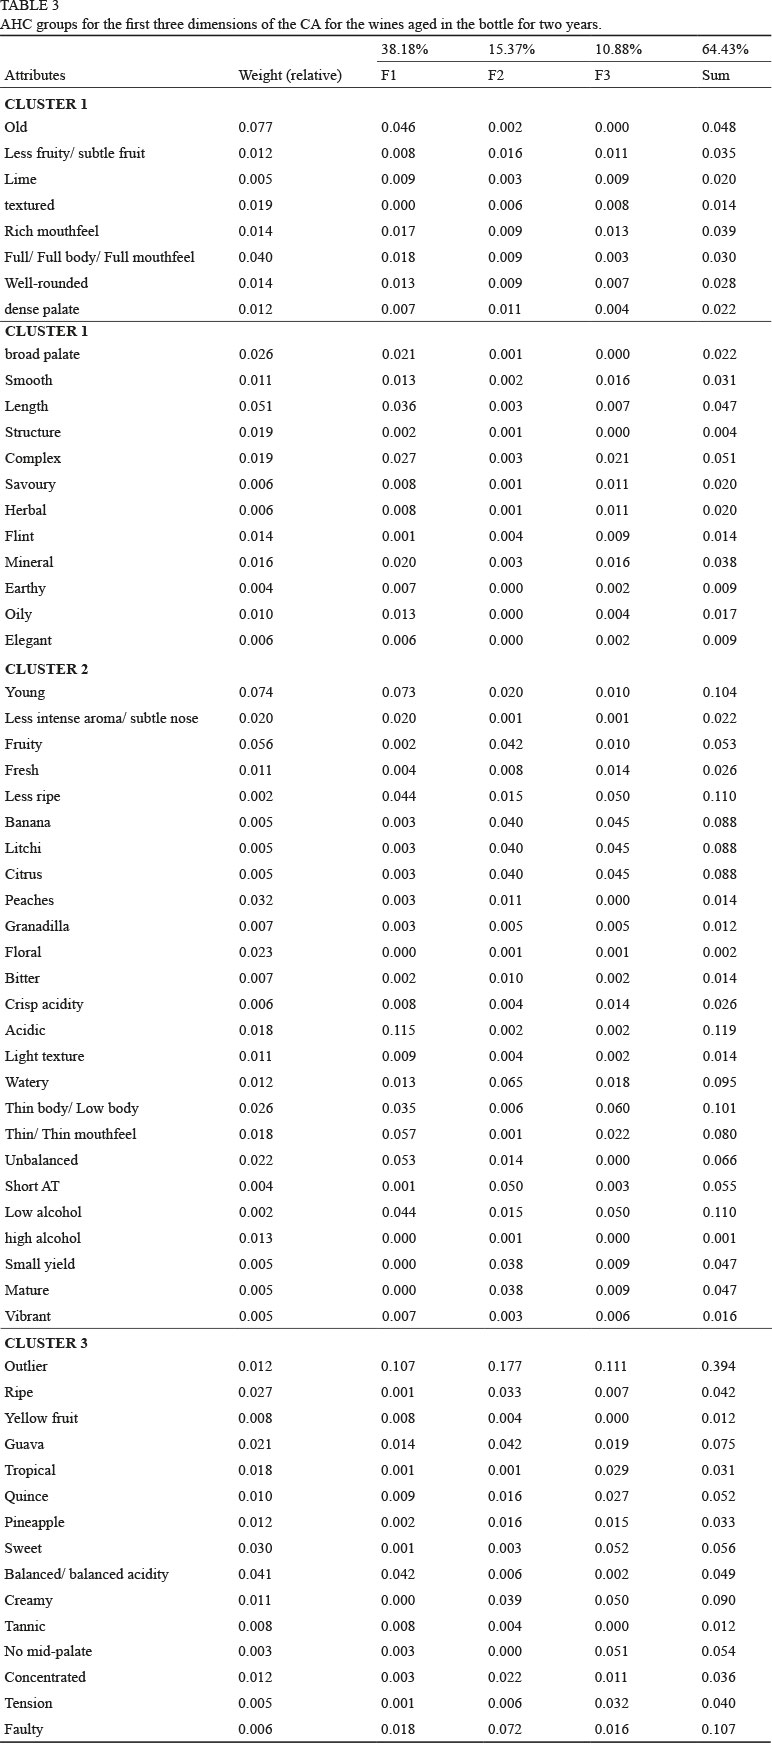
The sorting resulted in three groups for both the young wines and the two-year bottle-aged wines. The groups young vine and old vine were allocated to them, but the judges collectively generated the teenager and outlier group identities for the first and second evaluation stages, respectively. The consolidation of attributes resulted in 46 terms for young wines and 68 for bottle-aged wines, which were used to generate the CA. The first three dimensions of the CA contained 61% and 64% of the explained variance for the two evaluation stages, respectively. AHC done on the three-dimensional space resulted in the formation of two main clusters (Fig. 7). The members of each cluster, their weight and their contributions to the explained variance in the first three dimensions are listed in Tables 2 and 3. The old vine cluster had associated terms that are mouthfeel-related and support the findings of Crous (2016). Some examples are 'robust', 'texture, 'good mouthfeel' and 'complex' for the young wines, and 'structure', 'dense palate', 'texture' and 'rich mouthfeel' for the bottle-aged wines.
DISCUSSION
The original idea of the project was to explore the sensory space typical of the OV Chenin blanc wines. As required by the methodology used when testing a typicality concept, the process was laid out in steps in such a way that multiple checks were put in place. The systematic approach taken in establishing and understanding an oenological concept requires a reliable panel (judge consensus), as well as conceptual and perceptual agreement (Perrin & Pages, 2009; Maitre et al., 2010). The establishment of a sensory space unique to a concept (in this case the OV Chenin blanc) would constitute the final step in the process, which can be reached only once all the previous stages have been demonstrated.
In the current study, the panel agreement was proven from the rating results, even if the explained variance was distributed almost equally over a large number of dimensions. Scalar data with a single measurement has an approximately equal distribution of the explained variance across the multiple dimensions of the PCA; in other words, all dimensions have an almost equal input into the distribution of data (Granato & Ares, 2014), as observed for the results of the current work. Conversely, even if the explained variance is high, the experiment stops if panel consensus is not reached. This was the case in the study by Ballester et al. (2013), in which no correlations were observed in the agreement between judges assessed by PCA; in that case, there was no consensus and the investigation did not proceed further.
Only after the reliability of the panel was confirmed could the perceptual agreement be tested. The borders of the perceptual agreement can be gradual, referred to as the "degree of representativeness", and are tested using rating tasks (Ballester et al., 2005; Chrea et al., 2005). These borders can also be categorical, referred to as membership in the concept group, and are tested using sorting (Ballester et al., 2005). This means that the samples selected to test the concept need to cover the range of representativeness, including their borders (Ballester et al., 2005; Chrea et al., 2005).
The focus of a sorting task is the grouping of samples according to the given criteria (Valentin et al., 2012), in this case old vine/young vine. The instruction to describe the groups provided a secondary (verbal) aspect to the task. The flexible sorting task, as designed in this study, had both bottom-up and top-down elements to it (Lindsay & Norman, 1977; Brochet & Dubourdieu, 2001). To decide whether a sample belonged to the old vine group, a judge had to think first of the characteristics that qualify the sample for that category (top-down thinking). To describe the group based on the samples included, the judge had to consider the attributes of the wines themselves (bottom-up thinking).
Since these two aspects are intertwined, both the grouping and the descriptors were used to give an indication of the conceptual space related to old vine Chenin blanc typicality. The values of the RV coefficients supported the hypothesis that the verbal and non-verbal aspects of the sorting task were in agreement.
In line with the idea related to the origin of the old vine character coming from the grapes, this study covered sample variability in terms of vine age, but limited variability from a winemaking perspective. The wines were tested as young and bottle aged. Although the same number of clusters resulted from the analysis of the sorting results for both evaluation stages, the members belonging to each of the clusters were different. Using vine age as the single source of variability may have resulted in wines being too similar to each other for the judges to be able to distinguish between them. Unlike in this study, the previous study by Crous (2016) included variability in winemaking, but not in vine age. This may have created a greater variability between the wine samples but, as often seen, highly involved winemaking practices may outweigh other factors (in this case, vine age).
Conceptually, the experts agreed on the attributes associated with the OV concept. Perceptually, the experts could not agree on a set of wines whose only variable was vine age. At this point, the process could not be taken further.
It is only once the perceptual agreement and the borders are elucidated that the attributes associated with the concept can be tested (Perrin & Pages, 2009). This would have resulted in building and describing a sensory space unique to OV Chenin blanc wines. The correct samples have to be consistently associated with the attributes in order for them to be considered features of the tested concept. This was not the case in the current study, where the last stage in the investigation could not be carried out due to the lack of perceptual agreement. As such, the features and the drivers of the concept could not be identified. In addition to the possible lack of variation in the resulting wines coming from a standardised winemaking, one other possible cause for the lack of perceptual agreement could be linked to the "expertise" and "exposure" factors related to the expert judges, factors highlighted in the literature in similar cases of testing complex concepts (Chrea et al., 2005; Perrin & Pages, 2009). Even though the industry professionals participating in this experiment were experts in the topic, their reference (or "prototype", as described by Chrea et al. (2005)) most probably was built on repetitive exposure to a variety of old vine wines, with common but also very different characters. This aspect is one of the most difficult ones in relation to ensuring consistency in concepts, in contrast to attributes or features for which the researchers can use standards and calibrate analytical panels or even experts.
Previous studies have used predictive models, such as partial least squares (PLS) (Coulon-Leroy et al., 2018) and multiple linear regression (MLR) (Ballester et al., 2005; Parr et al., 2015), to explore the relationship between the rating and sorting data in the case of typicality. These models work when there is both panel consensus and perceptual consensus, so that the features of the typicality concept can be correlated or predicted. Since perceptual agreement on vine age or the categories of old vine/young vine was not reached in the current study, predictive or linear regressions could not be used.
CONCLUSIONS
The South African old vine Chenin blanc typicality was tested perceptually and conceptually. The perception of a Chenin blanc wine as having "old vine character" was evaluated using a typicality rating and a flexible sorting task. The conceptual understanding of old vine Chenin blanc was investigated by allowing judges to describe the old vine and young vine sorted groups.
As shown by the results, a unique sensory space of the OV Chenin blanc could not be demonstrated because the results indicated a lack of perceptual consensus among the industry professionals during the sorting task. However, the industry professionals did demonstrate a conceptual alignment/ agreement, as demonstrated by the rating results, which was the foundation on which the rest of the work was built.
If similar work were to be repeated with commercial wines (from YV and OV), the existence of a unique sensory space of commercial OV wines could be demonstrated. However, such an experiment would still not answer the question: where is this character coming from? Researchers could get closer to answering the question by finding the features/drivers of the concept and maybe backtrack them to the origin. However, the source of the OV character could be multiple - interactions between the vineyard conditions, winemaking techniques, and vineyard and cellar flora. Even if experiments were to be designed around these factors, excluding them one by one, the interaction aspect would be lost.
The sensory space characteristic of OV Chenin blanc wines can also be re-created by better understanding the opinions of the wine industry professionals. Qualitative approaches such as interviews and surveys would be insightful.
These results show that, conceptually, the experts agreed on the attributes of old vine Chenin blanc wines, although they could not align perceptually. Since variability in winemaking was factored out, the unique properties gained by the wine during winemaking and the inclusion of viticultural and microbiome elements (wild fermentations) have been lost. However, if the guidelines of the OVP to take the minimalistic approach are to be followed, it is put into perspective how the various approaches taken in winemaking practices influence the final product.
Abbreviations:
RV (regression vector); PCA (principal component analysis);
MDS (multidimensional scaling); CA (correspondence analysis);
AHC (agglomerative hierarchical clustering); DA (descriptive analysis);
CATA (check all that apply)
REFERENCES
Abdi, H., 2007. RV coefficient and congruence coefficient. In Salkind, N. (Ed.): Encyclopedia of Measurement and Statistics. Thousand Oaks, CA, Sage. 1 - 10. [ Links ]
Ballester, J., Dacremont, C., Le Fur, Y. & Etievant, P., 2005. The role of olfaction in the elaboration and use of the Chardonnay wine concept. Food Qual. Prefer. 16, 351-359. [ Links ]
Ballester, J., Mihnea, M., Peyron, D. & Valentin, D., 2013. Exploring minerality of Burgundy Chardonnay wines: A sensory approach with wine experts and trained panellists. Aust. J. Grape Wine Res. 19(2), 140-152. [ Links ]
Ballester, J., Patris, B., Symoneaux, R. & Valentin, D., 2008. Conceptual vs. perceptual wine spaces: Does expertise matter? Food Qual. Prefer. 19(3), 267-276. [ Links ]
Brochet, F. & Dubourdieu, D., 2001. Wine descriptive language supports cognitive specificity of chemical senses. Brain Lang. 77, 187-196. [ Links ]
Casabianca, F., Sylvander, B., Noël, Y., Béranger, C., Coulon, J.-B., Giraud, G., Flutet, G., Roncin, F. & Vincent, E., 2006. Terroir et Typicité: proposition de definitions pour deux notions essentielles â l'appréhention des Indications Géographiques et du dévelopement durable. In: VIth Int. Terroir Congr. Vol. 1, 544-551. [ Links ]
Chrea, C., Valentin, D., Sulmont-Rossé, C., Nguyen, D.H. & Abdi, H., 2005. Semantic, typicality and odor representation: A cross-cultural study. Chem. Senses 30(1), 37-49. [ Links ]
Coulon-Leroy, C., Poulzagues, N., Cayla, L., Symoneaux, R. & Masson, G., 2018. Is the typicality of "Provence Rosé wines" only a matter of color? Oeno One 52(4), 1-15. [ Links ]
Crous, R., 2016. The sensory characterisation of old-vine Chenin blanc wine: An exploratory study of the dimensions of quality. Thesis, Stellenbosch University, Private BagX1, 7602 Matieland (Stellenbosch), South Africa. [ Links ]
Granato, D. & Ares, G., 2014. Mathematical and statistical methods in food science and technology. John Wiley & Sons, Chichester, UK. [ Links ]
Lindsay, P.H. & Norman, D.A., 1977. Human information processing: An introduction to psychology. Academic Press, Cambridge, MA, USA. [ Links ]
Maitre, I., Symoneaux, R., Jourjon, F. & Mehinagic, E., 2010. Sensory typicality of wines: How scientists have recently dealt with this subject. Food Qual. Prefer. 21(7), 726-731. [ Links ]
Niimi, J., Danner, L. & Bastian, S.E., 2019. Wine leads us by our heart not our head: Emotions and the wine consumer. Curr. Opin. Food Sci. 27, 23-28. [ Links ]
Old Vine Project (OVP), n.d. Certification process. Retrieved 29 April, 2020, from http://oldvineproject.co.za/old-vine-project-certification-process/ [ Links ]
Parr, W.V, Ballester, J., Peyron, D., Grose, C. & Valentin, D., 2015. Perceived minerality in Sauvignon wines: Influence of culture and perception mode. Food Qual. Prefer. 41, 121-132. [ Links ]
Perrin, L. & Pagès, J., 2009. A methodology for the analysis of sensory typicality judgments. J. Sens. Stud. 24(5), 749-773. [ Links ]
Salkind, N. (ed.), 2012. Encyclopedia of Measurement and Statistics. Thousand Oaks, CA, Sage. [ Links ]
SASEV, 2018. Unlocking value in South Africa's old vine resources. Workshop presented at SASEV-Winetech 41st International Conference, October 2018, Somerset West, South Africa. [ Links ]
SAWIS, 2018. Status of wine-grape vines as on 31 December 2018. Retrieved 31 August, 2020, from http://www.sawis.co.za/info/download/Vineyards_2018_final.pdf [ Links ]
Schouteten, J.J., De Steur, H., De Pelsmaeker, S., Lagast, S., De Bourdeaudhuij, I. & Gellynck, X., 2015. An integrated method for the emotional conceptualization and sensory characterization of food products: The EmoSensory®Wheel. Food Res. Int. 78, 96-107. [ Links ]
Stevenson, T., 2005 (4th ed.). The new Sotheby's wine encyclopedia. Dorling Kindersley Limited, London, UK. [ Links ]
Valentin, D., Chollet, S., Lelievre, M. & Abdi, H., 2012. Quick and dirty but still pretty good: A review of new descriptive methods in food science. Int. J. Food Sci. Technol. 47(8), 1563-1578. [ Links ]
Submitted for publication: April 2020
Accepted for publication: September 2020
* Corresponding author: E-mail address: abuica@sun.ac.za
Acknowledgements: The authors would like to thank the participating vineyards and the winemakers (Ms Marissa Nell andMs Freda Aléta Bruwer). This work was supported by funding by the National Research Foundation of South Africa (NRF) and Winetech

