


Services on Demand
Article
 English (pdf)
 Article in xml format
 Article references
Indicators

Related links
-
 Cited by Google
 -
 Similars in Google
Share

 Permalink
South African Journal of Enology and Viticulture
On-line version ISSN 2224-7904
Print version ISSN 0253-939X
S. Afr. J. Enol. Vitic. vol.41 n.1 Stellenbosch 2020
http://dx.doi.org/10.21548/41-1-3778
Evolution of Phenolic Content, Antioxidant Capacity and Phenolic Profile during Cold Pre-fermentative Maceration and Subsequent Fermentation of Cabernet Sauvignon Red Wine
Ó.A. Munoz-BernalI; A.J. Coria-OliverosI; A.A. Vazquez-FloresI; L.A. de la RosaI; J.A. Núnez-GastélumI; J. Rodrigo-GarciaII; J.F. Ayala-ZavalaIII; E. Alvarez-ParrillaI, *
IDepartment of Chemical Biological Sciences, Institute of Biomedical Sciences, Universidad Autônoma de Ciudad Juarez, C.P. 32310, Ciudad Juárez, Chihuahua, México
IIDepartment of Health Sciences, Institute of Biomedical Sciences, Universidad Autônoma de Ciudad Juárez, C.P. 32310, Ciudad Juárez, Chihuahua, México
IIIResearch Centre in Food and Development, A.C. (CIAD, AC), Carretera Gustavo Enrique Astiazarán Rosas, N0. 46 Col. La Victoria, CP. 83304, Hermosillo, Sonora, México
ABSTRACT
The phenolic compound profile and content of red wines are modified during the maceration-fermentation process by several factors that alter the extractability of the compounds and by reactions that phenolic compounds undergo, and can be directly related to the quality of the final wine and its beneficial effects on the consumer. The aim of this study was to determine the change in phenolic content and profile during cold pre-fermentative maceration and fermentation without the removal of grape pomace. Total phenolics, flavonoids, anthocyanins, tannins and antioxidant capacity were determined by spectrophotometric methods, and the phenolic profile was determined by HPLC-MS on each day of the maceration-fermentation process. The results showed a variation in the content of phenolic compounds and antioxidant activity over time, but the final phenolic content showed no significative difference compared with the initial content (1 268 mg GAE/L and 1 115 mg GAE/L respectively). The phenolic profile showed that flavonoids were the principal compounds in wine and that they increased at the end of the winemaking. Condensed tannins also increased during fermentation, while anthocyanins and some phenolic acids decreased at the end of the process. The final content of phenolic compounds was similar to the initial one, but there was a change in the different fractions of phenolic compounds at the end of fermentation.
Key words: Antioxidant capacity, fermentation, HPLC-MS, maceration, phenolic compounds
INTRODUCTION
The consumption of wine has increased in Mexico over the last years. The main production region in the country is Baja California (Font et al, 2010), with approximately 85% of Mexican wines. Lately, these wines have been recognised internationally for their quality. The actual production is about 15.4 million wine bottles, and the principal varieties are Cabernet Sauvignon, Merlot and Syrah (Trejo-Pech et al., 2012). However, there is a lack of information about the phenolic content and phenolic profile of Mexican wines.
Phenolic compounds have been studied due their beneficial effect on health and their ability to prevent non-transmissible chronic diseases. Wine is one of the beverages with the highest phenolic content (Drosou et al., 2015). Phenolic compounds also play a major role in some organoleptic characteristics of wine, such as colour and astringency (Zanoni et al., 2010; Bai et al, 2013). The final phenolic content in wine depends on the type of soil, climate, grape, harvest and pre and post-harvest treatments (Bai et al., 2013; Figueiredo-Gonzalez et al., 2014).
Other important factor that determines the phenolic content is fermentation-maceration. In red wines, maceration and fermentation are carried out at the same time (Zanoni et al., 2010). During maceration, must is in contact with the grape pomace and this increases the extraction of phenolic compounds related to the colour and structure of the final wine (De Beer et al., 2017). Maceration is a critical step to obtain the best characteristics of wine, since a large quantity of phenolic compounds come from seeds and skins (Aleixandre-Tudo et al., 2015; De Beer et al., 2017). The production of ethanol during fermentation also affects the extraction of phenolic compounds from the grape pomace into the wine, and several techniques have been used to improve such extraction, like punching down and pumping over, and these techniques guarantee the contact of wine with the grape pomace and enhance the extraction of phenolic compounds into the wine (De Beer et al, 2017).
The evolution of phenolic compounds during the fermentation-maceration of red wines has been investigated previously. It has been observed that the extraction of total phenolic compounds varies during the fermentation-maceration process; it is high during the initial days of the process and shows a trend to decrease during the final days of the process (Bimpilas et al, 2015). For other fractions, like anthocyanins, a similar trend has been reported, as it was observed that the extraction of anthocyanins is not constant; a decrease in anthocyanins occurs in the final days of fermentation, even when they are in contact with the grape pomace, which could be due to covalent linkage of this compounds with phenolic acids or tannins (Góméz-Míguez & Heredia, 2004; Gómez-Míguez et al, 2007; Casassa et al., 2013; Bimpilas et al, 2015). Total flavonoids also vary during fermentation, and their extraction increases with an increase in ethanol (Bimpilas et al, 2015). The extraction of tannins is also affected by ethanol content, as it has been reported that maximum extraction of tannins occurs at the end of the maceration process, and ethanol could help to extract those tannins linked to the cell wall (González-Manzano et al, 2004; Casassa et al, 2013). However, only a few studies have performed a detailed characterisation of the phenolic profile during the fermentation process along with spectrophotometric techniques in order to understand the changes in the phenolic profile during winemaking. In the present study, the changes in the different fractions of phenolic compounds produced during 15 days of maceration-fermentation were analysed using spectrophotometric techniques and were correlated to the antioxidant activity. The samples were also analysed by HPLC-MS to determine how the phenolic profile changed during the process as a result of to differences in the solubility of the compounds or chemical reactions that may occur among them during this process.
MATERIALS AND METHODS
Chemicals
Folin-Ciocalteu reagent, sodium carbonate, sodium nitrate, aluminium chloride, sodium hydroxide, potassium chloride, sodium acetate, vanillin, p-dimethylaminocinnamaldehyde (DMAC), iron chloride hexahydrate, 2,4,6 tripyridyl-s-triazine (TPTZ), 2,2-diphenyl-1-picryl-hydrazyl (DPPH), 2,2'-azino-bis-[3-ethyl-benzothiazoline]-6-sulfonic acid (ABTS), 6-hydroxy-2,5,7,8-tetramethylchroman-2-carboxylic acid (Trolox), sodium phosphate monobasic, sodium phosphate dibasic, sodium chloride, potassium persulfate, catechin and gallic acid were purchased from Sigma-Aldrich (St. Louis, MO, USA). For gallic acid, catechin, epicatechin, ellagic acid, protocatechuic acid, vanillin, chlorogenic acid, all standards were HPLC grade and were purchased from Sigma-Aldrich (St. Louis, MO, USA). HPLC-grade acetonitrile was purchased from Tedia (Fairfield, OH, USA). HPLC-grade formic acid was purchased from Sigma-Aldrich (St. Louis, MO, USA). All other reagents were analytical grade.
Wine samples
Cabernet Sauvignon (Vitis vinifera L. cv.) must and wine samples were kindly donated by Grupo Alximia S.A. de C.V. Valle de Guadalupe, Baja California, Mexico during the 2015 vintage.
Mature Cabernet Sauvignon grapes (22°B, pH below 3.9 and visual seed maturity) were harvested by hand from a vineyard located at El Valle de Guadalupe (Baja California, Mexico) and transported to the winery in plastic baskets. Grapes were crushed and destemmed immediately after being harvested and were placed in a stainless tank with a capacity of four tonnes, after which 120 mg/L of SO2 was added. The maceration was carried on at 10°C for five days. After this period, Saccharomyces cerevisiae (Scott Labs, BM45) was added to initiate fermentation (500 g for 40 hL). Fermentation was carried on at 23°C without the removal of grape pomace and was completed after 10 days. The density during the maceration-fermentation process was monitored using a hydrometer. The tank was pumped over for 30 to 45 min, three times a day, during all the maceration-fermentation processes in order to homogenise its content. Samples were collected daily just after the first pump-over process to ensure sample homogeneity. A daily composite sample was taken by mixing 500 mL from the upper and lower valves of the tank. Samples were collected for 16 days (six days of maceration and 10 days of fermentation), and vacuum stored at -20°C, transported in a cooler to the laboratory at the Universidad Autônoma de Ciudad Juárez (Ciudad Juárez, Chihuahua, Mexico), and stored at -80°C (Thermo Scientific®, EXF32086D) until further studies.
pH and titratable acidity
pH and titratable acidity (g/L tartaric acid equivalents ) analyses were performed according to the International Organization of Vine and Wine ([OIV], 2016).
Sample preparation
To avoid overestimation of the phenolic content and antioxidant activity due to the presence of a high sugar content, must and wine samples were passed through a C18 silica cartridge (Supleco®, Envi-18 6 mL/500 mg). The column was equilibrated with 6 mL of methanol and 6 mL of deionised water. After equilibration, 2 mL of the sample was poured into the column and 20 mL of water was passed through to eliminate sugars and other hydrophilic compounds. Finally, 20 mL of methanol and 20 mL of acetone were passed through the cartridge to recover the phenolic compound fraction. The methanol and acetone fractions were mixed and then concentrated using a rotary evaporator (Buchi®, R-3). The phenolic compound fractions were dissolved in 2 mL of methanol (sugar-free samples, SFS). All the spectrophotometric and chromatographic analyses were carried out with the SFS.
Total phenolic content
Total phenolic content (PC) was measured by the Folin-Ciocalteu method as described by Moreno-Escamilla et al. (2015), with slight modifications. In brief, 250 uL of SFS was mixed with 1 000 L of sodium carbonate (7.5%) and 1 250 uL of Folin-Ciocalteu's (10% in water) reagent. The mix was incubated for 15 min at 50°C in the dark (water bath) and measured at 765 nm in a microplate reader (Bio-RAD®, XMark). Gallic acid was used as the standard, and the results were expressed as milligrams of gallic acid equivalents per litre (mg GAE/L).
Total flavonoid content
The total flavonoid content (FC) in SFS was measured following the AlCl3 complexation method (Moreno-Escamilla et al, 2015). Briefly, 31 uL of SFS was mixed in a microplate with 125 uL of water, 9.3 uL of sodium nitrate (5%), 9.3 uL of aluminium chloride (10%) and 125 uL of sodium hydroxide (0.5 M). The mix was incubated for 30 min at room temperature in the dark. The reaction was measured at 510 nm in a microplate reader. Catechin was used as standard, and the results were expressed as milligrams of catechin equivalents per litre (mg CE/L).
Anthocyanin content
The anthocyanin content (AC) in SFS was measured according to Lee et al. (2005). An aliquot of 250 uL of SFS was poured into a tube with 2 mL of potassium chloride solution (0.025 M) adjusted to pH 1 with concentrated HCl. The mix was then incubated at room temperature for 20 min. In another tube, 250 uL of SFS was mixed with 2 mL of sodium acetate solution (0.4 M, pH 4.5) and incubated at room temperature for 20 min. An aliquot of 300 uL of each sample was placed in a microplate, and absorbance was measured at 520 and 700 nm. The anthocyanin content in the samples was calculated using Equation 1.
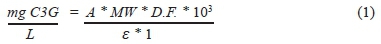
where: A = (Abs520 - Abs700), pH 1 - (Abs520 - Abs700) pH 4.5, MW (molecular weight) = 449.2 g mol-1 for cyanidin 3-glucoside, D.F. = dilution factor used, 10s= factor conversion g to mg, e = 26900 molar extinction coefficient in L/mol cm, and 1 = pathlength in cm. The results were expressed as milligrams of cyanidin 3-glucoside equivalents per litre (mg C3G/L).
Tannin content (DMAC method)
Tannin determination by DMAC was performed according to the methodology proposed by Robbins et al. (2015). In brief, 50 uL of SFS was poured onto a microplate, and then 250 uL of DMAC reagent (10% in methanol) was added. The reaction was incubated for 5 min at room temperature, and absorbance was measured at 640 nm. Catechin was used as standard, and the results were expressed as milligrams of catechin equivalents per litre (mg CE/L).
Antioxidant capacity (FRAP)
The antioxidant capacity in SFS was measured by FRAP according to Moreno-Escamilla et al. (2015), with slight modifications. In a microplate, 24 uL of SFS was mixed with 180 uL of FRAP reagent (TPTZ 10 mM in HCl 40 mM, iron chloride hexahydrate 20 mM, acetate buffer 0.3 M, pH 3 in a ratio of 1:1:10 prepared daily). The reaction was carried out at 37°C, and absorbance was measured at 595 nm every min for 30 min. Trolox was used as standard, and the results were expressed as millimoles of Trolox equivalents per litre (mmol TE/L).
Antioxidant capacity by DPPH radical scavenging
The antioxidant capacity of the samples was measured by DPPH radical scavenging according to Moreno-Escamilla et al. (2015). In a microplate, 25 uL of SFS was mixed with 180 uL of DPPH radical 6 mM and measured at 517 nm every 30 s for 10 min. Trolox was used as standard, and the results were expressed as millimoles of Trolox equivalents per litre (mmol TE/L).
Antioxidant capacity by ABTS radical scavenging
The antioxidant capacity of samples was determined by ABTS radical according to Moreno-Escamilla et al. (2015). In a microplate, 12 uL of SFS was mixed with 285 uL of ABTS 45 mM (in phosphate buffer solution (PBS) 0.1 M, pH 7.4, potassium persulfate 0.5 mM previously oxidized at room temperature for 16 h). The reaction was measured at 734 nm every 30 s for 5 min. Trolox was used as standard, and the results were expressed as millimoles of Trolox equivalents per litre (mg TE/L).
High-performance liquid chromatography mass spectrometry (HPLC/MS-ESI-QTOF)
An Agilent Series 1200 LC system, combined with an Agilent 6500 Series Q-TOF MS system, was used in this study. The Agilent Mass Hunter Software was applied to the system. The HPLC system consisted of a quaternary pump, an autosampler, a column thermostat, and an UV/Vis diode-array detector. A Zorbax C18 column (50 mm x 2.1 mm, 1.8 um) (Agilent® Technologies, Santa Clara, CA, USA) was used at 25°C for the separations. The flow rate of the mobile phase was 0.4 mL/min. A multi-step gradient method was applied, using 0.1 % (v/v) formic acid in water as solvent A, and pure acetonitrile as solvent B. For the elution program, the following proportion of solvent B was used: 0 to 1 min, 10%; 1 to 4 min, 30%; 4 to 6 min, 38%; 6 to 8 min, 60%; 8 to 8.5 min, 60%; and 8.5 to 9 min, 10%. SFS samples were filtered through 0.45 num nylon filters and injected into the HPLC-DAD-MS system. The injection volume was 2 uL. The mass spectrometer was equipped with an electrospray ion (ESI) source, operated in negative mode. Nitrogen was used as drying gas at 340°C, with a flow rate of 13 L/min; the pressure of the nebuliser was set at 60 psi, with a capillary voltage of 175 V and the scanning mass-to-charge range of the Q-TOF mass analyser set at 100 to 1 000 m/z.
The identification of compounds was performed by the UV/Vis, MS spectra and the retention times of the available standards. Most of the compounds were identified using the MS data compared against the Mass Hunter PCDL databank and the literature. The identified ions were taken to have an abundance of between 100 and 5 000 counts, and the ions below these abundances were taken as noise.
Statistical analysis
Each analysis was performed in triplicate. The results express the average and standard deviation. One-way analysis of variance (ANOVA) was applied, and Tukey's test was used for comparison of the mean values. Both analyses were performed at a significance level of 0.05, using SPSS 23 software (IBM, Chicago, IL, USA).
RESULTS AND DISCUSSION
Changes in the content of different fractions of phenolic compounds during maceration-fermentation
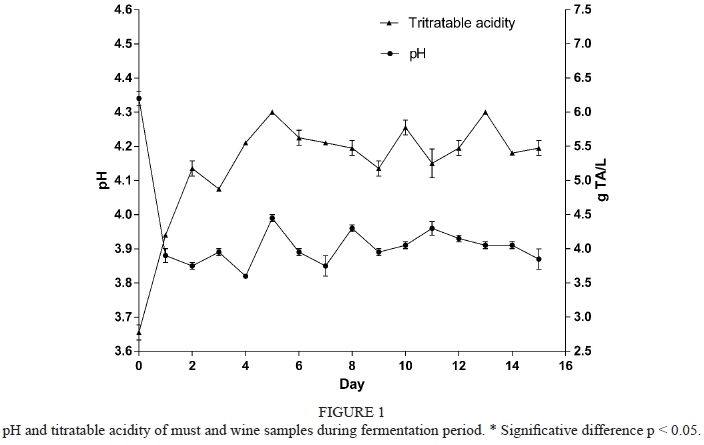
Several changes occur in the grape must during fermentation, some of which may have an impact on the extractability, solubility or stability of phenolic compounds from the pomace, for example a low pH improves the stability of wines by preventing the ionisation of phenolic acids and other phenolic compounds (Ribéreau-Gayon et al., 2006a). Changes in the pH and titratable acidity (TA) of the samples during fermentation are shown in Fig. 1. The results showed a correlation between both parameters. The pH value diminished rapidly, from 4.34 to 3.84, during the first two days of maceration and remained stable from day 2 to day 15. This effect is attributed to the buffer characteristic of wine (Ribéreau-Gayon et al., 2006b). TA increased from 2.77 on day 0 to 5.47 g TAE/L on day 2. The rapid decrease in pH and increase in TA can be attributed to the release of organic acids by the grapes into the must, specifically tartaric acid, which is the main organic acid present in grapes (Ribéreau-Gayon et al., 2006a). Organic acids in grape must (tartaric, malic and citric) are not affected during fermentation, but they are important to control the pH at low levels and stabilise the colour of the wine (Jackson, 2000). Higher pH (> 3.9) in wines favours the ionised state of phenolic compounds (phenolate), which are susceptible to oxidation; this phenomenon leads to a loss of colour in and oxidation of the wine. pH also influences the reactions of specific phenolic fractions, like anthocyanins and tannins (Jackson, 2000; Fulcrand et al., 2006). The final pH and acidity values obtained in the present study are similar to those reported previously for Cabernet Sauvignon (pH of 3.61 to 3.96 and 4.90 g to 6.01 g TAE/L) (Falcao et al., 2007).
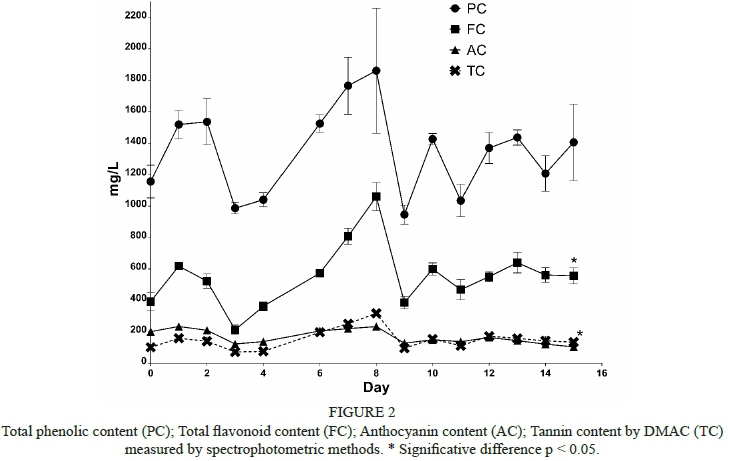
Next, the evolution of the different fractions of phenolic compounds was evaluated during the 15 days of the maceration-fermentation process. Fig. 2 shows the behaviour of PC, FC, AC and TC analysed by spectrophotometric methods in SFS. PC was variable throughout the maceration-fermentation process (Fig. 2). An increase can be observed from day 0 to day 2, followed by a decrease on the third day. From day 4 to day 8, an exponential increase in PC can be observed, coinciding with the beginning of fermentation and followed by a decrease in PC on day 9. After this variation, the changes were minor from day 10 to 15. The PC content in the must was 1 155 mg GAE/L, and the maximum value achieved was on day 8 (2 090 mg GAE/L). At the end of the maceration-fermentation, the PC content was 1 268 mg GAE/L. There was no significant difference between the contents of PC in the must (day 0) and the wine at the end of fermentation (day 15). Nevertheless, there was a tendency for the PC contents to increase at the end of fermentation. FC showed similar behaviour to PC (Fig. 2). The initial value of FC in the must was 392.6 mg CE/L. An increase in FC was observed at the beginning of maceration-fermentation (days 0 to 2), followed by a decrease and an exponential increase, reaching a maximum value on day 8 (1 060 mg CE/L). From this day on, a decrease in FC was observed, along with small fluctuations until day 15 (final content 555 mg CE/L). Similar results were reported by Bimpilas et al. (2015), who evaluated the PC, FC and AC content of Merlot wine during fermentation and observed similar fluctuations during the process. Tannins presented a lower content than flavonoids. On day 0, TC was 101.8 mg CE/L, as observed in FC and PC. The maximum TC was on day 8 (318.3 mg CE/L), and then it decreased until day 15 (133.9 mg CE/L). In the must, the AC was 201.19 mg C3G/L. In the initial days, the AC presented similar values; after this period, an increase in AC was observed, and the maximum AC was reached on day 8, at 234.02 mg C3G/L. The AC decreased from day 9, as also observed for PC, FC and TC. At the end of fermentation (day 15) a significant reduction in AC was observed (104.08 mg C3G/L).
The PC values observed in the present study are similar to those reported by other authors for Cabernet Sauvignon wines: 1 300 to 2 900 mg GAE/L (Villano et al., 2006; Burin et al., 2011; Jiang & Zhang, 2012; Chen et al., 2018). During maceration, phenolic compounds from the grapes are extracted into the wine (Soto Vazquez et al., 2010); the fermentation process leads to slight increases in the PC, which can be explained by the rise in the ethanol content of the medium. Ethanol facilitates the extraction of phenolic compounds, such as tannins and flavonoids, from the grape pomace into the wne (Figueiredo-Gonzalez et al., 2014). Villano et al. (2006) observed an increase in PC during 11 days of maceration, from 734 mg GAE/L to 2 813 mg GAE/L, for Cabernet Sauvignon. According to Soto Vazquez et al. (2010), cold maceration before fermentation increased the phenolic content of wines, and this effect was also observed in the present results in the increase of PC from day 0 to day 3. Meanwhile, the effect of the increase in ethanol can be observed from day 5 to day 8. Similar behaviour was observed by Gómez-Míguez et al. (2007), who used a cold maceration and an increase was observed in total phenolics.
FC showed a significant increase on the final day of fermentation compared to the initial day (Fig. 2). The increase in FC can be explained considering that the solubility of flavonoids in water is low, while the increase in ethanol content in wine during the fermentation process facilitates their extraction from the grape pomace (Bimpilas et al., 2015). The final FC was 555 mg CE/L. These results are lower than those reported previously (1 390 mg CE/L) (Pimentel et al., 2010). This difference in flavonoid content can be explained by considering different agronomic conditions (as climate, soil and water availability) and winemaking processes and technologies, among other factors that can affect the FC in grapes and wine (Pimentel et al., 2010).
AC showed a decrease during fermentation, from 201 mg to 104 mg C3G/L (Fig. 2). The final AC was lower than previously reported for Cabernet Sauvignon wines (300 to 320 mg C3G/L) (Bai et al., 2013) in similar fermentation temperatures (28°C). Grape anthocyanin composition depends on grape maturation and pre-harvest conditions. Fermentation conditions, such as time and temperature, also affect the extraction of anthocyanins (Garrido & Borges, 2013). Puskas et al. (2005) evaluated the effect of time and temperature on the content of anthocyanins. They observed that longer time of maceration (15 days) and higher temperatures (35°C) had a negative effect on the colour and anthocyanin content of wines, probably due to oxidation and an increase in interactions between tannins and anthocyanins. Bindon et al. (2014) reported an increase in the total anthocyanin content in the first six days, similar to the results observed in the present study, in which an increase in anthocyanin content was observed in the first eight days, followed by a decrease until the end of fermentation (Fig. 2).
In recent years, different methods for tannin quantification have been proposed; however, results on wine condensed tannins are still limited. The major advantage of the DMAC method is its sensibility and, since DMAC reagent reacts only with the terminal unit of tannin, it is not affected by the degree of polymerisation (Rohr et al., 2000). TC by DMAC showed slightly higher values at the end of fermentation (from 101 to 133 mg CE/L). There are several processes during fermentation that can affect the extraction of tannins into wine. According to Smith et al. (2015), longer maceration times can improve their extraction. This could be due to their amphipathic properties, which allow condensed tannins to bind with proteins or sugars present in the grape that prevent their extraction (Hanlin et al., 2010). Also, anthocyanins are involved in the extraction of tannins, since they can improve the solubilisation and retention of tannins through the formation of polymeric molecules, which are involved in the stabilisation of colour in wines (Smith et al., 2015). A higher ethanol content could also facilitate the extraction and solubilisation of condensed tannins.
Changes in antioxidant capacity during maceration-fermentation
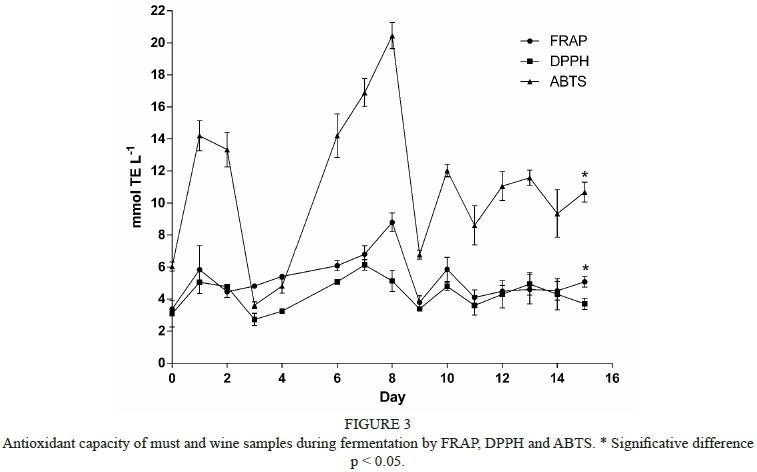
The antioxidant capacity of SFS evaluated by three different methods showed fluctuations throughout the fermentation process (Fig. 3).
Antioxidants can be monitored using different assays, including those that involve single electron transfer, like FRAP, ABTS and DPPH assays (Shahidi & Zhong, 2015). ABTS and DPPH are based on the generation of a colourful radical that can be reduced by antioxidants (Floegel et al., 2011). On the other hand, a FRAP assay involves the reduction of ferric ion to its ferrous form (Shahidi & Zhong, 2015), and the reduction ability of the antioxidant is related to its antioxidant capacity.
The antioxidant activity in the FRAP and DPPH assays showed similar results, whereas the ABTS assay showed higher antioxidant activity than the other two methods. For the DPPH assay, there was no statistical difference between day 0 and 15, while for the ABTS and FRAP assays, statistical differences were observed between the first and the last day. The results obtained herein (FRAP 3.38 and 5.08 mmol TE/L, ABTS 6.04 and 10.68 mmol TE/L, and DPPH 3.09 and 3.71 mmol TE/L for day 0 and 15 respectively) are lower than those reported by other authors for red grape juice (Moreno-Montoro et al., 2015; Padilha et al., 2017), and red wine (Moreno-Montoro et al., 2015; Padilha et al., 2017). This lower value for antioxidant capacity could be explained by considering that, in our study, SFS were used after sugar and any other hydrophilic compounds were removed, thus an overestimation of the antioxidant capacity was diminished.
These variations were well correlated with the behaviour of PC, FC and TC during the fermentation process, but not with AC (Table I).
PC was significantly correlated with the antioxidant capacity in the three different techniques. This points out a relationship between the phenolic compound concentration in the wine and their free radical-scavenging and ferric-reducing capacities (Dudonné et al., 2009). In the case of the anthocyanins, some authors have reported a high correlation between antioxidant activity and anthocyanin content. Nonetheless, a low correlation was found in this study; this can be attributed to the low content of anthocyanins in must and wine, and their low participation in antioxidant capacity. This agrees with previous data obtained by other authors (Paixão et al. 2007), who have reported that total phenolic compounds, and not anthocyanins, are the main source responsible for the antioxidant activity in wine samples.
Effect of fermentation-maceration on the phenolic profile determined by HPLC/MS ESI-QTOF
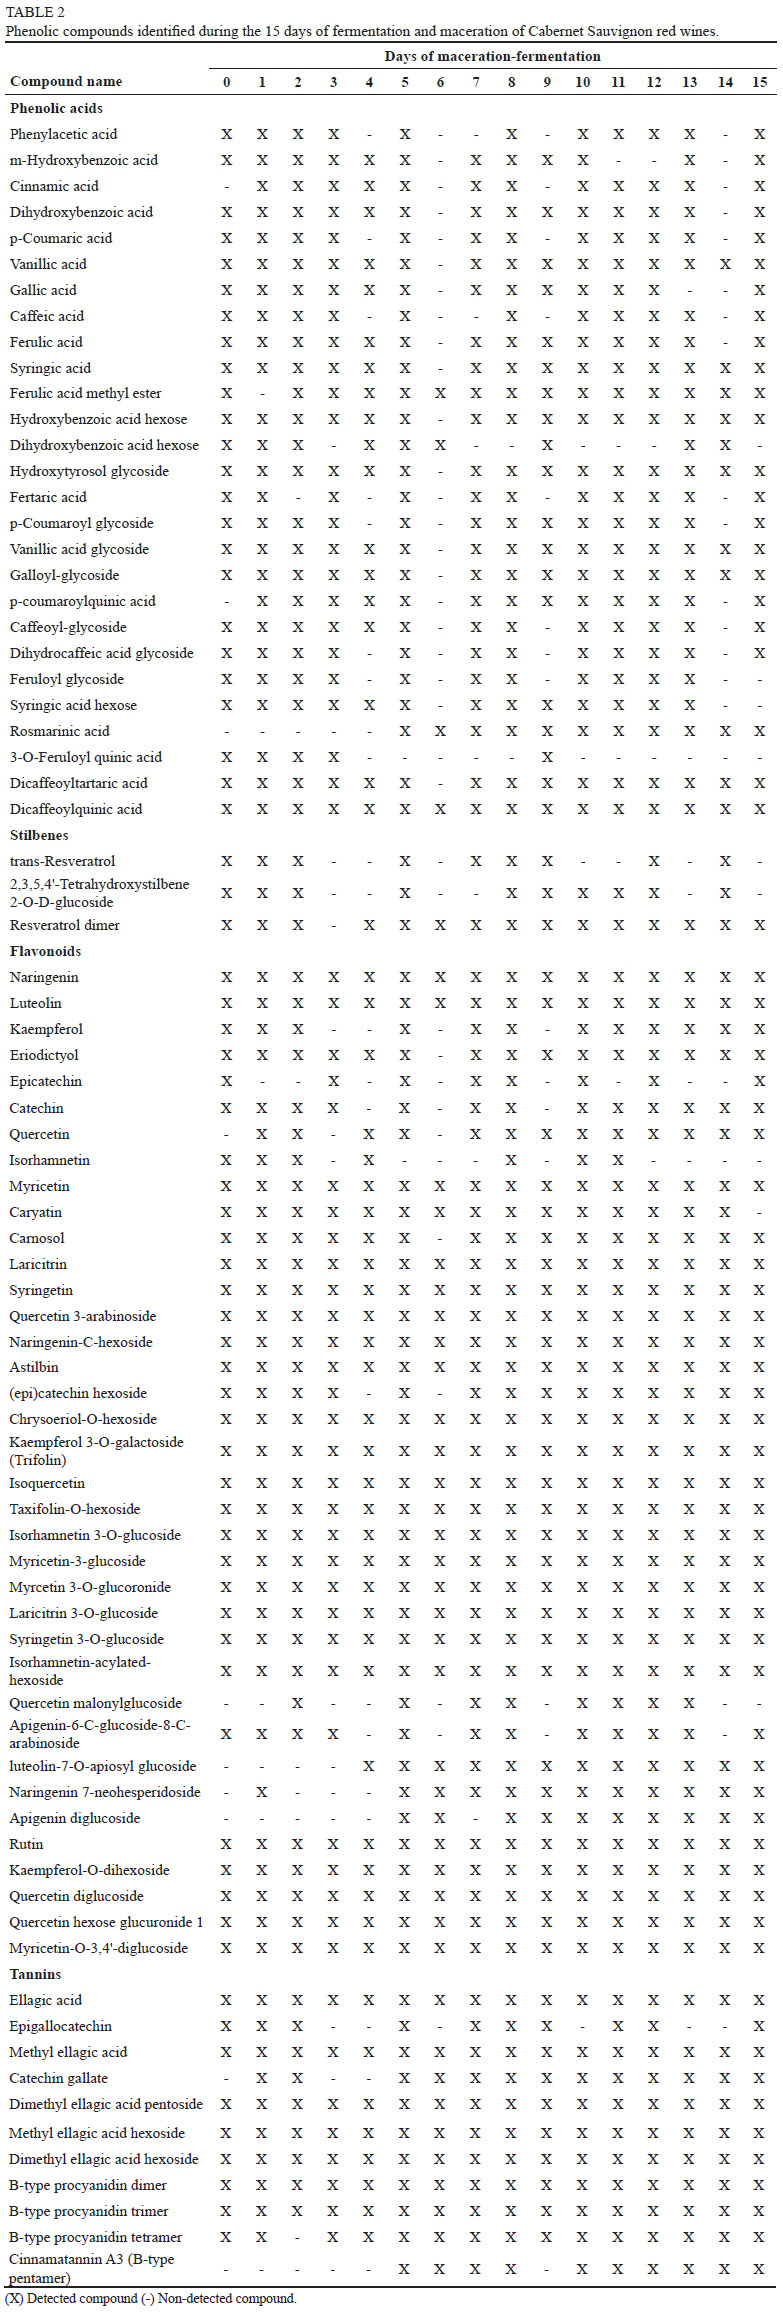
Phenolic compounds were tentatively identified by HPLC/ MS ESI-Q-TOF using the databank of the Agilent Mass Hunter Metlin, and a databank of phenolic compounds generated in the laboratory. Compounds were identified by comparing the weight of the molecular ion and its isotopic distribution. Only ions with an abundance of between 100 and 5 000 counts were identified. All the compounds identified during the fermentation process are listed in Table 2.
The compounds showed variation throughout the process, as displayed in the spectrophotometric results. During fermentation, 29 phenolic acids and their derivatives were found. Results using HPLC-MS showed that most phenolic acids were present during the 15 days of fermentation-maceration. Nevertheless, the abundance of the ions presented a variation over the days and, in the final days, the abundance of phenolic acids diminished in comparison with the initial days of fermentation-maceration. The principal phenolic acids were gallic, caffeic, ferulic and syringic acids. Their glycosylated derivatives were also observed. A loss of syringic acid glycoside and feruloyl glycoside was observed in the final days of fermentation. These results are in accordance with previous reports of phenolic acids present in Cabernet Sauvignon wines. Bai et al. (2013) observed that gallic acid, caffeic acid and p-coumaric acid were the main phenolic acids present in young and aged wines. De Beer et al. (2017) observed that pre-fermentation maceration increased the content of phenolic acids, specifically caftaric, coutaric and p-coumaric acids. Fertaric acid was also identified in almost all samples, in agreement with Jiang and Zhang (2012), who reported a high content of this hydroxycinnamic acid in Cabernet Sauvignon wines from different parts of China.
Flavonoids were the most abundant fraction in the samples, in which a total of 34 flavonoids were found (Table 2). Quercetin, kaempferol, laricitrin and their derivates were found during the 15 days of fermentation. This is in accordance with some authors, who reported the presence of those flavonoids in Cabernet Sauvignon wines (Li et al., 2011; Bai et al, 2013; Lingua et al., 2016b). The present results also showed the presence of glycosylated flavonoids that have been reported previously by other authors (Bimpilas et al., 2015; Lingua et al., 2016b). According to Bimpilas et al. (2015), glycosylated flavonoids are present in the skins of grapes and can be extracted on the initial day of maceration. The results showed that the flavonoids were present during all of the maceration-fermentation process, and this is in accordance with the spectrophotometric results, which showed that flavonoids were the principal fraction of phenolic compounds. According to Bai et al. (2013), flavonols like myricetin, quercetin and others are related to the stabilization of colour by reacting with anthocyanins in a process known as co-pigmentation.
Procyanidin dimers, trimers and tetramers, as well as their monomers (catechin and epicatechin), were observed in all samples, in agreement with Jiang and Zhang (2012), who reported these monomeric and oligomeric flavan-3-ols. A procyanidin pentamer was detected only from day 6 to the last day of fermentation; this could be attributed to the maceration time. According to Smith et al. (2015), extended maceration promotes the hydration of the grape seeds and improves the extraction of tannins into the wine. These results are similar to previous studies that reported procyanidin dimers and trimers in Cabernet Sauvignon wines (Li et al., 2011; Lingua et al., 2016a). Ellagic acid and two glycosylated derivatives (pentoside and hexoside) were found in the samples during the 15 days of the process. Ellagic acid has previously been reported in Cabernet Sauvignon wine (Panceri et al., 2015), while its derivatives are reported for the first time. Trans-resveratrol, a resveratrol dimer and a glycosylated stilbene were detected (Table 2). Only the resveratrol dimer was found throughout all the maceration-fermentation process; trans-resveratrol and the glucoside were present for 14 days and lost on the final day.
CONCLUSIONS
The maceration-fermentation process of red wine from Cabernet Sauvignon was shown to affect the fractions of some phenolic compounds. Spectrophotometric results revealed that there was variation in the phenolic profile and content through the process, but the initial and final PC values were not statistically different, although a tendency to increase was observed. FC was statistically higher at the end of fermentation and showed a non-significant increase. On the other hand, AC decreased significantly by the end of the process. This phenomenon could be attributed to the loss of anthocyanins by degradation or oxidation, and to the co-pigmentation process, which involves the reaction between anthocyanins, and tannins and flavonoids. The antioxidant capacity of the samples also showed a variation through fermentation that was positively correlated with the PC, FC and TC of the must and wine. On the other hand, AC expressed a low correlation with the three antioxidant activity techniques (FRAP, DPPH and ABTS). The phenolic profile of the samples showed a small variation, and most compounds were present during the whole process. Only some phenolic acid derivates were lost at the end of fermentation, and the presence of a procyanidin pentamer was observed from day 6 to the end of maceration-fermentation. CTQ and EPC were observed throughout the process, as was ellagic acid. The principal phenolic acids detected in the samples were gallic, vanillic and caffeic. In the case of stilbenes, resveratrol and a dimer of resveratrol were found in the samples. The main flavonoids detected were quercetin and myricetin and their derivates. The time and temperature of the maceration-fermentation process played an important role in the behaviour of the different fractions of phenolic compounds, since such factors improve the extraction of compounds such as tannin and cause the loss or reaction of others, like phenolic acids and anthocyanins. These findings are novel for Mexican wines, since there is a lack of information on their phenolic content and phenolic profile; however, a more complete characterisation of different Mexican red wine varieties is still needed.
LITERATURE CITED
Aleixandre-Tudo, J.L., Weightman, C., Panzeri V., Nieuwoudt, H.H. & du Toit, W.J., 2015. Effect of skin contact before and during alcoholic fermentation on the chemical and sensory profile of South African Chenin blanc white wines. S. Afr. J. Enol. Vitic. 36(3), 366-377. [ Links ]
Bai, B., He, F., Yang, L., Chen, F., Reeves, M.J. & Li, J., 2013. Comparative study of phenolic compounds in Cabernet Sauvignon wines made in traditional and Ganimede fermenters. Food Chem. 141(4), 3984-3992. [ Links ]
Bimpilas, A., Tsimogiannis, D., Balta-Brouma, K., Lymperopoulou, T. & Oreopoulou, V., 2015. Evolution of phenolic compounds and metal content of wine during alcoholic fermentation and storage. Food Chem. 178, 164171. [ Links ]
Bindon, K.A., McCarthy, M.G. & Smith, P.A., 2014. Development of wine colour and non-bleachable pigments during the fermentation and ageing of (Vitis vinifera L. cv.) Cabernet Sauvignon wines differing in anthocyanin and tannin concentration. LWT - Food Sci. Technol. 59(2), 923-932. [ Links ]
Burin, V.M., Freitas Costa, L.L., Rosier, J.P. & Bordignon-Luiz, M.T., 2011. Cabernet Sauvignon wines from two different clones, characterization and evolution during bottle ageing. LWT - Food Sci. Technol. 44(9), 1931-1938. [ Links ]
Casassa, F.L., Beaver, C.W., Mireles, C.W. & Harbertson, J.F., 2013. Effect of extended maceration and ethanol concentration on the extraction and evolution of phenolics, colour components and sensory attributes of Merlot wines. Aust. J. Grape Wine Res. 19(1), 25-39. [ Links ]
Chen, W.-K., He, F., Wang, Y.-X., Liu, X., Duan, C.-Q. & Wang, J. 2018. Influences of berry size on fruit composition and wine quality of Vitis vinifera L. cv. 'Cabernet Sauvignon' grapes. S. Afr. J. Enol. Vitic. 39, 67-76. [ Links ]
Da Silva Padilha, C.V., Miskinis, G.A., De Souza, M.E.A.O., Pereira, G.E., De Oliveira, D., Bordignon-Luiz, M.T. & Dos Santos Lima, M., 2017. Rapid determination of flavonoids and phenolic acids in grape juices and wines by RP-HPLC/DAD: Method validation and characterization of commercial products of the new Brazilian varieties of grape. Food Chem. 228, 106-115. [ Links ]
De Beer, D., Joubert, E., Marais J. & Manley, M., 2017. Maceration before and during fermentation: Effect on Pinotage wine phenolic composition, total antioxidant capacity and objective colour parameters. S. Afr. J. Enol. Vitic. 27(2), 137-150. [ Links ]
Drosou, C., Kyriakopoulou, K., Bimpilas, A., Tsimogiannis, D. & Krokida, M., 2015. A comparative study on different extraction techniques to recover red grape pomace polyphenols from vinification byproducts. Ind. Crop. Prod. 75, 141-149. [ Links ]
Dudonné, S., Vitrac, X., Coutiére, P., Woillez, M. & Mérillon, J.M., 2009. Comparative study of antioxidant properties and total phenolic content of 30 plant extracts of industrial interest using DPPH, ABTS, FRAP, SOD, and ORAC assays. J. Agric. Food Chem. 57(5), 1768-1774. [ Links ]
Falcao, L.D., De Revel, G., Perello, M.C., Moutsion, A., Zanus, M.C. & Bordingon-Luiz, M.T., 2007. Survey of seasonal temperatures and vineyard altitude influences on 2-methoxy-3-isobutylpyrazine, C13 norisoprenoids, and the sensory profile of Brazilian Cabernet Sauvignon wines. J. Agric. Food Chem. 55, 3605-3612. [ Links ]
Figueiredo-Gonzalez, M., Cancho-Grande, B., Simal-Gandara, J., Teixeira, N., Mateus, N. & De Freitas, V., 2014. The phenolic chemistry and spectrochemistry of red sweet wine-making and oak-aging. Food Chem. 152, 522-530. [ Links ]
Floegel, A., Kim, D.O., Chung, S.J., Koo, S.I. & Chun, O.K., 2011. Comparison of ABTS/DPPH assays to measure antioxidant capacity in popular antioxidant-rich US foods. J. Food Compos. Anal. 24(7), 10431048. [ Links ]
Font, I., Gudino, P. & Sánchez, A., 2010. La industria vinícola mexicana y las políticas agroindustriales: panorama general. Redpol. 2, 1-30. [ Links ]
Fulcrand, H., Duenas, M., Salas, E. & Cheynier, V., 2006. Phenolic reactions during winemaking and aging. Am. J. Enol. Vitic. 57(3), 289-297. [ Links ]
Garrido, J. & Borges, F., 2013. Wine and grape polyphenols - A chemical perspective. Food Res. Int. 54(2), 1844-1858. [ Links ]
Góméz-Míguez, M. & Heredia, F.J., 2004. Effect of the maceration technique on the relationships between anthocyanin composition and objective color of Syrah wines. J. Agric. Food Chem. 52(16), 5117-5123. [ Links ]
Gómez-Míguez, M., González-Miret, M.L. & Heredia, F.J., 2007. Evolution of colour and anthocyanin composition of Syrah wines elaborated with pre-fermentative cold maceration. J. Food Eng. 79(1), 271-278. [ Links ]
González-Manzano, S., Rivas-Gonzalo, J.C. & Santos-Buelga, C., 2004. Extraction of flavan-3-ols from grape seed and skin into wine using simulated maceration. Anal. Chim. Acta 513(1), 283-289. [ Links ]
Hanlin, R.L., Hrmova, M., Harbertson, J.F. & Downey, M.O., 2010. Review: Condensed tannin and grape cell wall interactions and their impact on tannin extractability into wine. Aust. J. Grape Wine Res. 16(1), 173-188. [ Links ]
International Organization of Vine and Wine (OIV), 2016. Compendium of International Methods of Wine and Must Analysis. Vol. 1. OIV, Paris, France. [ Links ]
Jackson, R.S., 2000 (2nd ed). Wine Science. Academic Press, San Diego, CA. [ Links ]
Jiang, B. & Zhang, Z.W.W., 2012. Comparison on phenolic compounds and antioxidant properties of Cabernet Sauvignon and Merlot Wines from four wine grape-growing regions in China. Molecules 17(8), 88048821. [ Links ]
Lee, J., Durst, R.W. & Wrolstad, R.E., 2005. Determination of total monomeric anthocyanin pigment content of fruit juices, beverages, natural colorants, and wines by the pH differential method: Collaborative study. J. AOAC Int. 88(5), 1269-1278. [ Links ]
Li, Z., Pan, Q., Jin, Z., Mu, L. & Duan, C., 2011. Comparison on phenolic compounds in Vitis vinifera cv. Cabernet Sauvignon wines from five winegrowing regions in China. Food Chem. 125(1), 77-83. [ Links ]
Lingua, M.S., Fabani, M.P., Wunderlin, D.A. & Baroni, M.V., 2016a. In vivo antioxidant activity of grape, pomace and wine from three red varieties grown in Argentina: Its relationship to phenolic profile. J. Funct. Foods 20, 332-345. [ Links ]
Lingua, M.S., Fabani, M.P., Wunderlin, D.A. & Baroni, M.V., 2016b. From grape to wine: Changes in phenolic composition and its influence on antioxidant activity. Food Chem. 208, 228-238. [ Links ]
Moreno-Escamilla, J.O., De la Rosa, L.A., López-Díaz, J.A., Rodrigo-Garcia, J., Núnez-Gastélum, J.A. & Alvarez-Parrilla, E., 2015. Effect of the smoking process and firewood type in the phytochemical content and antioxidant capacity of red Jalapeno pepper during its transformation to chipotle pepper. Food Res. Int. 76, 654-660. [ Links ]
Moreno-Montoro, M., Olalla-Herrera, M., Gimenez-Martinez, R., Navarro-Alarcon, M. & Rufián-Henares, J.A., 2015. Phenolic compounds and antioxidant activity of Spanish commercial grape juices. J. Food Comp. Anal. 38, 19-26. [ Links ]
Paixão, N., Perestrelo, R., Marques, J.C. & Câmara, J.S., 2007. Relationship between antioxidant capacity and total phenolic content of red, rosé and white wines. Food Chem. 105(1), 204-214. [ Links ]
Panceri, C.P., De Gois, J.S., Borges, D. & Bordignon-Luiz, M.T., 2015. Effect of grape dehydration under controlled conditions on chemical composition and sensory characteristics of Cabernet Sauvignon and Merlot wines. LWT - Food Sci. Technol. 63(1), 228-235. [ Links ]
Pimentel, F.A., Nitzke, J.A., Klipel, C.B. & De Jong, E.V., 2010. Chocolate and red wine - A comparison between flavonoids content. Food Chem. 120(1), 109-112. [ Links ]
Puskas, V.S., Kovac, V.M., DodiC, J.M. & DodiC, S.N., 2005. Effect of fermentation conditions on content of phenolic compounds in red wine. Acta Period. Technol. 266, 61-69. [ Links ]
Ribéreau-Gayon, P., Dubourdieu, D., Doneche, B & Lonvaud, A., 2006b (2nd ed). Handbook of Enology. Vol. 1. Wiley & Sons, Ltd, Chichester, England. [ Links ]
Ribéreau-Gayon, P., Glories, Y., Maujean A. & Dubourdieu, D., 2006a (2nd ed). Handbook of Enology. Vol. 2. Wiley & Sons, Ltd, Chichester, England. [ Links ]
Robbins, K.S., Gong, Y., Wells, M.L., Greenspan, P. & Pegg, R.B., 2015. Investigation of the antioxidant capacity and phenolic constituents of US pecans. J. Funct. Foods 15, 11-22. [ Links ]
Rohr, G.E., Meier, B. & Sticher, O., 2000. Analysis of procyanidins. Stud. Nat. Prod. Chem. 21, 497-570. [ Links ]
Shahidi, F. & Zhong, Y., 2015. Measurement of antioxidant activity J. Funct. Foods 18, 757-781. [ Links ]
Smith, P.A., Mcrae, J.M. & Bindon, K.A., 2015. Impact of winemaking practices on the concentration and composition of tannins in red wine. Aust. J. Grape Wine Res. 21, 601-614. [ Links ]
Soto Vázquez, E., Rio Segade, S. & Orriols Fernandez, I., 2010. Effect of the winemaking technique on phenolic composition and chromatic characteristics in young red wines. Eur. Food Res. Technol. 231(5), 789802. [ Links ]
Trejo-Pech, C.O., Arellano-Sada, R., Coelho, A.M. & Weldon, R.N., 2012. Is the Baja California, Mexico, wine industry a cluster? Am. J. Agric. Econ. 94(2), 569-575. [ Links ]
Villano, D., Fernández-Pachón, M.S., Troncoso, A.M. & García-Parrilla, M.C., 2006. Influence of enological practices on the antioxidant activity of wines. Food Chem. 95(3), 394-404. [ Links ]
Zanoni, B., Siliani, S., Canuti, V., Rosi, I. & Bertuccioli, M., 2010. A kinetic study on extraction and transformation phenomena of phenolic compounds during red wine fermentation. Int. J. Food Sci. Technol. 45(10), 2080-2088. [ Links ]
Submitted for publication: November 2019
Accepted for publication: March 2020
* Corresponding author: E-mail address: ealvarez@uacj.mx

