


Services on Demand
Article
 English (pdf)
 Article in xml format
 Article references
Indicators

Related links
-
 Cited by Google
 -
 Similars in Google
Share

 Permalink
South African Journal of Enology and Viticulture
On-line version ISSN 2224-7904
Print version ISSN 0253-939X
S. Afr. J. Enol. Vitic. vol.41 n.1 Stellenbosch 2020
http://dx.doi.org/10.21548/41-1-3435
ARTICLES
Phenolic and Sensorial Evolution during Bottle Ageing of South African Shiraz Wines with Different Initial Phenolic Profiles
G. Garrido-Banuelos#; A. Buica W.J. du Toit*
Department of Viticulture and Oenology, Stellenbosch University, Private Bag X1, Matieland 7062, South Africa
ABSTRACT
The aim of this research was to evaluate the colour and phenolic evolution of Shiraz red wines made from the same vineyard, but with different initial phenolic profiles. Several vineyard-related variables were initially evaluated in a first vintage (2014), but grape ripeness was shown to be the most determining factor on most of the phenolics and the taste and mouthfeel of the wines. In the second vintage (2015), wines made from four different ripeness levels were aged up to 18 months and periodically analysed during this period. The results show how Shiraz wines with different initial phenolic profiles might develop differently over time during bottle ageing. In the second vintage, some of the colour and phenolic parameters of the wines were similar after completing the alcoholic fermentation (AF). However, these small differences between the wines became more noticeable over time, especially when comparing the wines made from the highest sugar level with the rest. These differences were especially noticeable in the polymeric fraction (polymeric phenols and polymeric pigments), with a larger number of polymeric forms found in the wines made from the ripest berries, and subsequently a larger formation of polymeric pigments. Differences in the wines' phenolic composition, and the differences in the alcohol content of the wines, also influenced the taste and mouthfeel evaluation of the wines, and these were maintained over time.
Key words: Red wine, phenolics, grape ripeness, bottle ageing, colour, mouthfeel
INTRODUCTION
The use of different winemaking techniques (Marais, 2003; Smith et al., 2015), as well as environmental factors and different vineyard management practices (Wolf et al., 2003), are well known for influencing the colour, taste and mouthfeel of a red wine.
The colour in young red wine is mainly due to anthocyanins, which are extracted from the grape skins. However, as the wine ages, monomeric anthocyanin levels decrease as a consequence of the formation of new pigmented polymeric compounds (He et al., 2012a, 2012b). Subsequently, the increase in concentration of these polymeric forms is positively correlated with increased wine colour stability. Additionally, grape tannins also contribute to the wine's colour stabilisation. Initially, the formation of these new compounds can be explained by different reactions involving self-association or by the interaction between anthocyanins and tannins (Somers, 1971; Singleton & Trousdale, 1992; Remy et al., 2000; Monagas et al.,, 2005). Therefore, a decrease in monomeric flavan-3-ol levels is also observed (Gómez-Gallego et al., 2013) as larger proanthocyanidins are formed (He et al., 2008). In short, a large number of direct or mediated condensation reactions between the different groups of phenolics occur over time in red wine (Timberlake & Bridle, 1976; Wang et al., 2003; Monagas et al., 2005). As a consequence, the phenolic profile of young red wine can change drastically during ageing.
The initial grape phenolic composition is of great importance to the wine producer. Differences in grape phenolic profiles and content between cultivars have been reported extensively by several authors (Ryan & Revilla, 2003; Pérez-Magarino & González-SanJosé, 2004; Pérez-Lamela et al., 2007; Obreque-Slier et al., 2013). The climate, soil characteristics and different vineyard practices can also drastically influence the levels of phenolics in red grapes. Altering the canopy has been shown to change the yield and the bunch light exposure, thereby affecting berry development and subsequent phenolic accumulation (Reynolds & Van Heuvel, 2009; Rio Segade et al., 2009). Similarly, vine vigour has also been shown to influence the pigment content in grapes and the corresponding wines (Cortell et al., 2007a, 2007b).
The harvest date is also very important, since different groups of phenolic compounds are synthesised and accumulated at different rates during berry ripening (Kennedy et al., 2000, 2001; Adams, 2006; Fournand et al., 2006). However, these variables may have an impact on grape phenolics, which it is not always necessarily reflected in the phenolic composition of young wines (Garrido-Banuelos et al., 2015). Likewise, compositional and structural changes occurring in the grape cell walls during ripening will modulate the phenolic extractability (Nunan et al., 1998; Bindon & Kennedy, 2011; Garrido-Banuelos et al., 2019a, 2019b). Many studies have thus focused on the impact of ripening on the phenolic composition of grapes, skins and seeds (Kennedy et al., 2000; Harbertson et al., 2002; Canals et al., 2005; Obreque-Slier et al., 2010b; Bordiga et al., 2011; Gil-Munoz et al., 2011; Asproudi et al., 2015; Quijada-Morín et al., 2016) and in young wines (Cadot et al., 2012; Bindon et al., 2014a; Pace et al., 2014), but there is limited information about how different grape ripeness levels influence the colour and phenolic evolution over time. Winemakers should be aware that, despite the greater extraction of certain compounds, the use of overripe grapes may have a negative effect on the wine quality.
Different studies have evaluated the impact of different vineyard treatments (Mota et al., 2011; Van Noordwyk, 2012; Song et al., 2014; De Beer et al., 2017) and ripeness (Cadot et al., 2012; Bindon et al., 2014a) on the colour and phenolic composition. All these variables have been proven to alter the phenolic composition in grapes, and therefore the initial phenolic composition of young wines. However, limited information is available on the phenolic and sensorial evolution over time of red wines made from grapes with different initial phenolic profiles (Pérez-Magarino & González-SanJosé, 2004; Llaudy et al., 2006). The phenolic evolution of a wine is also of crucial importance for its sensory properties, as these compounds contribute to the astringent and bitter characteristics of the wine (Gawel, 1998; Gómez-Gallego et al., 2013; Ma et al., 2014), but also influencing the release of the volatile fraction of the wines, and thus its sensory properties (Aronson & Ebeler, 2004).
In the present study, the aim was to assess the colour, phenolic and sensorial evolution of small-scale red wines made from the same vineyard, but with different initial grape phenolic levels. The first harvest season, 2014, was used as an exploratory study to evaluate the effect of certain vineyard-related factors. From the results obtained in 2014, the following harvest season (2015) focused on the impact of grape ripeness on the grape and wine phenolic content, and their subsequent evolution during 18 months of bottle storage.
MATERIALS AND METHODS
Vineyard characteristics
The present study was conducted in two consecutive harvest seasons (2014 and 2015) at the Welgevallen experimental farm of the Department of Viticulture and Oenology of Stellenbosch University (GPS coordinates: 33°56'25.0"S 18°51'56.4"E), in a well-characterised Vitis vinifera L. cv. Shiraz vineyard grafted on 101-14Mgt rootstocks, clone SH9c, with a North-South row direction.
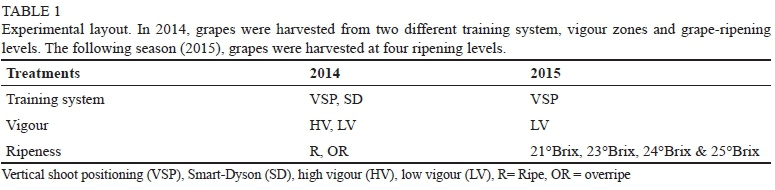
As mentioned, the first season was an exploratory study. Thus, in 2014, Shiraz grapes were harvested from two different training systems - vertical shoot positioning (VPS) and Smart-Dyson (SD). Additionally, the study included two other variables, vine vigour and grape ripeness, which might also affect the grape phenolic composition and the corresponding wines. In 2014, two different training systems were thus studied, VSP and SD, in two different vigour areas (Table 1). Part of the VSP training system in the Shiraz had previously been converted (during the 2011/2012 growing season) into an SD training system. Both training systems were distributed in parallel rows along the vineyard block. The vine vigour was visually assessed by dividing the vineyard block into two zones: high vigour (HV) and low vigour (LV). Each of the four treatments were harvested at two different grape maturity stages (ripe - R - at an average of 23.2°Brix, and overripe - OR - at an average of 26.0°Brix). To maintain the intra-vineyard variability throughout ripeness, a similar number of vines were randomly selected to obtain 120 kg of harvested grapes for each treatment (VSP-LV, VSP-HV, SD-LV, SD-HV). All treatments were harvested by hand, collected in plastic boxes and immediately transported to the experimental cellar of the Department of Viticulture and Oenology of Stellenbosch University.
In 2015, it was decided to focus on more ripeness levels and, due to logistical limitations, to only use grapes harvested at four grape-ripening levels from the VSP training system (low-vigour area) (Table 1).
Winemaking procedures
All small-scale wines were made in triplicate following the standard winemaking procedure at the experimental cellar of the Department of Viticulture and Oenology at Stellenbosch University. Once in the cellar, the possible intra-vineyard variability between rows needed to be reduced. To achieve this, grape bunches from the same vineyard treatment (120 kg) were mixed in the cellar and subsequently separated into triplicates of 40 kg used per fermentation. Prior to yeast inoculation, 30 mg/L SO2 was added to the destemmed grapes and the total acidity was adjusted to 6.0 g/L using tartaric acid (natural L-(+)-tartaric). All musts were co-inoculated with 0.3 g/L of Saccharomyces cerevisiae D21 (Lallemand) and, 24 hours later - once alcoholic fermentation (AF) had started, with 0.01 g/L Oenococcus oeni VP41 (Lallemand) for the subsequent malolactic fermentation (MLF).
Alcoholic fermentations were carried out in plastic buckets at 25°C. Punch-downs were performed manually three times per day, and 0.3 g/L of DAP (diammonium phosphate) was only added two days after the beginning of the fermentation. The progression of fermentation was monitored by using a balling meter and fermented until dryness (residual sugar < 4 g/L). All grape skins were pressed in a basket press after fermentation, the press and free-run wine were combined, and the wines were stored in steel canisters at 20°C until malic acid levels were lower than 0.2 g/L, monitored with a WineScan FT 120 (FOSS Analytical, Hillerod, Denmark). Once MLF was completed, the wines were racked off and 60 mg/L of SO2 was added. All the wines underwent subsequent cold stabilisation, with no addition of fining agents, at -4°C for three weeks before their total SO2 levels were adjusted to 60 mg/L and they were bottled in green 750 mL bottles under screw caps. The bottled wines were stored in a dark storage room under controlled temperature (15°C) until chemical analysis and sensory evaluation were performed.
Colour and phenolic measurements
Spectrophotometry analysis
Wine samples were initially analysed right before bottling, once cold stabilisation had been completed, and this was considered the time 0 (T0) of bottle storage. Afterwards, the wines were analysed once every six months (M). A new bottle was opened for every set of analyses. In 2014, the colour and phenolic content of the different wines samples were analysed up to 24 months (24M) in bottle. In 2015, the wine samples were only analysed up to 18 months (18M) of storage, and an additional sampling stage was added after the completion of alcoholic fermentation (AF).
Different colour and phenolic parameters, such as colour density (CD), modified colour density (MCD), copigment content, SO2-resistant pigments, total red pigments (TRP) and total phenolics (TP) were measured in the wines by spectrophotometric analysis using Boulton indexes (Somers & Evans, 1974; Boulton, 2001). Wine tannin content was determined by the methyl cellulose precipitation (MCP) method (Sarneckis et al., 2006) and the results expressed as mg/L catechin equivalents.
HPLC analysis
Monomeric and polymeric phenolic compounds were individually quantified from time 0 every six months (from T0 up to 24M in 2014, and from AF to 18M in 2015) using the HPLC method described in Garrido-Banuelos et al. (2019a). Wine samples were centrifuged for 5 min at 8 000 rpm and the supernatant was injected. The separation was carried out on a polystyrene/divinylbenzene reverse-phase chromatographic column (PLRP-S, 150 cm x 4.6 mm, Agilent). The mobile phases used were 1.5% v/v ortho-phosphoric acid in de-ionised water (mobile phase A) and acetonitrile (mobile phase B). The linear gradient used was the following: from 0 min to 55 min, 5% to 22% mobile phase B; from 55 min to 59 min, 22% mobile phase B isocratic; from 59 min to 64 min, 22% to 56% mobile phase B; maintained at 56% mobile phase B for the remainder of the run. The flow rate was 1 ml/min at a constant temperature of 35°C. The injection volume was 20 µl.
Data processing was carried out with Agilent ChemStation software (Agilent Technologies). The identification of the compounds was done based on the retention times of standards and the UV-Vis spectra (acquired by injection of standards or from the literature). The method thus allowed quantification at four different wavelengths -280 nm for flavan-3-ol and polymeric phenols, 320 nm for hydroxycinnamic acids, 360 nm for flavonols, and 520 nm for the anthocyanins and pigments. To simplify the large set of data, certain individual compounds were grouped, namely total hydroxycinnamic acids, total flavonols, total glucosylated anthocyanins, total acetylated anthocyanins and total coumaroylated anthocyanins.
Sensory analysis
All wines from both seasons, 2014 and 2015, were evaluated over time in order to assess the ageing effect from a sensory perspective. The wines were subjected to descriptive analysis (DA) after 6M and 12M of storage in bottles. Before every sensory evaluation, all wines were screened by wine experts from the Department of Viticulture and Oenology at Stellenbosch University. Reducing the number of samples, experts selected two out of the three biological repeats to be evaluated by the sensory panel. The DA method is used to individually describe the wine samples, and the results therefore can quantitatively express the perceived sensory differences between samples (Lawless & Heymann, 2010). Sensory evaluations were performed by a group of panellists (11 and 12 panellists in 2014 and 9 and 10 panellists in 2015 for the analysis after 6M and 12M respectively) who were trained on red wine taste and mouthfeel attributes. Training of the panel required periods of four to five weeks in a two-hour session, three times a week. During the first two sessions, the panellists were trained with standards (Appendix 1) for the different taste and mouthfeel attributes. From the third session, the panellists were trained and familiarised with the actual wines.
Wine samples were served in standard ISO (International Organization for Standardization) dark wine-tasting glasses (ISO, 1977), with each glass containing 25 mL of wine. Each sample was coded with a three-digit random code and served in a completely randomised order (Lawless & Heymann, 2010). The panellists rated all taste and mouthfeel attributes on a 0- to 100-line scale. They performed the evaluation in individual booths, with each booth being fitted with a data collecting system (Compusense® five, Version 5.2, Compusense Inc., Guelph, Ontario, Canada). The testing area was light and temperature controlled (21°C).
Statistical analysis
All analyses were carried out using Statistica 13.2 (TIBCO Statistica software, Palo Alto, CA, USA). Mixed-model repeated-measures ANOVAs were used and Fisher's least significant difference (LSD) corrections were used for post hoc analyses. Significant differences were judged on a 95% significance level (p < 0.05). PanelCheck software (V 1.4.0, Nofima Mat, Norway) was used to weigh the panellists' performance for the wine sensory evaluation and to generate STATIS biplots based on covariance. The distribution of certain chemical and sensory datasets was analysed with principal component analysis (PCA) using SIMCA 14.1 software (Sartorium Stedim Biotech - Malmö, Sweden).
RESULTS AND DISCUSSION
The results from the two vintages are presented and discussed separately. As mentioned previously, 2014 was an exploratory study to investigate the main vineyard-related variables influencing the initial phenolic content of the wine made from this vineyard and will thus only be presented briefly.
Phenolic and sensorial evolution of 2014 wines
Colour and phenolic evolution of 2014 wines
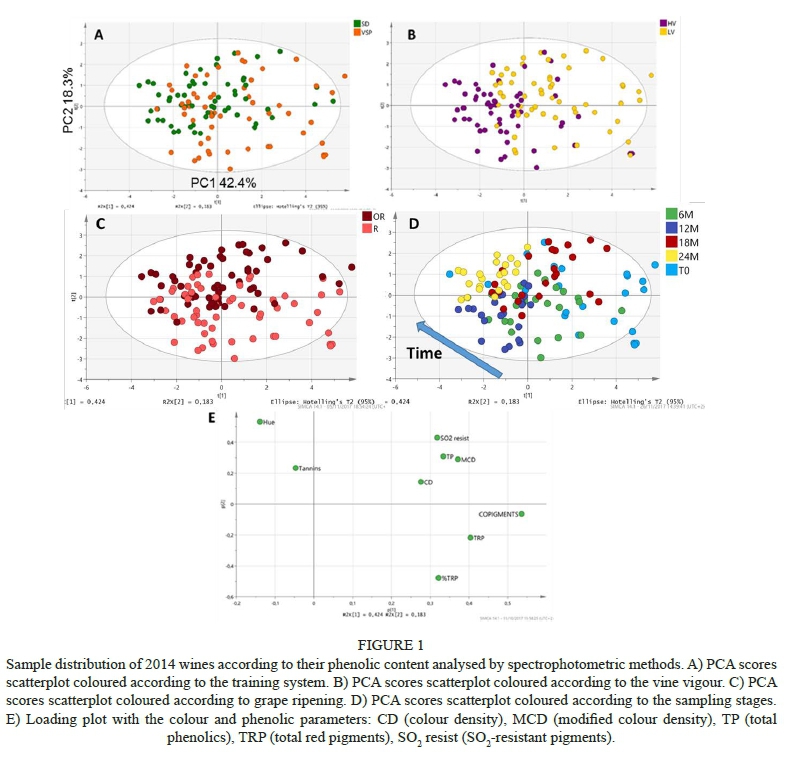
As the 2014 wine aged, the multivariate test of significance showed that grape ripeness and time of sampling were the most important factors influencing phenolic evolution assessed spectrophotometrically (Fig. 1). The PCA loading plot (Fig. 1E) shows cumulative effects of the different variables in the sample distribution according to their colour and phenolic parameters analysed. The wines made from OR grapes were distributed along PC2 (18.3%), mainly characterised by a higher number of tannins but also hue, TP, and SO2-resistant pigments (Fig. 1C). However, these differences between treatments were found to reduce over time (Fig. 1D), in contrast to the results found by De Beer et al. (2017). Over the course of time, lower CD, TRP and copigment values were found in the older wines compared to the young wines, whereas the hue and tannin levels increased (Fig. 1D & 1E).
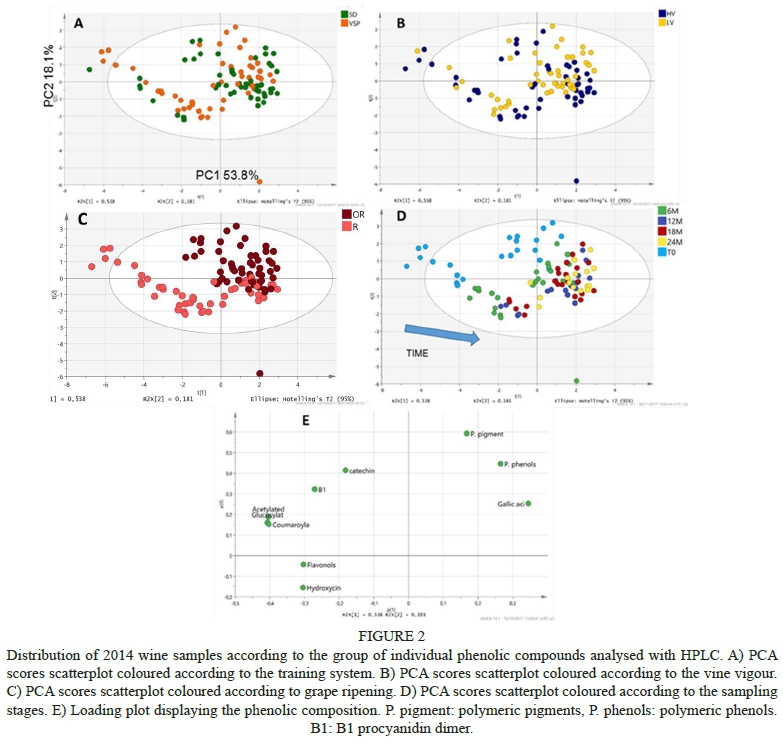
These separations between treatments were also observed when individual phenolics were analysed (Fig. 2). Grape ripeness, together with the time of sampling, also played a larger role than training system and vigour in affecting the overall individual phenolic profile of the wines over time (Appendix 2). Wines from OR were characterised by a higher amount of polymeric forms (Fig. 2C), both as polymeric phenols and polymeric pigments, and lower values of total hydroxycinnamic acids. During ageing, almost all of the wines distributed to the positive side of PC1 (Fig. 2D), characterised by a lower concentration of glucosylated, acetylated and coumaroylated anthocyanins, which is in agreement with the literature (Somers & Evans, 1979; Pérez-Magarino & González-SanJosé, 2004; Boido, et al., 2006). Additionally, as shown in Fig. 2D, differences between treatments found in the grapes and young wines became smaller over time, as the wine samples were more closely distributed along the PC1 axis after ageing.
Sensory evaluation of 2014 wines
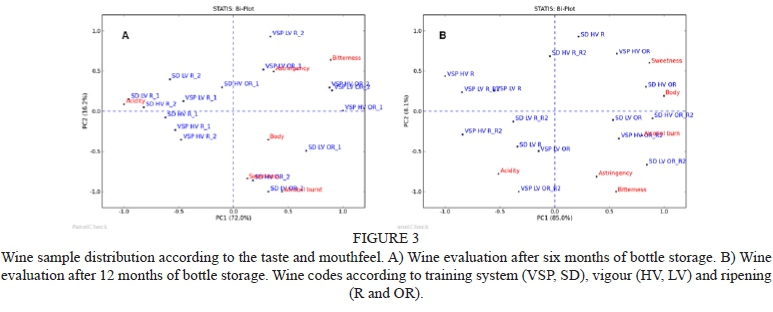
Grape ripeness again seemed to have played the largest role in the taste and mouthfeel perception after 6M and 12M of storage. Thus, as illustrated in Fig. 3A, after 6M, the wine samples were separated along the PC1 axis (72%), mainly based on the differences between acidity and the rest of the attributes. Thus, most of the R wines (including all four training and vigour treatments) were described as being higher in acidity. On the other hand, the wines made from OR berries were often described as being more bitter and having more body (Appendix 3 and Appendix 4). However, astringency did not show an increase with ripening, except for the VSP HV wines (Appendix Table 3). The trends between 6M and 12M remained relatively stable, with the grape ripeness level being the main driver along the PC1 axis (72% in Fig. 3A and 85% in Fig. 3B). These findings agree with previous studies on the impact of different training systems on the astringency and bitterness of the wines made from the same vineyard (Van Noordwyk, 2012; De Beer, 2015).
These results, together with the phenolic findings, led to a further investigation of the effects of grape ripeness on the colour, phenolic and sensorial composition of Shiraz wines and their subsequent evolution over time in the following year.
Phenolic and sensorial evolution of 2015 wines
Colour and phenolic evolution of 2015 wines
In 2015, with the objective of assessing the ripeness effect in young wines, the analysis of the colour and phenolic compounds was also done after the alcoholic fermentation (AF). At AF, only the hue and the MCP tannin concentration were not significantly affected by grape ripeness (Appendix 5). In terms of individual phenolic compounds measured by HPLC, only gallic acid, catechin and the B1 procyanidins were not significantly influenced by the ripeness at AF (Appendix 6). From this stage, storage time also played a significant role in the colour and phenolic evolution.
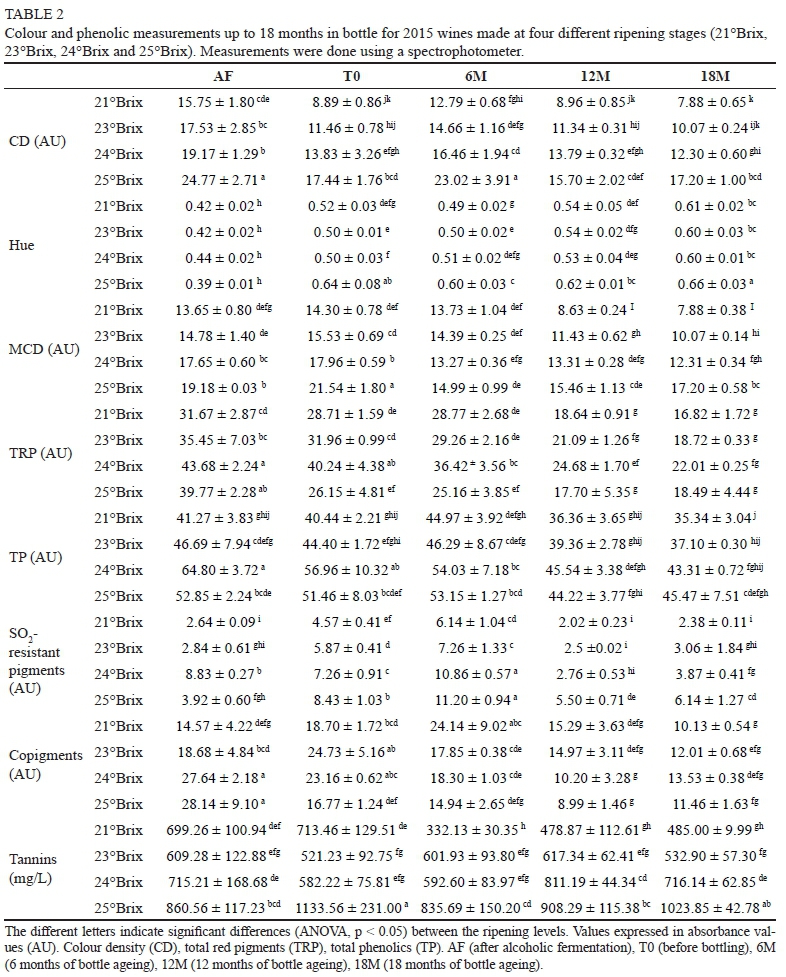
The evolution of colour and phenolics, up to 18M of storage, is shown in Table 2. Time and grape ripeness both played a role in the wines' colour and phenolic composition (Appendix 7). Total red pigments (TRP), SO2-resistant pigments and copigments were highly influenced by time. On the other hand, although time was also significant, the TP content and, especially, the MCP tannin levels, were strongly influenced by the different degrees of ripeness (Appendix 8). Comparing the chromatic parameters of the AF wines with the 18M wines, a significant decrease was found in the CD, TRP and copigments, with the exception of the level of copigments in wines made from 21°Brix grapes (Table 2). However, the amount of SO2-resistant pigments showed different trends over this period. The concentration of these pigments remained relatively constant for wines made from 21°Brix and 23°Brix grapes, whereas they decreased in wines made from 24°Brix grapes and increased in the wines made from 25°Brix grapes. The overall colour and phenolic evolution is also shown in Fig. 4. Samples were distributed along the PC1 axis (47.9%) according to the grape ripeness (Fig. 4A). Wines made from 21°Brix, 23°Brix and 24°Brix grapes were found mostly on the negative side of axis 1, whereas wines made from 25°Brix grapes were found mostly on the positive axis of PC1. At the AF stage, wines made from 25°Brix grapes were found closely distributed with those made from the lower grape-ripeness levels. Additionally, along PC2 (27.4%), the samples were separated according to the sampling stage (Fig. 4B). From the loading plot (Fig. 4C), one can observe a general decrease in colour density, TRP, TP, CD copigments and SO2-resistant pigments, with an increase in hue.
As occurred in the 2014 data, some of the phenolic differences found in young wines made from different grape ripeness levels became smaller over time. As an example, no significant differences were found in the TRP levels between all the wines after the decrease that occurred from AF to 18M. Similarly, the copigment concentration decreased significantly from AF to 18M, except for the wines made from 21 °Brix grapes. Boulton (2001) also states that the co-pigmentation effect decreases over time. The differences in the concentration of copigments found in young wines, initially higher in wines made from 24°Brix and 25°Brix grapes when compared to those from 21 ° and 23°Brix grapes, became statistically insignificant after 12M. This decrease in concentration of copigments in the wines made from riper grapes may be linked partially to the formation of more SO2-resistant pigments over time that replaced these copigments (Somers, 1971; Bindon et al., 2014b). However, the concentration of the SO2-resistant pigments reached their peak level after six months of bottle storage in all the wines, and became drastically reduced after this (Table 2), presumably as a consequence of precipitation. All the wines thus could have had a limited number of cofactors, which may explain the similar levels of copigments after 18M in all the treatments.
However, these decreases in pigment concentration did not always affect the amount of TP. The amount of TP remained relatively constant over time in the wines made from 21°Brix berries. On the other hand, the rest of the wines (made from 23°, 24°Brix and 25°Brix grapes) showed a decrease over time, being not always significant in the case of the wines made from 25°Brix grapes.
Regarding MCP tannin levels, AF wines made from riper grapes had a higher tannin content (Appendix 8), which was also found by Bindon et al. (2013). However, this was only significant when wines made from 23°Brix and 25°Brix grapes were compared (Table 2). Over the course of time, although the tannin evolution was relatively constant in all wines - except for those made from 21°Brix grapes (Table 2), these small differences found at AF between the wines became larger over time. These differences may be related not only to the total tannin concentration, but also to the formation of different polymers. Although it remains unce tain, the tannin size and polymer conformation may possibly affect tannin binding and subsequent precipitation with MCP, as it was shown to occur with the BSA tannin-precipitation method (Harbertson et al., 2014).
These results disagree with a similar study by Bindon et al. (2013), as the tannins levels found in wines made from the last harvest were not always significantly higher. However, the results of the current study also suggest a higher tannin value as the harvest advanced, which manifest especially after prolonged wine ageing.
Individual phenolic compounds of 2015 wines
Grape ripeness and ageing both had significant effects on the evolution of the individual phenolic compounds (Appendix 9) as determined by HPLC (Table 3). In Fig. 5B, the wine samples distributed along the PC1 (52.7%) according to the time of sampling. Wine samples at AF, MLF and after 6M were mostly found on the negative side of PC1, whereas wines after 12M and 18M in the bottle were found on the positive side. As expected, as the wines aged they were characterised by a lower free anthocyanin content, with an increase in polymer fractions. These results agree with the findings of Pérez-Magarino and González-San José (2004). However, and similarly to the spectrophotometric phenolic results, wines made from 25°Brix grapes showed a different pattern of evolution when compared to the other three ripeness stages, especially from MLF onwards.
These differences were explained mainly by the concentration of polymeric phenols and polymeric pigments in the wines. Both parameters were especially influenced by grape ripeness (Appendix 10). In short, a larger concentration of polymeric phenols and polymeric pigments was found in the wines made from 25°Brix grapes, and these were already significant at AF (Table 3). Thereby, these results show a greater extractability of larger molecules during grape ripeness, which are released into the wine, in contrast o the findings of some authors (Obreque-Slier et al., 2010b; Bautista-Ortín et al., 2012). From AF, different trends were also observed in the different wines during bottle ageing (Table 3). Whereas the polymeric phenol concentration in the wines made from grapes at 21°Brix, 23°Brix and 24°Brix showed a decrease from AF to MLF, followed by relatively constant levels during bottle ageing, the amount of polymeric phenols in wines made from 25°Brix increased from AF to 6M in the bottle, followed by a final decrease. This decrease, which was found after 12M of storage in wines made from grapes at 25°Brix, is probably due to over-polymerisation reactions and the subsequent precipitation of insoluble compounds. On the other hand, the amount of polymeric pigments in young wines (AF) was not significantly higher in those wines made from 25°Brix grapes compared to those made from grapes at 23°Brix and 24°Brix (Table 3). Only over time did the wines made from 25°Brix grapes experience a significant increase in polymeric pigments during bottle storage. This greater formation of polymeric pigments is probably linked to the quicker degradation of free anthocyanins (glucosylated, acetylated and coumaroylated anthocyanins) occurring in the wines made from 25°Brix grapes (Table 3 and Fig. 5). These trends may be explained by a greater proanthocyanidin concentration in the wine matrix, and therefore higher availability to react with the monomeric anthocyanins and form these polymeric pigments (Singleton & Trousdale, 1992; He et al., 2012b) in the wines made from the ripest grapes.
Additionally, an increase in gallic acid was observed over time (Table 3). Although the difference between wine treatments in young wines (AF) were not significant, a greater concentration of gallic acid was found in the wines made from 25°Brix grapes after MLF. Over the course of time (after 12M), this difference became insignificant when compared to 24°Brix. Gallic acid is indirectly related to wine colour and polymeric pigment formation (Liu et al., 2016). The increase, observed in all our wines, may be due to the dissociation of certain compounds. It is known that gallic acid can be found as the galloyl unit from galloylated proanthocyanidins, but it can also act as a cofactor in the wine (Boulton, 2001; Liu et al., 2016). Firstly, the liberation of gallic acid could come from the breakdown or hydrolysis of galloylated proanthocyanidins. However, this release has not been proven in wine (Prieur et al., 1994). Secondly, the gallic acid could be released by the hydrolysis of wine copigments. Thus, the drop in wine copigments from AF to MLF, and especially prevalent in the 25°Brix wines (Table 2), may be linked to the increase in gallic acid concentrations and the increase in polymeric pigments levels during the same period (Table 3).
Other phenolic compounds, such as hydroxycinnamic acids and flavonols, were greatly influenced by time as well as grape ripeness (Appendix 10). Similarly to gallic acid, the increase in the total concentration of hydroxycinnamic acids can be explained by the hydrolysis of these copigments, thereby liberating acids into the wine. As described in the literature, these compounds play an essential role not only in the concentration of copigmentation complexes, but also in the formation of pyroanthocyanins over time (Darias-Martín et al., 2002; Gómez-Gallego et al., 2013) during the ageing of red wines (Hermosín-Gutiérrez, et al., 2005). After 18M, the greatest total hydroxycinnamic acid concentration was found in the wines made from 24°Brix grapes, followed by those from 21 °Brix and 25°Brix grapes. Thus, these results show no clear trend between the increase in grape ripeness and the higher hydroxycinnamic acid levels over time.
In contrast, the concentration of total flavonols declined over time (Table 3). The concentration of these compounds was initially higher in wines made from 24°Brix and 25°Brix grapes. However, their loss over the course of time was quicker in wines made from 25°Brix grapes. By the end of MLF, the flavonol content had dropped significantly in wines made from 25°Brix grapes. On the other hand, wines made from grapes at the other three ripeness levels (21 °Brix, 23°Brix and 24°Brix) experienced only a significant loss after 12M of storage.
Altogether, the HPLC results indicate the influence of grape ripeness on the release of specific phenolic compounds, which may be more difficult to extract at lower ripeness levels. The changes occurring in the grape skin cell walls during grape ripeness may be linked to the release of these compounds (Garrido-Banuelos et al., 2019a). In short, higher grape ripeness levels can lead to the extraction of larger polymeric phenolic-derived compounds, which may be involved in the formation of more stable compounds over time during wine ageing. It thus seems that this process of condensation between tannins and anthocyanins during wine ageing will be enhanced further when riper grapes are used. Recent studies have shown that phenolic extractability is linked to the level of cell wall deconstruction during ripeness (Garrido-Banuelos et al., 2019a). However, this cell wall deconstruction during ripeness is affected by the vintage (Garrido-Banuelos et al., 2019b). These cell wall proteins and polysaccharides are released into the wines during maceration (Guadalupe & Ayestarán, 2007), thereby affecting the phenolic interactions (Riou et al., 2002) and the sesory perception (Vidal et al., 2004). However, little is known about the interaction of these structural proteins and polysaccharides with the rest of the components in the wine matrix (Watrelot et al., 2017) and how this is reflected on the sensory evolution of the wines over time. It therefore seems essential to understand the depectination level of the grapes, as this will influence the phenolic extractability and, indirectly, the ageing of the wines.
Sensory evolution of 2015 wines
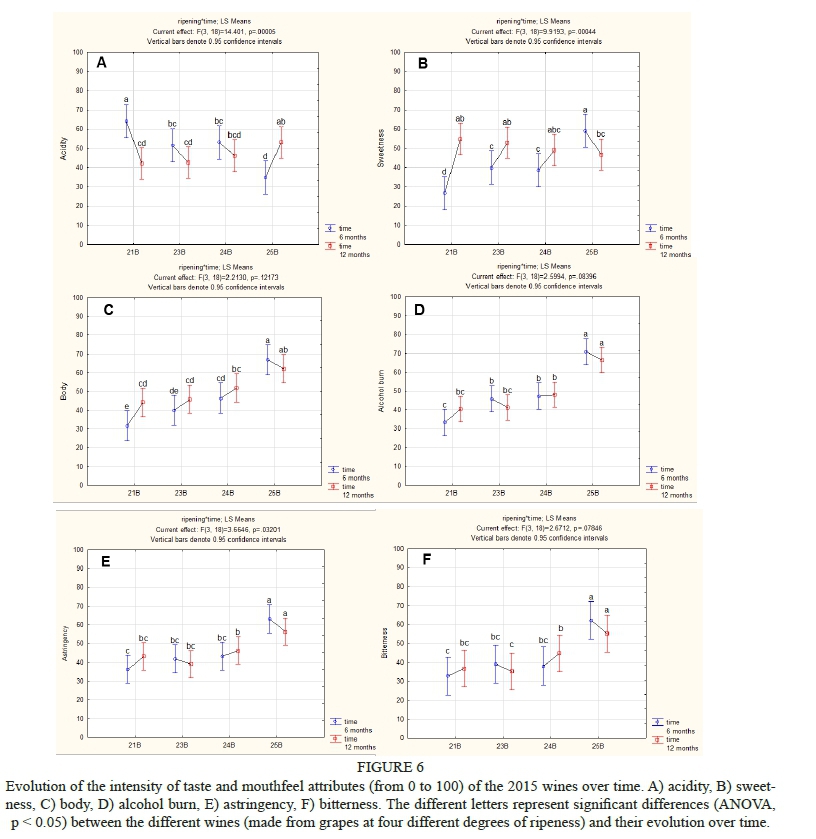
As seen previously in relation to the 2014 wines, grape ripeness again played a significant role in the sensory results in 2015. All attributes evaluated by the panellists (except the acidity) were significantly different and highly influenced by the grape ripeness as a single factor (Appendix 11). Fig. 6 illustrates the differences in the intensity of the taste and mouthfeel attributes evaluated after 6M and 12M. Firstly, a clear trend is observed from the wines made from less-ripe grapes (made from 21 °Brix grapes), described as being more sour, less astringent or bitter, and with a lower body (significant when compared to wines made from 25°Brix grapes), compared to wines made from riper grapes. No significant changes in the alcohol burn, astringency, bitterness and body (except for wines made from 21 °Brix grapes, where the body of the wines increased significantly) were found in all the wines from 6M to 12M (Fig. 6). On the other hand, the acidity showed a significant decrease in the case of wines made with 21 °Brix grapes, but it increased in wines made from 25°Brix grapes. The opposite trend was observed for the sweetness taste of the wines (Fig. 6B).
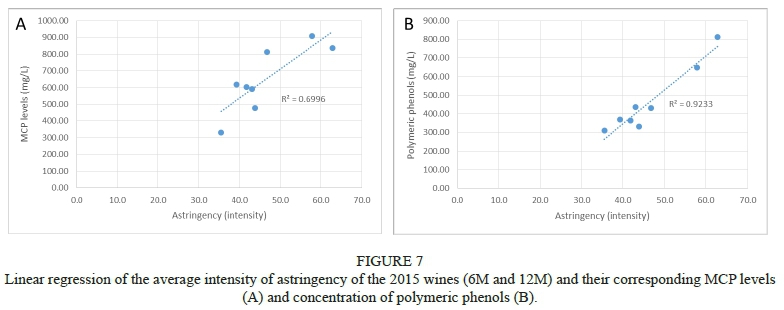
Overall, similar results were reported in the literature regarding higher astringency and bitterness perception (Cadot et al., 2012; Bindon et al., 2014a), but also with a greater body structure (Van Noordwyk, 2012) in wines made from riper grapes. Astringency is driven mainly by the tannin concentration, and especially due to its polymeric forms (McRae & Kennedy, 2011), whereas bitterness is related more directly to the presence of galloylated tannins (mainly extracted from the seeds), but also other flavonoids, such as flavan-3-ols and flavonols (Peleg et al., 1999; Hufnagel & Hofmann, 2008; Sáenz-Navajas et al., 2010) and anthocyanin-derived pigments (Sáenz-Navajas et al., 2017). The larger concentrations of tannins, gallic acid, polymeric phenols and polymeric pigments in the wines made from 25°Brix grapes probably played a role in the greater perception of astringent and bitter taste of these wines. As shown in Fig. 7, the intensity of astringency in our wines correlated with the amount of MCP tannins (R2 = 0.69) and the concentration of polymeric phenols (R2 = 0.92), which correlates with similar findings by Mihnea et al. (2019) for South African red wines.
After xi and 12 months, the concentration of MCP tannins was not significantly higher in wines made from 25°Brix grapes when compared to the ones made from 24°Brix grapes, but the wines were rated significantly higher in bitterness and astringency (Table 2 and Fig. 6). This can be explained by the interaction between the phenolic and non-phenolic components of each wine matrix. As an example, higher ethanol levels have been shown to increase the tannin-salivary protein interaction and therefore the astringency perception of wines (Obreque-Slier et al., 2010a), as well as to enhance the bitterness in white wines (Cretin et al., 2018). Thus, differences in the alcohol levels between the wines made from 25°Brix and those from 24°Brix grapes (Appendix 12) may have enhanced the astringent perception of the wines. Unfortunately, none of the current methods used for this project allowed us to further investigate the proanthocyanidins in terms of their complexity or composition.
These results could vary between different, grape cultivars and types of storage, but this study supplements the little information available in the literature linked to the evolution of colour and phenolic compounds in red wines made from the same vineyard over time (Pérez-Magarino & González-SanJosé, 2004, 2006).
CONCLUSIONS
The current study confirms the influence of different initial wine phenolic profiles on the colour, phenolic and sensorial evolution of wines during bottle ageing. More precisely, the present work has shown the influence of different stages of grape ripeness on Shiraz wine's phenolic and sensorial composition, and how these properties develop over time. It seems that, independently of vintage and the initial phenolic profile, a general loss of colour and monomeric anthocyanins can be expected in Shiraz wine over time. In parallel, the formation of polymeric phenols and polymeric pigments should occur. However, in wines produced with riper grapes, which can have higher levels of polymeric phenols and polymeric pigments, these compounds will probably also be higher after ageing. Thus, the present study highlights that a greater availability of tannins in solution (represented by polymeric phenols) in young wines might lead to a larger formation of polymeric pigments, and therefore a more stable wine colour over time. Information regarding the level of complexity and reactivity of the phenolic composition at AF could be valuable to the wine producer to assess the impact of these different initial phenolic profiles during bottle ageing. From a sensory perspective, the impact of grape ripeness was seen in the taste and mouthfeel of the wines, partly contributing to a higher body, and to a more bitter and astringent perception of the wines maintained over bottle ageing.
Nevertheless, the colour, phenolic and sensorial evolution of these wines may show different results with barrel ageing, as the wine matrix would be even more complex. This study could be relevant for the wine industry in aiming to better manage the extraction and modification of phenolics during the ageing of specific phenolic compounds with a positive impact on colour stability, as well as on the taste and mouthfeel properties of the wines.
LITERATURE CITED
Adams, D.O., 2006. Phenolics and ripening in grape berries. Am. J. Enol. Vitic. 57(3), 249-256. [ Links ]
Aronson, J.S. & Ebeler, S.E., 2004. Effect of polyphenol compounds on the headspace volatility of flavors. Am. J. Enol. Vitic. 55(1), 13-21. [ Links ]
Asproudi, A., Piano, F., Anselmi, G., Di Stefano, R., Bertolone, E. & Borsa, D., 2015. Proanthocyanidin composition and evolution during grape ripening as affected by variety: Nebbiolo and Barbera cv. J. Int. Sci. Vigne Vin 49, 59-69. [ Links ]
Bautista-Ortin, A.B., Rodriguez-Rodriguez, P., Gil-Munoz, R., Jiménez-Pascual, E., Busse-Valverde, N., Martinez-Cutillas, J.M. & Gómez-Plaza, E., 2012. Influence of berry ripeness on concentration, qualitative composition and extractability of grape seed tannins. Aust. J. Grape Wine Res. 18, 123-130. [ Links ]
De Beer, P., 2015. Grape and wine phenolic composition as a result of training system and canopy modification in Vitis vinifera L. cv. Shiraz. MSc Thesis. Stellenbosch University, Private Bag X1, 7602 Matieland (Stellenbosch), South Africa. [ Links ]
De Beer, P., Strever, A. & Du Toit, W., 2017. Do differences in the colour and phenolic composition of young Shiraz wines reflect during ageing? S. Afr. J. Enol. Vitic. 38(1), 29-34. [ Links ]
Bindon, K.A. & Kennedy, J.A., 2011. Ripening-induced changes in grape skin proanthocyanidins modify their interaction with cell walls. J. Agric. Food Chem. 59, 2696-2707. [ Links ]
Bindon, K.A., Holt, H., Williamson, P.O., Varela, C., Herderich, M. & Francis, I.L., 2014a. Relationships between harvest time and wine composition in Vitis vinifera L. cv. Cabernet Sauvignon 2. Wine sensory properties and consumer preference. Food Chem. 154, 90-101. [ Links ]
Bindon, K.A., Varela, C., Kennedy, J.A., Holt, H. & Herderich, M., 2013. Relationships between harvest time and wine composition in Vitis vinifera L. cv. Cabernet Sauvignon 1. Grape and wine chemistry. Food Chem. 138(2-3), 1696-1705. [ Links ]
Bindon, K.A., McCarthy, M.G. & Smith, P.A., 2014b. Development of wine colour and non-bleachable pigments during the fermentation and ageing of (Vitis vinifera L. cv.) Cabernet Sauvignon wines differing in anthocyanin and tannin concentration. LWT - Food Sci. Technol. 59(2), 923-932. [ Links ]
Boido, E., Alcalde-Eon, C., Carrau, F., Dellacassa, E. & Rivas-Gonzalo, J.C., 2006. Aging effect on the pigment composition and color of Vitis vinifera L. cv. Tannat wines. Contribution of the main pigment families to wine color. J. Agric. Food Chem. 54(18), 6692-6704. [ Links ]
Bordiga, M., Travaglia, F., Locatelli, M., Coïsson, J.D. & Arlorio, M., 2011. Characterisation of polymeric skin and seed proanthocyanidins during ripening in six Vitis vinifera L . cv. Food Chem. 127(1), 180-187. [ Links ]
Boulton, R., 2001. The copigmentation of anthocyanins and its role in the color of red wine: A critical review. Am. J. Enol. Vitic. 2, 67-87. [ Links ]
Cadot, Y., Caillé, S., Samson, A., Barbeau, G. & Cheynier, V., 2012. Sensory representation of typicality of Cabernet franc wines related to phenolic composition: Impact of ripening stage and maceration time. Anal. Chim. Acta 732, 91-99. [ Links ]
Canals, R., Llaudy, M.D.C., Valls, J., Canals, J.M. & Zamora, F., 2005. Influence of ethanol concentration on the extraction of color and phenolic compounds from the skin and seeds of Tempranillo grapes at different stages of ripening. J. Agric. Food Chem. 4019-4025. [ Links ]
Cortell, J.M., Halbleib, M., Gallagher, A., Righetti, T.L. & Kennedy, J.A., 2007a. Influence of vine vigor on grape (Vitis vinifera L. cv. Pinot Noir) anthocyanins. 2. Anthocyanins and pigmented polymers in wine. J. Agric. Food Chem. 55, 6585-6595. [ Links ]
Cortell, J.M., Halbleib, M., Gallagher, A., Righetti, T.L. & Kennedy, J.A., 2007b. Influence of vine vigor on grape (Vitis vinifera L. cv. Pinot Noir) anthocyanins. 1. Anthocyanin concentration and composition in fruit. J. Agric. Food Chem. 55, 6575-6587. [ Links ]
Cretin, B.N., Dubourdieu, D. & Marchal, A., 2018. Influence of ethanol content on sweetness and bitterness perception in dry wines. LWT - Food Sci. Technol. 87, 61-66. [ Links ]
Da Mota, R.V., De Amorim, D.A., Favero, A.C., Purgatto, E. & Regina, M.deA., 2011. Effect of trellising system on grape and wine composition of Syrah vines grown in the cerrado region of Minas Gerais. Ciênc. Tecnol. Aliment. 31(4), 967-972. [ Links ]
Darias-Martin, J., Martin-Luis, B., Carrillo-López, M., Lamuela-Raventós, R., Diaz-Romero, C. & Boulton, R., 2002. Effect of caffeic acid on the color in red wine. J. Agric. Food Chem. 53, 195-198. [ Links ]
Fournand, D., Vicens, A., Sidhoum, L., Souquet, J., Moutounet, M. & Cheynier, V., 2006. Accumulation and extractability of grape skin tannins and anthocyanins at different advanced physiological stages. J. Agric. Food Chem. 54, 7331-7338. [ Links ]
Garrido-Banuelos, G., Buica, A. & du Toit, W.J., 2015. Study of the colour and phenolic compounds in grapes and wines elaborated from two canopy treatments of Vitis vinifera L. cv Shiraz. In: Proc. 10th Int. Symp. Enol., Bordeaux. pp. 612 - 615. [ Links ]
Garrido-Banuelos, G., Buica, A., Schückel, J., Zietsman, A.J.J., Willats, W.G.T., Moore, J.P. & Du Toit, W.J., 2019b. Investigating the relationship between grape cell wall polysaccharide composition and the extractability of phenolic compounds into Shiraz wines. Part I: Vintage and ripeness. Food Chem. 278, 36-46. [ Links ]
Garrido-Banuelos, G., Buica, A., Schückel, J., Zietsman, A.J.J., Willats, W.G.T., Moore, J.P. & Du Toit, W.J., 2019a. Investigating the relationship between cell wall polysaccharide composition and the extractability of grape phenolic compounds into Shiraz wines. Part II: Extractability during fermentation into wines made from grapes of different ripeness levels. Food Chem. 278, 26-35. [ Links ]
Gawel, R., 1998. Red wine astringency: A review. Aust. J. Grape Wine Res. 4, 74-95. [ Links ]
Gil-Munoz, R., Moreno-Pérez, A., Vila-López, R., Fernández-Fernández, J.I. & Martinez-Cutillas, A., 2011. Determination of anthocyanin content in C.V Monastrell grapes during ripening period using several procedures. Int. J. Food Sci. Technol. 46, 1986-1992. [ Links ]
Gómez-Gallego, M.A., Gómez Garcia-Carpintero, E., Sánchez-Palomo, E., González Vinas, M.A. & Hermosin-Gutiérrez, I., 2013. Evolution of the phenolic content, chromatic characteristics and sensory properties during bottle storage of red single-cultivar wines from Castilla La Mancha region. Food Res. Int. 51(2), 554-563. [ Links ]
Guadalupe, Z. & Ayestarán, B., 2007. Polysaccharide profile and content during the vinification and aging of tempranillo red wines. J. Agric. Food Chem. 55(26), 10720-10728. [ Links ]
Harbertson, J.F., Kennedy, J.A. & Adams, D.O., 2002. Tannin in skins and seeds of Cabernet Sauvignon, Syrah, and Pinot noir berries during ripening. Am. J. Enol. Vitic. 1, 54-59. [ Links ]
Harbertson, J.F., Kilmister, R.L., Kelm, M.A. & Downey, M.O., 2014. Impact of condensed tannin size as individual and mixed polymers on bovine serum albumin precipitation. Food Chem. 160, 16-21. [ Links ]
He, F., Pan, Q., Shi, Y. & Duan, C., 2008. Chemical synthesis of proanthocyanidins in vitro and their reactions in aging wines. Molecules 13, 3007-3032. [ Links ]
He, F., Liang, N., Mu, L., Pan, Q., Wang, J., Reeves, M.J. & Duan, C., 2012a. Anthocyanins and their variation in red wines I. Monomeric anthocyanins and their color expression. Molecules 17, 1571-1601. [ Links ]
He, F., Liang, N., Mu, L., Pan, Q., Wang, J., Reeves, M.J. & Duan, C., 2012b. Anthocyanins and their variation in red wines II. Anthocyanin derived pigments and their color evolution. Molecules 17, 1483-1519. [ Links ]
Hermosín-Gutiérrez, I., Sánchez-Palomo Lorenzo, E. & Vicario Espinosa, A., 2005. Phenolic composition and magnitude of copigmentation in young and shortly aged red wines made from the cultivars, Cabernet Sauvignon, Cencibel and Syrah. Food Chem. 92, 269-283. [ Links ]
Hufnagel, J.C. & Hofmann, T., 2008. Quantitative reconstruction of the nonvolatile sensometabolome of a red wine. J. Agric. Food Chem. 56, 91909199. [ Links ]
ISO, 1977. Sensory analysis - Apparatus - Wine tasting glass. ISO, Geneva. [ Links ]
Kennedy, J.A., Matthews, M.A. & Waterhouse, A.L., 2000. Changes in grape seed polyphenols during fruit ripening. Phytochemistry 55, 77-85. [ Links ]
Kennedy, J.A., Hayasaka, Y., Vidal, S., Waters, E.J. & Jones, G.P., 2001. Composition of grape skin proanthocyanidins at different stages of berry development. J. Agric. Food Chem. 49, 5348-5355. [ Links ]
Lawless, H.T. & Heymann, H., 2010 (2nd ed). Descriptive analysis. Sensory evaluation of food. Principles and practices. Springer, New York. [ Links ]
Liu, Y., Zhang, B., He, F., Duan, C.Q. & Shi, Y., 2016. The influence of prefermentative addition of gallic acid on the phenolic composition and chromatic characteristics of Cabernet Sauvignon wines. J. Food Sci. 81(7), C1669-C1678. [ Links ]
Llaudy, M.D.C., Canals, R., González-Manzano, S., Canals, J.M., Santos-Buelga, C. & Zamora, F., 2006. Influence of micro-oxygenation treatment before oak aging on phenolic compounds composition, astringency, and color of red wine. J. Agric. Food Chem. 54(12), 4246-4252. [ Links ]
Ma, W., Guo, A., Zhang, Y, Wang, H. & Liu, Y, 2014. A review on astringency and bitterness perception of tannins in wine. Trends Food Sci. Technol. 40(1), 6-19. [ Links ]
Marais, J., 2003. Effect of different wine-making techniques on the composition and quality of Pinotage wine. II. Juice/skin mixing practices. S. Afr. J. Enol. Vitic. 24(2), 76-79. [ Links ]
McRae, J.M. & Kennedy, J.A., 2011. Wine and grape tannin interactions with salivary proteins and their impact on astringency: A review of current research. Molecules 16, 2348-2364. [ Links ]
Mihnea, M., Aleixandre-Tudó, J., Kidd, M. & Du Toit, W., 2019. Basic in-mouth attribute evaluation: A comparison of two panels. Foods 8(1), 3. [ Links ]
Monagas, M., Bartolome, B. & Gómez-Cordovés, C., 2005. Updated knowledge about the presence of phenolic compounds in wine. Crit. Rev. Food Sci. Nutr. 45(2), 85-118. [ Links ]
Nunan, K.J., Sims, I.M., Bacic, A., Robinson, S.P. & Fincher, G.B., 1998. Changes in cell wall composition during ripening of grape berries. Plant Physiol. 118, 783-792. [ Links ]
Obreque-Slier, E., Pena-Neira, Á. & López-Solís, R., 2010a. Enhancement of both salivary protein-enological tannin interactions and astringency perception by ethanol. J. Agric. Food Chem. 58(6), 3729-3735. [ Links ]
Obreque-Slier, E., Pena-Neira, Á., López-Solís, R., Cáceres-Mella, A., Toledo-Araya, H. & López-Rivera, A., 2013. Phenolic composition of skins from four Carmenet grape varieties (Vitis vinifera L.) during ripening. LWT - Food Sci. Technol. 54(2), 404-413. [ Links ]
Obreque-Slier, E., Pena-Neira, Á., López-Solís, R., Zamora-Marín, F., Ricardo-da-Silva, J.M. & Laureano, O., 2010b. Comparative study of the phenolic composition of seeds and skins from Carménère and Cabernet Sauvignon grape varieties (Vitis vinifera L.) during ripening. J. Agric. Food Chem. 58, 3591-3599. [ Links ]
Pace, C., Giacosa, S., Torchio, F., Segade, S.R., Cagnasso, E. & Rolle, L., 2014. Extraction kinetics of anthocyanins from skin to pulp during carbonic maceration of winegrape berries with different ripeness levels. Food Chem. 165, 77-84. [ Links ]
Peleg, H., Gacon, K., Schlich, P. & Noble, A.C., 1999. Bitterness and astringency of flavan-3-ol monomers, dimers and trimers. J. Sci. Food Agric. 79(8), 1123-1128. [ Links ]
Pérez-Lamela, C., García-Falcón, M., Simal-Gándara, J. & Orrils-Fernandez, I., 2007. Influence of grape variety, vine system and enological treatments on the colour stability of young red wines. Food Chem. 101, 601-606. [ Links ]
Pérez-Magarino, S. & González-SanJosé, M.L., 2004. Evolution of flavanols, anthocyanins, and their derivatives during the aging of red wines elaborated from grapes harvested at different stages of ripening. J. Agric. Food Chem. 52(5), 1181-1189. [ Links ]
Pérez-Magarino, S. & González-SanJosé, M.L., 2006. Polyphenols and colour variability of red wines made from grapes harvested at different ripeness grade. Food Chem. 96, 197-208. [ Links ]
Prieur, C., Rigaud, J., Cheynier, V. & Moutounet, M., 1994. Oligomeric and polymimeric from grape seeds. Phytochemistry 34(3), 781-784. [ Links ]
Quijada-Morín, N., García-Estévez, I., Nogales-Bueno, J., Rodríguez-Pulido, F.J., Heredia, F.J., Rivas-Gonzalo, J.C., Escribano-Bailón, M.T. & Hernández-Hierro, J.M., 2016. Trying to set up the flavanolic phases during grape seed ripening: A spectral and chemical approach. Talanta 160, 556561. [ Links ]
Remy, S., Fulcrand, H., Labarbe, B., Cheynier, V. & Moutounet, M., 2000. First confirmation in red wine of products resulting from direct anthocyanin-tannin reactions. J. Sci. Food Agric. 751, 745-751. [ Links ]
Reynolds, A.G. & Vanden Heuvel, J.E., 2009. Influence of grapevine training systems on vine growth and fruit composition: A review. Am. J. Enol. Vitic. 3, 251-268. [ Links ]
Río Segade, S., Vázquez-Soto, E., Vázquez-Rodríguez, E.I. & Rego-Martinez, J.F., 2009. Influence of training system on chromatic characteristics and phenolic composition in red wines. Eur. Food Res. Technol. 229, 763-770. [ Links ]
Riou, V., Vernhet, A., Doco, T. & Moutounet, M., 2002. Aggregation of grape seed tannins in model wine - Effect of wine polysaccharides. Food Hydrocoll. 16(1), 17-23. [ Links ]
Ryan, J.M. & Revilla, E., 2003. Anthocyanin composition of Cabernet Sauvignon and Tempranillo grapes at different stages of ripening. J. Agric. Food Chem. 51(11), 3372-3378. [ Links ]
Sáenz-Navajas, M.P., Ferreira, V., Dizy, M. & Fernández-Zurbano, P., 2010. Characterization of taste-active fractions in red wine combining HPLC fractionation, sensory analysis and ultra performance liquid chromatography coupled with mass spectrometry detection. Anal. Chim. Acta 673, 151-159. [ Links ]
Sáenz-Navajas, M.P., Avizcuri, J.M., Ferrero-del-Teso, S., Valentin, D., Ferreira, V. & Fernández-Zurbano, P., 2017. Chemo-sensory characterization of fractions driving different mouthfeel properties in red wines. Food Res. Int. 94, 54-64. [ Links ]
Sarneckis, C.J., Dambergs, R.G., Jones, P., Mercurio, M., Herderich, M.J. & Smith, P.A., 2006. Quantification of condensed tannins by precipitation with methyl cellulose: Development and validation of an optimised tool for grape and wine analysis. Aust. J. Grape Wine Res. 12(1), 39-49. [ Links ]
Singleton, V.L. & Trousdale, E.K., 1992. Anthocyanin-tannin interactions explaining differences in polymeric phenols between white and red wines. Am. J. Enol. Vitic. 43, 63-70. [ Links ]
Smith, P.A., McRae, J.M. & Bindon, K.A., 2015. Impact of winemaking practices on the concentration and composition of tannins in red wine. Aust. J. Grape Wine Res. 21, 601-614. [ Links ]
Somers, T.C., 1971. The polymeric nature of wine pigments. Phytochemistry 10, 2175-2186. [ Links ]
Somers, T.C. & Evans, M.E., 1974. Wine quality: Correlations with colour density and anthocyanin equilibria in a group of young red wines. J. Agric. Food Chem. 25, 1369-1379. [ Links ]
Somers, T.C. & Evans, M.E., 1979. Grape pigment phenomena: Interpretation of major colour losses during vinification. J. Sci. Food Agric. 30(6), 623-633. [ Links ]
Song, J., Smart, R.E., Dambergs, R.G., Sparrow, A.M., Wells, R.B., Wang, H. & Qian, M.C., 2014. Pinot Noir wine composition from different vine vigour zones classified by remote imaging technology. Food Chem. 153, 52-59. [ Links ]
Timberlake, C.F. & Bridle, P., 1976. Interactions between anthocyanins, phenolic compounds and acetaldehyde and their significance in red wines. Am. J. Enol. Vitic. 27(3), 97-105. [ Links ]
Van Noordwyk, M., 2012. Interaction of water deficit, canopy modification and ripening: Effect on the phenolic and colour composition of Shiraz grapes & subsequent wine. MSc thesis, Stellenbosch University, Private Bag X1, 7602 Matieland (Stellenbosch), South Africa. [ Links ]
Vidal, S., Francis, L., Williams, P., Kwiatkowski, M., Gawel, R., Cheynier, V. & Waters, E.J., 2004. The mouth-feel properties of polysaccharides and anthocyanins in a wine like medium. Food Chem. 85, 519-525. [ Links ]
Wang, H., Race, E.J. & Shrikhande, A.J., 2003. Anthocyanin transformation in Cabernet Sauvignon wine during aging. J. Agric. Food Chem. 51, 79897994. [ Links ]
Watrelot, A.A., Schulz, D.L. & Kennedy, J.A., 2017. Wine polysaccharides influence tannin-protein interactions. Food Hydrocoll. 63, 571-579. [ Links ]
Wolf, T.K., Dry, P.R., Iland, P.G., Botting, D., Dick, J., Kennedy, U. & Ristic, R., 2003. Response of Shiraz grapevines to five different training systems in the Barossa Valley, Australia. Aust. J. Grape Wine Res. 9, 82-95. [ Links ]
Submitted for publication: March 2019
Accepted for publication: September 2019
* Corresponding author: E-mail address: wdutoit@sun.ac.za
# Current affiliation: RISE Research Institutes of Sweden, Division Bioscience and Materials - Agrifood and Bioscience, Box 5401, S-402 29, Göteborg, Sweden
Acknowledgements: The authors would like to thank Winetech and the National Research Foundation (NRF), South Africa, for financial support

