


Services on Demand
Article
 English (pdf)
 Article in xml format
 Article references
Indicators

Related links
-
 Cited by Google
 -
 Similars in Google
Share

 Permalink
South African Journal of Enology and Viticulture
On-line version ISSN 2224-7904
Print version ISSN 0253-939X
S. Afr. J. Enol. Vitic. vol.40 n.2 Stellenbosch 2019
http://dx.doi.org/10.21548/40-2-3058
RESEARCH NOTE
Effect of Light Quality on Fruit Growth, Composition and the Sensory Impact of the Wines
E. H. BlancquaertI, *; A. OberholsterII; J. M. Ricardo-da-SilvaIII; A. J. DeloireIV
IDepartment of Viticulture and Oenology, Stellenbosch University, Private Bag X1, Matieland, 7602, South Africa
IIDepartment of Viticulture and Enology, University of California, Davis, CA 95616, USA
IIILEAF - Linking Landscape, Environment, Agriculture and Food, Laboratório Ferreira Lapa (Sector de Enologia),Instituto Superior de Agronomia, Universidade de Lisboa, 1349-017 Lisboa, Portugal
IVSupAgro, Department of Biology and Ecology, Montpellier University, 34060 Montpellier, France
ABSTRACT
The stage at which grapes are harvested has an influence on the aromatic and phenolic composition of the berries and the resulting wines. The aim of this study was to evaluate wines harvested sequentially as outlined in the berry sugar accumulation model. Two vintages and treatments in which the light quality and quantity were altered at the fruit zone were compared. In 2010/2011, the grapes were harvested at two ripening stages after the sugar loading plateau was reached, namely the "fresh fruit" stage (20-25 days afterwards) and "pre-mature" stage (at approximately 35 days). In the 2011/2012 season, grapes were harvested 45 days after the sugar loading plateau was reached (the "mature fruit" stage). Vegetative aromas were synonymous with the "fresh fruit" stage in 2010/2011, while the 2011/2012 wines from the "mature fruit" harvest date were characterized by raisin, prune and spicy aromas. In both seasons, the control treatments were rated more intense in 'satin in the mouth' in and after expectoration. Wines in which the UV-B radiation was excluded during berry growth were rated the highest in the mouthfeel attribute 'coarseness' in both treatment seasons. Wines were analyzed chemically for phenolic content using HPLC, and sensorial using descriptive analysis with a trained panel. In the leaf removal treatments, higher acidity content enhanced the perception of astringency in the wine. Wines were analyzed chemically for phenolic content using HPLC and sensorial using descriptive analysis with a trained panel. Overall, the data showed that grape composition was altered by varying light quality, within a season, but seasonal variation overrode treatment effects. Flavonol concentration in 2011/2012 wine was higher in the exposed leaf removal treatment compared to the other treatments. High light intensities in 2011/2012 season increased anthocyanin concentration in the wine.. This study emphasizes the importance of the quality and quantity of light on the composition and quality of wines, and presents new findings regarding sensory attributes associated with harvesting at different ripening stages.
Keywords: Cabernet Sauvignon, sequential harvesting, fresh fruit, mature fruit, sensory
INTRODUCTION
Grape ripening is multi-faceted as it includes numerous physical and biochemical modifications (Jackson & Lombard, 1993; Le Moigne et al., 2008; Dai et al., 2010; Deloire, 2013). Numerous classes of primary (sugars and organic acids) and secondary metabolites (phenolics) as well as hormones and aromatic precursors are synthesised prior and post-véraison while others are provided by the roots and leaves (Ollat & Gaudillère, 1996; Deloire, 2013). The concentration and content of the primary and secondary metabolites change during grape berry ripening stages, which are controlled by independent regulated synthesis pathways that are affected by genotype, environmental factors as well as viticultural practices (Jackson & Lombard, 1993; Le Moigne et al., 2008; Dai et al., 2010; Suklje et al., 2016; Chou et al., 2018).
Optimal berry ripeness depends on the wine style goal. The sensory characteristics of the finished wine, and thus the quality, are strongly dependent on the perception of the primary and secondary metabolites and the alcohol level. Numerous studies have been conducted on the relationship between berry composition and wine phenolic composition. No clear relationship has been found between the content of phenolic compounds in grapes at harvest and the content found in finished wine (Garcia-Beneytez et al. 2002; Habertson et al. 2002; Hazak et al. 2005; Koundouras et al. 2006). The polyphenol content in wine can be ascribed to factors involved in the extraction of phenolics such as grapeskin thickness, fermentation temperature and alcohol content. Preys et al. (2006) suggested that there are relationships between sensory properties and polyphenolic composition in the final wine. Relationships have also been reported between berry composition and sensory attributes which can be attributed to the applied treatment, vineyard attributes and seasonal variation (Somers & Evans, 1974; Ough & Nagaoka, 1984; Bravdo et al. 1985; Hunter et al. 1991 &1995). More recently, Bindon et al. (2013) and Bindon et al. (2014) ascribed significant changes in wine matrix chemistry to grape maturity and yeast metabolism, which had a direct impact on the sensory attributes of Cabernet Sauvignon.
Consequently, it would be valuable to be able to predict the future wine style in relation to harvest time (Deloire, 2013). Various ripening tools have been developed to determine berry maturity objectively and accurately at harvest. Berry maturity indices include (i) total soluble solids (TSS), (ii) titratable acidity (TA), (iii) pH and (iv) combinations thereof (maturity indexes) (Amerine & Winkler, 1941; Du Plessis & Van Rooyen, 1982; Van Rooyen, 1984; Boulton et al., 1996; Iland et al., 2000; Ribéreau-Gayon et al., 2006; Botes, 2009). Kourakou (1974), Carbonneau et al. (1998) and Schneider et al. (2002) identified three types of grape maturity levels: (i) technological maturity, which corresponds to maximum sugar accumulation/concentration and low acidity (ii) phenolic maturity, defined as the concentrations of phenolics in the skins and seeds and (iii) aromatic maturity, associated with the decrease in vegetal notes and the evolution of wine volatile profile.
Deloire (2011) defined sugar loading as the evolution of the sugar quantity (mg/berry) from véraison onward. The evolution of sugar accumulation per berry gives an indication of the ripening time and could be used as a physiological indicator in direct relation with the potential wine styles. Three sugar loading profiles are distinguished: continual and rapid loading, slow sugar loading (inhibition of ripening) and sugar loading presenting a plateau phase. Depending on whether the grapes are picked in the early, mid or late stages of the plateau phase, the wine will be characterized as "fresh fruit", 'neutral-spicy' or 'pre-mature' and "mature fruit" (Deloire, 2011). The aroma potential in the grapes can be attributed to the evolution of volatile precursors during berry development, which are dependent on enzyme activity and specificity. An in-depth understanding of secondary metabolites during berry development may provide predictive information between the grape and wine aroma (Kalua & Boss, 2009). These aromatic stages require sensory analysis to verify which sensory attributes associate with the respective stages. In terms of aromatic contribution to wine aroma, Swiegers and Pretorius (2007) and Garde-Cerdán et al., (2008) suggested that the volatile compounds derived from sugar and amino acid metabolism by yeast are the higher alcohols, esters, carbonyl compounds, volatile fatty acids, and sulphur compounds. Cabernet Sauvignon grapes often have a characteristic aroma described as 'vegetative', 'herbaceous', 'grassy' or 'green' (Lacey et al., 1991).
Polyphenols are very important in the colour and flavor of red wines. The two best-known groups of phenols are the condensed tannins (also called proanthocyanidins), and the anthocyanins, which are responsible for the red colour in red grapes and wine. A number of factors have been identified that can influence polyphenol accumulation and composition in grapes. This includes abiotic factors such as light (Flint et al., 1985; Crippen and Morrison, 1986; Gao and Cahoon 1994; Price et al., 1995; Dokoozlian and Kliewer, 1996; Haselgrove et al., 2000; Bergqvist et al. 2001; Jordão et al., 2001; Kolb et al., 2003; Cortell and Kennedy 2006; Downey et al., 2006; Ristic et al., 2007; Koyama and Goto-Yamamoto 2008; Berli et al., 2011; Gregan et al., 2012), temperature (Spayd et al., 2002; Mori et al., 2005; Mori et al., 2007; Azuma et al., 2012; Cohen et al., 2012; Yamane et al., 2006) and water status (Ojeda et al., 2002; Kennedy et al., 2002; Romero et al., 2013) as well as cultivar (Ricardo-da-Silva et al., 1992a; Ricardo-da-Silva et al., 1992b; Ryan and Revilla 2003; Downey et al., 2004), crop level (Peña-Neira, et al., 2007; Bindon et al., 2008), nutritional status (Delgado et al., 2004), soil type (Li et al., 2011) and plant growth regulators (Lacampagne et al., 2009).
Following harvest, the rate of phenolic extraction into the wine is dependent on: (i) ripeness of the fruit (Canals et al., 2005), (ii) berry size (Walker et al., 2005), (iii) the concentration in the grapes (Ozmianski et al., 1986), (iv) temperature (Koyama et al., 2007), (v) sulphur dioxide (Bakker et al., 1993), (vi) extraction or winemaking techniques (Nel et al., 2014), (vii) ethanol content (Canals et al., 2005); (viii) as well as the ageing conditions (Fang et al., 2008). Astringency and bitterness, which are largely dependent on wine phenol composition, are altered by grape maturity at harvest, winemaking techniques and wine ageing. Condensed tannins are mainly responsible for bitterness and astringency as well as colour development due to the role it plays in wine ageing processes such as polymerisation reactions with anthocyanins to form polymeric pigments (Ricardo-da-Silva et al., 1991). Wine colour is affected by the level and composition of anthocyanins, tannins and flavonols extracted during vinification (Baranowski & Nagel 1983; Bakker et al. 1993; Picinelli et al. 1994; Dallas et al., 1996; Cheynier et al., 2000; Romero & Bakker 2000; Eglinton et al., 2004; Ristic et al., 2007). Flavonols form co-pigments with anthocyanins and protect the flavylium cation against the nucleophilic attack of water, peroxide, and sulfur dioxide bleaching and pH changes (Gordillo et al., 2015).
Astringency is a tactile sensation in which drying, puckering and roughing are the result of increased friction between the tongue and the surfaces inside the mouth (Lea & Arnold, 1978; Robichaud & Noble, 1990). Recently, Ferrer-Gallego et al. (2014) reported that astringent perceptions are modulated by an increase in the volatile compounds. Bitterness is a taste sensation perceived by each of the several thousand sensors on the tongue (Katsnelson, 2015). Gonzalo-Diago et al. (2014) found that bitterness was highly correlated with in-mouth persistence. As previously stated, flavan-3-ols or their oligomers (referred to as proanthocyanidins) contribute to bitterness and astringency. The low molecular weight flavan-3-ols exhibit more bitterness then astringency, however as the flavan-3-ols increase in size, astringency increases faster than bitterness (Robichaud & Noble, 1990; Kennedy et al.,2006; Ren et al., 2017). Thus, the low molecular weight flavan-3-ols, which are associated more with grape seeds, have a lower astringency to bitterness ratio then the high molecular weight flavan-3-ols of grape skins.
In view of the previous work outlined above, the aim of this study was to evaluate wines produced from grapes that were harvested at different ripeness levels using berry sugar accumulation as a physiological indicator. Sequential harvest dates for the STD treatment in 2010/2011 were used to understand the possible effect of the evolution of fruit ripening on the wine matrix and sensory properties. The potential effect of the phenolic composition and volatile compounds on the wine sensory attributes was studied in the 2011/2012 season. The results presented are preliminary, and several subsequent seasons and more detailed chemical analyses are needed to link fruit and wine chemical composition and wine sensory profile of grapes harvested sequentially. This work is part of a larger study in which the evolution of the grape seed, skin tannin, flavonols and anthocyanins were investigated under altered light and temperature conditions in Cabernet Sauvignon (Vitis vinifera L.) (Blancquaert, 2015).
MATERIALS AND METHODS
Vineyard characteristics
The study was conducted during the growing seasons of 2010/2011 and 2011/2012 in a Stellenbosch University vineyard (GPS Coordinates: 33°56' 42" S 18°27' 43" E). The vineyard consists of Vitis vinifera L. cv. Cabernet Sauvignon clone CS 388C, grafted onto 101-14 Mgt (Vitis riparia X Vitis rupestris). The row orientation was northwest/south-east. The vines are trained on a six-wire vertical trellis system. The block was subjected to irrigation during critical phenological stages (e.g. fruit-set and véraison) and as required throughout the season to give a predawn leaf water potential between 0 and -0.3 MPa (Deloire & Heyns, 2011).
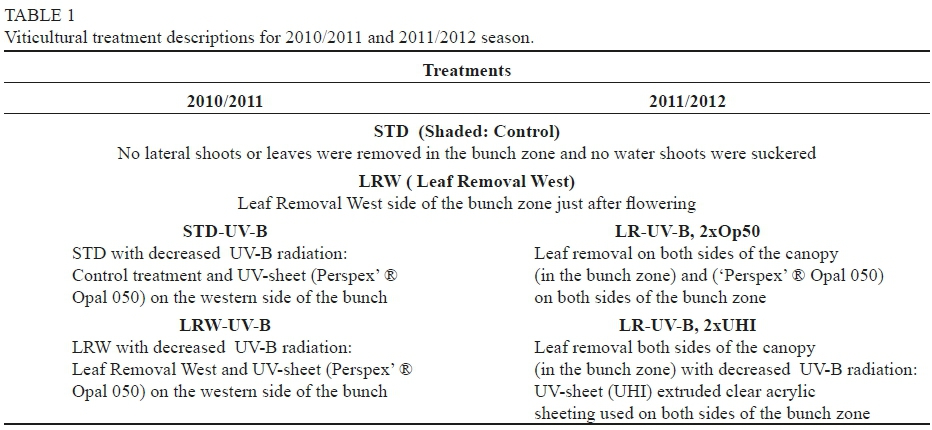
Treatments
The study comprised two main treatments with altered bunch microclimates in both seasons: no lateral shoot or leaf removal in the bunch zone (STD) and leaf removal in the bunch zone (LRW) (Table 1). In the LRW treatment, leaves were removed just after flowering corresponding to growth stage 19 (Eichorn and Lorenz system) on the western side of the canopy at the fruiting zone level (± 35-40 cm above the cordon) (Coombe, 1995).
Furthermore, to assess the effect of change in light quality on fruit growth and composition, supplementary treatments were applied. A UV sheet, reducing the UV-B radiation ('Perspex' ® Opal 050, Perspex South Africa Pty Ltd, Umbogintwini) was added to the Control/STD (STD-UV-B) and Leaf Removal West (LRW-UV-B) treatment in 2010/2011. During the 2011/2012 season, the UV-B suppression sheets were installed on both sides of the canopy to exclude the effect that the row direction can have on grape development as in the 2010/2011 season. Additional to the 'Perspex'® Opal 050 sheets, a clear acrylic UV-sheet (UHI) was used during the 2011/2012 season. The latter resulted in the following treatments: LR (-UV-B, 2xOp50) and LR (-UV-B, 2xUHI) (Table 1). These sheets were installed just after flowering at ±35 cm above the cordon and suspended on 1.2 m custom-made poles, with hinges to open for sampling and spraying. The treatments were applied in a randomised block design. Each treatment was carried out in five replicates and each replicate comprised three panels (six vines between poles). Therefore, each of the four treatments in each season comprised five replicates and each replicate consisted of 18 vines.
Sampling procedure
Sampling occurred at regular intervals throughout the season. Sampling was conducted between 06:00 and 08:00 at each sampling date from after fruit-set until harvest: 13-116 days after anthesis (DAA) during the 2010/2011 season; 26130 DAA in the 2011/2012 season. Sampling corresponded with the Eichorn and Lorenz (E-L) system (Coombe, 1995) and started at stage 29 (pea size) until stage 38 (harvest) for phenolic analyses.
Harvesting
Sequential harvest dates were predicted using the berry sugar loading model (Deloire 2011 & 2013). Grapes were harvested during the 2010/2011 season at the following times: (i) "fresh fruit" period for all four treatments (20-25 days after the sugar loading plateau was reached) on the 28th of February 2011; and (ii) 'pre-mature' period (± 35 days after the sugar loading plateau was reached) on the 20th of March 2011. For the latter, only the STD treatment was harvested. The STD treatment at the 'pre-mature' period was investigated in order to confirm whether 'neutral' wine aromas develop from wines made at this harvest stage using berry sugar accumulation as a physiological indicator (Deloire, 2011). The study aimed to assess the potential aromatic profile of the wine made from grapes harvested at the 'pre-mature' stage, which according to the model, should deliver a 'neutral' or 'pre-mature' wine style. The grapes of all the treatments in 2011/2012 season were harvested at the "mature fruit" period (45 days after the sugar loading plateau was reached) on the 26th of March 2012.
Small-scale winemaking
Standard winemaking procedures at the experimental cellar of the Department of Viticulture and Oenology, Stellenbosch University were followed. Four wines were made from the "fresh fruit" stage in duplicate. Additionally, the control (STD) was vinified at the 'pre-mature' stage in the 2010/2011 season. In the 2011/2012 season, four wines were made in duplicate from the grapes harvested at the "mature fruit" stage. In both seasons the grapes were crushed and destemmed into 20L plastic drums and 30 mg/L SO2 was added. Juice samples for pH, titratable acidity, and °B were taken before the SO2 addition. The crushed grapes were inoculated with 30 g/hL Saccharomyces cerevisiae (Lalvin ICV-D21®, Lallemand) and 30 g/hL Go Ferm Protect (Lallemand) in the rehydration water in 2010/2011 and 2011/2012, respectively. Co-inoculation with 0.01 g/L Oenococcus oeni (Enoferm ® Alpha, Lallemand) was carried out 24 hours after the yeast inoculation in order to start the malolactic fermentation. Fermentation took place at 25 °C and punch downs were done three times a day. The rate of fermentation was measured daily with a hydrometer. After 5 °B sugar was fermented 0.25 g/L Fermaid K (Lallemand) was added. The fermentation took about 5 days after which the skins were pressed at 1 bar when the wines were deemed dry (-1 °B) and moved to 20 °C in order to finish the malolactic fermentation. Once the malolactic fermentation was completed (malic and lactic acids determined enzymatically by the Central Analytical Facility, Stellenbosch University, South Africa), the wines were racked off the lees and 50 mg/L SO2 was added. The wines underwent cold stabilisation for 3 weeks at -4 °C before adjusting the free SO2 to 40 mg/L. The wines were then bottled in 750 mL dark green glass bottles, sealed with screw caps and stored at 15°C after bottling. Sensory analyses were performed six months after bottling.
Chemical analysis
The determination of the classical parameters (TSS, pH and TA) entailed the sampling of thirty berries from each of the five treatment replicates (30x5=150) in the middle of the bunch. The hundred and fifty berries from each treatment were divided into three sub-samples of 50 berries each and processed immediately after sampling for TSS, pH and titratable acidity. The berries were crushed and the grape juice centrifuged. TSS were measured using an ATAGO PAL-1 pocket refractometer (Tokyo, Japan). The pH and TA were measured using an automatic titrator (Metrohm, 702 SM Titrino, Herisau, Switzerland). The fresh berries were weighed.
Compounds were quantified using external calibration curves were set up for malvidin-3-glucoside ( Extrasynthese, Genay Cedex, France), as well as caffeic acid, p-coumaric acid, (+)-catechin, (-)-epicatechin, (-)-epicatechin-3-O-gallate, gallic acid and 2,6-dimethyl-hepten-2-ol (all from Sigma-Aldrich St. Louis, MO, U.S.A.). (+)-Catechin, (-)-epicatechin, (-)-epicatechin-3-O-gallate were quantified at 280 nm. All anthocyanins and other pigments were quantified at 520 nm as malvidin-3-glucoside units, whereas proanthocyanidins and polymeric phenols were quantified at 280 nm as (+)-catechin equivalents. Phloroglucinol and sodium acetate was obtained from Sigma-Aldrich (Johannesburg, South Africa) for the acid catalyses in the presence of excess phloroglucinol.
Isolation, purification and characterization of proantho-cyanidins/tannins
The proanthocyandins/tannins were characterised and quantified in the 2011/2012 wines. Proanthocyanidins/tannins were isolated in triplicate from different wine treatments using Toyopearl® HW-40 (Tosoh Bioscience, Stuttgart, Germany) size exclusion columns (60 mm x 14.5 mm) as described previously Oberholster et al. (2013). In short, dimers and smaller phenolics were washed off the column after loading of the wine (2 mL) with ethanol/water (55/45) containing 0.05 % trifluoroacetic acid (TFA). Larger pro-anthocyanidins/tannin were eluted with 30 mL of acetone/ water (60/40) containing 0.05 % TFA which was collected and concentrated under reduced pressure at 35°C to remove excess solvent.
The phloroglucinolysis protocol described by Oberholster et al. (2013) was implemented and the proanthocyanidin cleavage products were analysed by HPLC using an Agilent® Poroshell 120 SB-C18 column (4.6 x 150mm, 2.8 μηι particle) on an Agilent® Infinity series 1260 HPLC system (Agilent Technologies, Inc., Deerfield, IL, USA) equipped with a Diode Array DetectION (DAD) detector. Mobile phase A was 0.1 % (v/v) formic acid (Sigma-Aldrich, St. Louis, MO, USA) and mobile phase B acetonitrile containing 0.1 % (v/v) formic acid. Linear elution conditions were as follows: column temp 35°C; 2 ml/ min; 2.96 min at 3 % B; 3 to 16 % B in 10.30 min, 16 to 20 % B in 0.1 min, 1.7 min at 20 % B, 20 to 80 % B in 0.90 min, column clean-up at 80 % B for 1.34 min, and back to 3 % B in 1.00 min. The column was equilibrated for 8 min at 3 % B before the next injection. Chromatograph integration was performed using Agilent® CDS ChemStation software.
The proanthocyanidin cleavage products were quantified by means of their response factor relative to catechin, which was used as the quantitative standard (Kennedy & Jones, 2001). All samples were analysed in duplicate. The LOQ and LOD determined for (+)-catechin (Sigma Chemicals, St. Louis, MO) were, respectively, 0.0244 nmol and 0.0087 nmol where LOQ was defined as the minimum injected amount that gives a peak height seven times higher than baseline noise. LOD was defined as as the lowest concentration of an analyte in a sample that results in a peak with a height three times as high as the baseline noise level.
Descriptive analysis (DA)
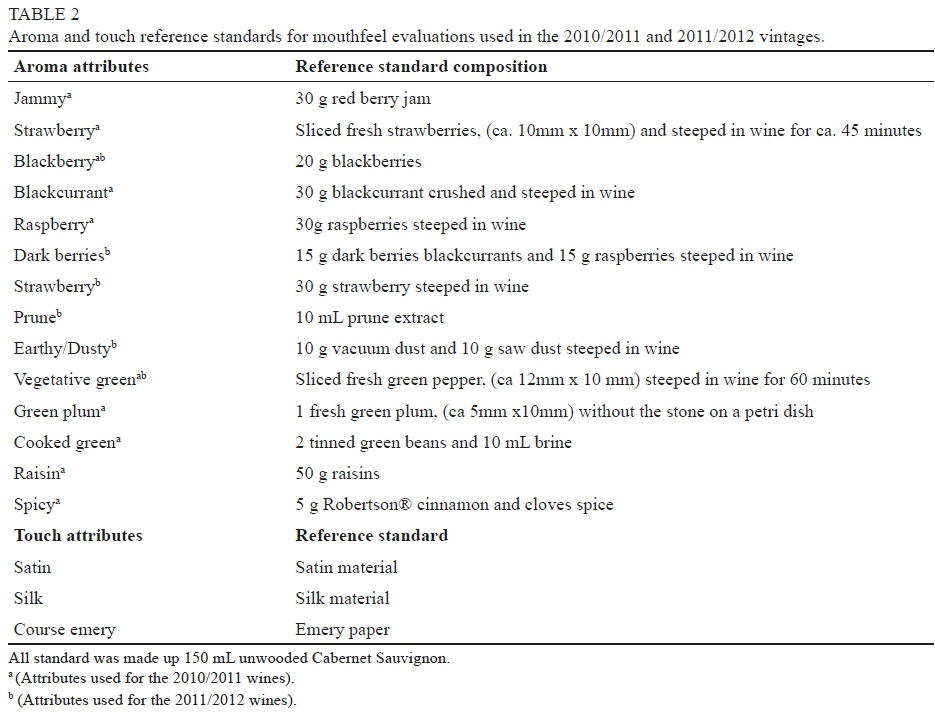
The wines were evaluated 6 months after bottling by a panel of ten female judges (28-65 years old) for the 2010/2011 season during four replicate sessions, as outlined by Lawless & Heymann (2010). The 2011/2012 wines were evaluated by a panel of nine female judges (29-65 years old) during six replicate sessions. Prior to testing the panel members underwent training and assessment of panel performance in six two-hour sessions in both seasons. The first training session-involved standardisation (consensus) of the panellists on the aroma standards provided in 2011 and 2012 as well as touch standards using different materials (Table 2).
The mouthfeel properties of the wines were aligned with touch standards using the mouthfeel wheel (Gawel et al., 2000). The samples were evaluated for an array of aroma attributes, as well as taste and mouthfeel attributes, before and after expectoration using 100-point unstructured line scales. Wine samples were served in standard ISO wine tasting glasses, with each glass containing 30 mL of wine. Each sample was coded with a 3-digit random code and served in a complete randomised order (Lawless & Heymann, 2010). Panellists performed the analysis in individual booths, with each booth being fitted with a data collecting system (Compusense® five, Version 5.2, Compusense Inc., Guelph, Ontario, Canada). The testing area was light- and temperature-controlled (20 ±1 °C).
Statistical analysis
A univariate analysis of variance (ANOVA) was performed on the sensory data using the GLM (General Linear Model) Procedure of SAS software (Version 9.2; SAS Institute Inc., Cary, USA). Sensory data were pre-processed and subjected to a test-retest analysis of variance (ANOVA) using SAS. The latter was performed to test for panel reliability. The Shapiro-Wilk test was performed to test for normality (Shapiro & Wilk, 1965). Students' t-test least significant difference was calculated at the 5 % level to compare treatment means (Ott, 1998). A probability level of p<0.05 was considered significant for all the significance tests. Data were also subjected to multivariate methods of analysis, such as the principal component analysis (PCA) (XLStat, Version 2011, Addinsoft, New York, USA), to visualise and then interpret the relationships between the samples and their attributes.
RESULTS AND DISCUSSION
Berry composition
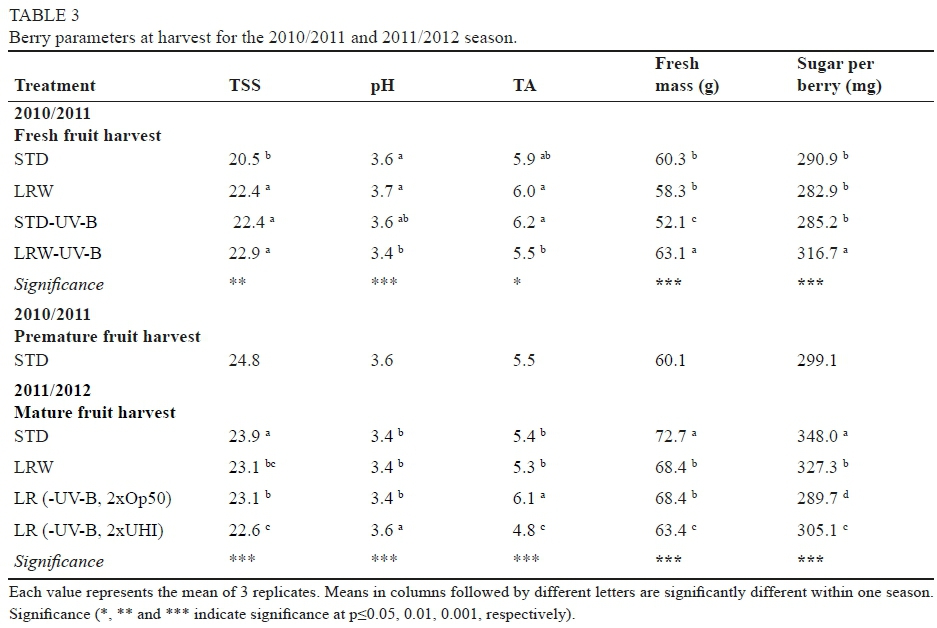
At harvest total soluble solids (TSS), pH and titratable acidity (TA) were determined for grapes from each of the treatments in both seasons (Table 3).
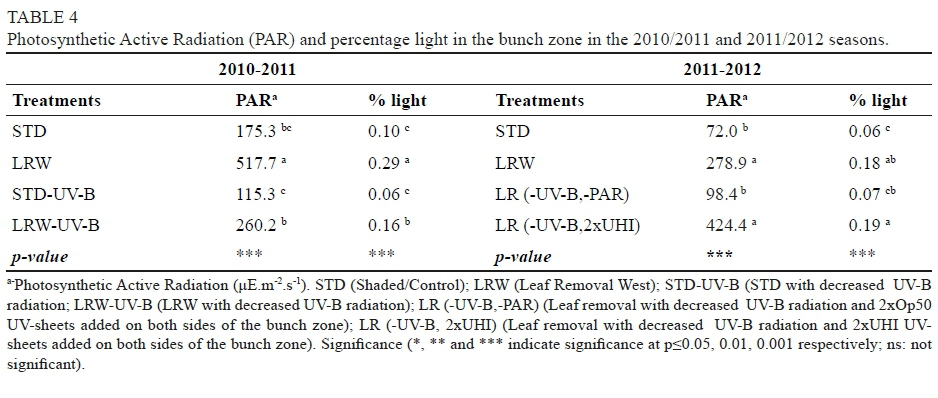
In the 2010/2011 season, the TSS varied significantly (p<0.01) at harvest among the treatments (Table 3), with the STD treatment showing significantly lower TSS (p< 0.01) compared to the other three treatments in 2010/2011 (Table 3). An increase in a similar low TSS in the STD-UV-B treatments was not observed despite the similar, low measured light intensities when compared with the STD treatment (Table 4). Spayd et al. (2002), Joscelyne et al. (2007) and Ristic et al. (2007) reported a delay in ripening due to shading which was caused by a greater proportion of leaves in the grapevine canopy. However, Haselgrove and coworkers (2000) found no difference in TSS of shaded or exposed treatments. The thermal time (DD) (Table 5) was the lowest in the STD treatment, but STD-UV-B had similar DD to the other treatments suggesting an interactive effect of temperature and light. When comparing the premature harvest data with the "fresh fruit" harvest data for the STD treatment, there was an increase in TSS and a simultaneous decrease in TA as expected, but the pH remained the same between the two harvest dates.
In the 2011/2012 season the TSS at harvest was significantly higher (p<0.001) in the STD treatment compared to the other treatments although all values were within 1.3 Brix of each other. pH were significantly lower (p<0.001) in the STD, LRW and LR (-UV-B, 2xOp50) treatments compared to LR (-UV-B, 2xUHI) in 2011/2012 (Table 5). Additionally, a significant lower TA (p<0.001) was observed in the LR (-UV-B, 2xUHI) treatment when compared to the other three treatments (Table 5).
This can be ascribed to the higher exposure level and the absence of leaves which degrade the acid in the berry (Table 3). Rojas-Lara & Morrison (1989), Morrison & Noble (1990) and Downey et al. (2006) reported differences in pH and TA in response to light and temperature as shaded fruit had higher pH and potassium levels. From our results, there was no clear relation between the grape classical parameters and the impact of treatment on light and temperature parameters indicating that differences were rather driven by seasonal influences.
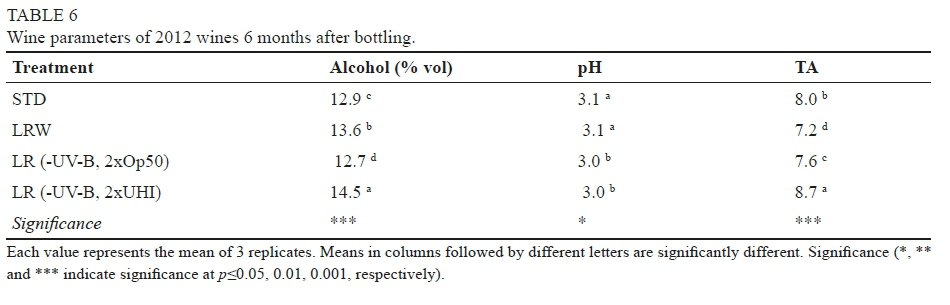
Wine composition 2011/2012
The wine chemical composition of the 2011/2012 wines differed significantly between the treatments (Table 6). Wines made from LRW and LR (-UV-B, 2xUHI) treatments had the highest % alcohol while the LR (-UV-B, 2xOp50) contained significantly less, alcohol. Wine pH from the STD and LRW treatments were significantly higher compared to the LR (-UV-B, 2xOp50) and LR (-UV-B, 2xUHI) treatments. TA values differed significantly among the wines with LR (-UV-B, 2xUHI) treatment having the highest value (Table 6). There was no clear relationship between the grape and wine chemical parameters.
The proanthocyanidin composition of the wine tannins was determined by phloroglucinolysis. (+)-Catechin was the predominant terminal unit in the wine in each of the treatments (Table 7).
This corresponds with the findings of Fernández et al. (2007) who reported similar (+)-catechin proportions in different Carménère and Cabernet Sauvignon wines. There were small although significant differences in the tannin composition of the different wine treatments (Table 7). (-)-Epicatechin was the predominant extension subunit as found by other authors (Fernández et al. 2007). Most notably the higher percentage prodelphinidins (% P) in LR (-UV-B, 2xOp50) indicates larger contribution from skin tannin. Light exposure is known to increase skin tannin concentration (Price et al., 1995; Cortell & Kennedy, 2006; Ristic et al. 2007; Blancquaert, 2015) but only a small impact of light was found in this study. The treatments with the highest % light intensity, LR (-UV-B, 2xUHI) and LRW (Table 4) did not have higher % P compared to the other more shaded treatments. Although the tannin concentration was significantly higher in the LRW treatment, the STD was not significantly different from LR (-UV-B, 2xOp50). The high tannin concentration observed in the wines may possibly be ascribed to tannin compositional changes as the wine had ten months of bottle aging before analysis.. This result corresponds with the findings of Cosme et al. (2009) who also noted increases in tannin concentrations after six months of storage.
Wine flavonol concentration was higher in the LRW treatment (9.1 mg/L) compared to STD, LR (-UV-B, 2xOp50) and LR (-UV-B, 2xUHI) treatments (7.0, 3.56 and 3.99 mg/L), respectively. This corresponds to previous findings on flavonol concentration and content in grapes, as discussed by Blancquaert (2015) where higher flavonol concentration were observed in the LRW treatment throughout berry development. The anthocyanin concentration was the highest in the most exposed treatments: LRW and LR (-UV-B, 2xUHI) (173.9 and 139.9 mg/L, respectively) while wines made from the shaded treatments LR (-UV-B, 2xOp50) and STD wines were lower at 92.5 and 124.4 mg/L, respectively. These results compare favourably with the findings of Cortell & Kennedy (2006) and Song et al. (2015) who also noted high anthocyanin concentrations, wine colour density, total pigments and total phenolic and tannin in wine made from bunches exposed to sunlight.
Sensory profile of the wines
The sensory profile of a wine is greatly influenced by the primary and secondary metabolites of the berries at harvest as well as the techniques used during vinification. In this study the accumulation of grape flavan-3-ol monomers, dimers, total tannin, flavonols and anthocyanins as well as the compositional changes of the seed and skin tannin and anthocyanins was investigated. Overall, the data showed that grape composition was altered by the light quality/quantity within a particular season.
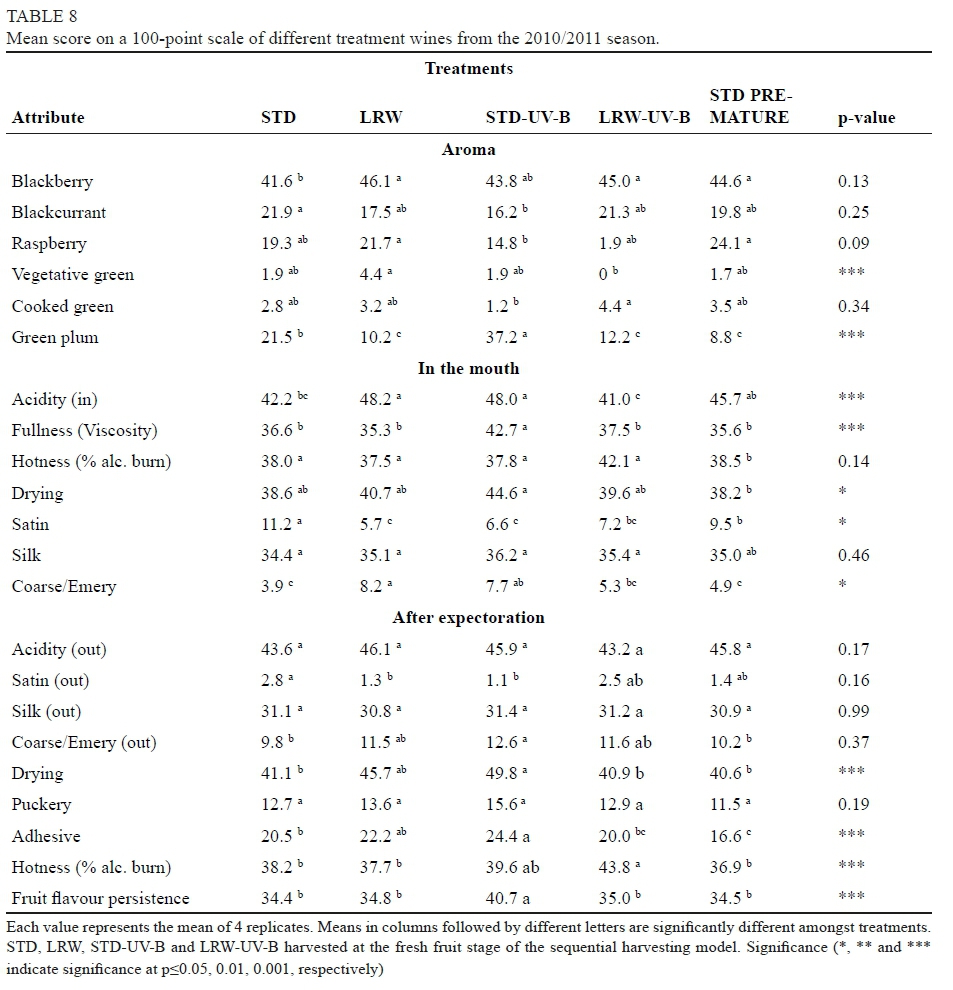
Table 8 lists the wine attributes evaluated in the wines made in the 2010/2011 season. The wines made from the different treatments differed significantly for 11 of the 22 sensory attributes. These included the aromas 'vegetative green' (p<0.001) and 'green plum' (p<0.001) and the in mouth palate attributes: 'acidity' (p<0.001), 'fullness' (p<0.001), 'drying' (p<0.05), 'satin' (p<0.05) and 'coarse emery' (p<0.05). there were also significant differences between the treatments in the attributes experienced after expectoration, including 'drying' (p<0.001), 'adhesive' (p<0.001), 'hotness' (p<0.001) and 'fruit flavour persistence' (p<0.001) (Table 8).
Wines made from STD and STD-UV-B treatment grapes scored significantly more for the aroma attribute green plum (Table 8). High levels of green plum can be ascribed to the low light intensities through natural shading (STD) and the addition of the UV-B sheets (STD-UV-B) (Table 3). This corresponds to the findings of Heymann & Noble (1987) and Morrison & Noble (1990) who reported an increase in the 3-isobutyl-2-methoxypyrazine (IBMP) ('vegetative', 'herbaceous' and 'grassy') concentration as a result of increased canopy density and bunch shading. The LRW treatment was rated high in 'vegetative green' character. Wines made from the "fresh fruit" stage of the sequential harvest model did not seem to be influenced by the applied treatment, but were described as "fresh fruit", 'green plant' like aromas and 'unripe plum' (Table 8). This corresponds to the findings of Nell (2015) in Merlot noir and Cabernet Sauvignon harvested at the "fresh fruit" stage. Treatments seemed to have most effect on intensity of attributes rather than the range used to describe the wines. For example, when the STD wine from the "fresh fruit" stage and that of the 'pre-mature' stage were compared it was evident that the latter wine had significantly less intense 'green plum' aromas and more intense 'blackberry' aromas (Table 8).
When mouthfeel attributes were compared, wines made from the STD treatment grapes were rated significantly higher levels of 'satin in the mouth' compared to the other treatment wines (Table 8). This finding coincides with that of Ristic et al. (2007) who found wines made from shaded berries to be less coarse and grainy. After expectoration, 'drying' and 'adhesive' was rated most intense for the STD-UV-B treatment, indicating a higher perception of astringency. Numerous authors attribute the increase in perception of astringency to greater concentration of tannins, polymerised phenols and the variation in tannin structures (Vidal et al., 2003; Kennedy et al., 2006, Mercurio & Smith 2008; Oberholster et al., 2009). From the grape composition in a previous study (Blancquaert, 2015) the STD-UV-B treatment did not have significantly higher concentration or content of tannins at harvest. This may be due to extraction of tannins from berry cell wall material during winemaking which results in the berries and the resulting wine having different phenolic compositions (Adams & Scholz, 2007; Holt et al., 2008). Furthermore, wine made from the STD treatment grapes harvested at the 'pre-mature' stage were rated as being less 'adhesive' after expectoration compared to the STD treatment from the "fresh fruit" stage which indicates a decrease in astringency. Thus the STD wine made from the 'pre-mature fruit' had less green character and decreased astringency compared to the STD wine from the "fresh fruit" stage. As wines from the 2010/2011 vintage were not analysed chemically, it is not possible to confirm and/or relate the sensory differences to changes in the wine composition.
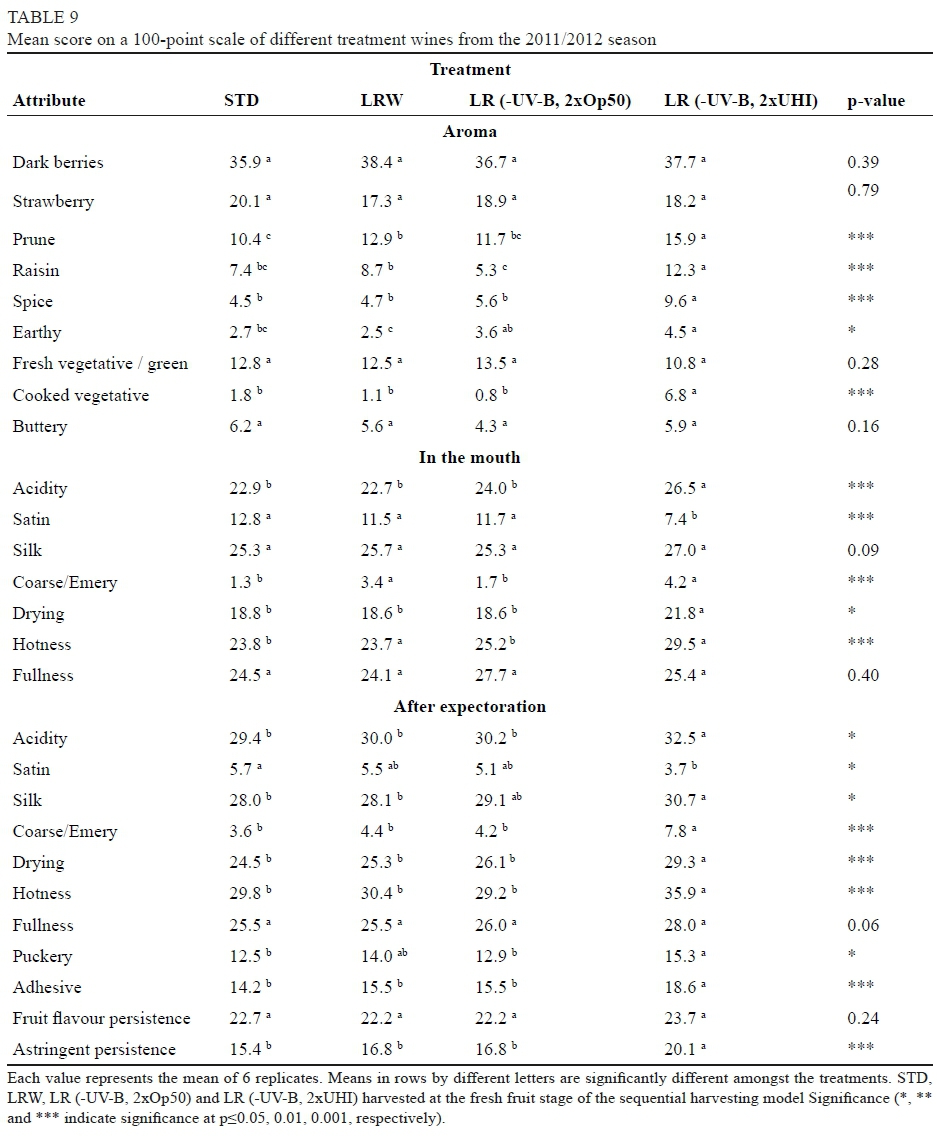
Wines made from the 2011/2012 season differed significantly among treatments in both aroma and mouthfeel attributes for 20 of the 27 attributes investigated (Table 9).
These include the aromas 'prune' (p<0.001), 'raisin' (p<0.001), 'spice' (p<0.001), 'earthy' (p<0.05) and 'cooked vegetable' (p<0.001). On the palate, 'acidity' (p<0.001), 'satin' (p<0.05), 'silk' (p<0.05), 'coarse emery' (p<0.001), 'drying' (p<0.001) 'hotness' (p<0.001) and 'puckery' (p<0.001) were significantly affected. After expectoration, 'acidity' (p<0.05), 'satin' (p<0.05), 'silk' (p<0.05), 'coarse/ emery' (p<0.001), 'drying' (p<0.001), 'hotness (% alc. burn)' (p<0.001), 'puckery' (p<0.05), 'adhesive' (p<0.001) and 'astringent persistence' (p<0.001) were significantly different among wine treatments (Table 10).
The aroma attributes that were perceived by the panel may be associated with 'over-matured fruit' indicating a longer hanging time, which corresponds with the sequential harvest model of Deloire (2011). The 'over-matured fruit' and 'spicy' aroma attributes found in this study correspond with the findings of Nell (2015) in Merlot noir and Cabernet Sauvignon. The LR (-UV-B, 2xUHI) wine scored higher for 'prune' (p<0.001), 'raisin' (p<0.001), 'spice' (p<0.001) and 'cooked vegetative / green' (p<0.05) attributes when compared to the other treatments (Table 9). The latter result can be ascribed to the grapes from this treatment being exposed to higher % light in the visible spectrum (380- 780nm). The LR (-UV-B, 2xUHI) treatment had a shading coefficient of 1.0, thermal time of 729.7 and a maximum mean temperature of 39.6°C (Table 4).
In general, the wine from treatment LR (-UV-B, 2xUHI) was rated significantly higher than the other three treatments in most of the palate and 'after expectoration' attributes (Table 9). Gawel et al. (2007) suggested that an increase in 'puckery' sensation was characterised by low anthocyanin levels, high acidity and high pigmented polymer and tannin concentrations. Although wine treatment LR (-UV-B, 2xUHI) was rated more intense than the other treatments in all of the astringency related attributes except for 'satin', the wine analyses did not support this finding. Tannin analyses (Table 7) indicated that there were no significant differences between treatment LR (-UV-B, 2xUHI) and treatments LRW and LR (-UV-B, 2xOp50) in tannin concentration and mDP values. Phenolic profile results from HPLC analysis supported this. There were differences in anthocyanin (7.0, 9.0, 3.9 and 3.5 mg/L) and flavonol content (124.4, 173.9, 139.9 and 92.5 mg/L) for STD, LRW, LR (-UV-B, 2xOp50) and LR (-UV-B, 2xUHI), respectively.
The perception of astringency in wines can be influenced by other parameters such as pH, acidity, ethanol concentration and polysaccharides (Cheynier et al., 2006; Bajec & Pickering, 2008; Ma et al., 2014). From the results in this study(Table 6), the LR (-UV-B, 2xUHI) treatment had significantly higher (p<0.001) 'acidity', which could enhance the astringency perception of the phenolic compounds.
Multivariate associations of sensory attributes and treatments
Principle component analysis (PCA) was performed on all the aroma and mouthfeel properties for wines from both seasons in an attempt to discriminate among the treatments and the perceived attributes. Cumulatively, PC1 and PC2 explained 80.08 % in 2010/2011 and 92.23 % in 2011/2012 season (Fig. 1 a & b) of the variance.
In the 2010/2011 season, the LRW and STD-UV-B treatments associate with most of the mouthfeel attributes, whereas STD, LRW-UV-B and STD'pre-mature' associated with three of the aroma attributes i.e 'raspberry', 'cooked green' and 'black currant' as well as the mouthfeel attributes 'satin after expectoration' and 'hotnessalcohol' (Fig.1). Differences were driven by higher scores in 'blackcurrant' aroma, 'alcohol hotness' and 'satin mouthfeel' for wines from treatments STD and LRW-UV-B in addition to lower scores in mouthfeel terms 'drying', 'puckery' and 'adhesive'. STD 'pre-mature' separated from STD fresh due to mainly an increase in 'raspberry' aroma and a decrease in 'green plum'. These results agree with the findings of Archer & Strauss (1990), Morrison & Noble (1990) and Price et al. (1995), who reported that wine made from grapes grown in shaded conditions were characterised as 'green' or 'grassy' with limited differences in composition, but wines from exposed treatments were rated higher in overall quality due to the intensity of the aromas and darker colour. The treatments in this study did not follow any specific trend except for descriptors corresponding with the sequential harvest model (Deloire, 2011).
In the 2011/2012 season, separation of the wine treatments was due to much higher scores for most aroma and palate attributes for the LR (-UV-B, 2xUHI) treatment compared with the other treatments, with the exception of the 'fresh vegetative/ green' and 'satin attributes'. There was thus a clear separation of wines in the 2011/2012 according to light exposure (72, 278.9, 98.4 and 424.4 LiE.m-2.s-1 for STD, LRW, LR (-UV-B, 2xOp50) and LR (-UV-B, 2xUHI) respectively) based on sensory attributes. According to the 2011/2012 results (Fig. 1b), it is clear that a limited number of sensory attributes on the negative side of the PCA bi-plot, i.e 'strawberry' and 'fresh vegetative aromas and satin (in and after expectoration) can be ascribed to the light quantity and not quality as the LR (-UV-B, 2xOp50) was closely related to the LRW and STD treatment. The LR (-UV-B, 2xUHI) treatment was associated with the majority if the sensory attributes, especially the mouthfeel attributes (Fig. 1b). It is clear that the development of aroma and mouthfeel properties is dependent on light exposure as the LR (-UV-B, 2xUHI) were characterised by high visible light exposure. However, in the 2010/2011 season similar differences in light intensity (175.3, 517.7, 115.3, 260.2 LE.m-2.s-1 for STD, LRW, STD-UV-B and LRW-UV-B, respectively) did not result in clear separation of the treatments. The impact of the season can however been seen if the light intensiies for the STD treatment in both seasons are compared. In this study, it appears that seasonal variation had a larger impact than treatments on wine sensory attributes. However, the grapes were not harvested at the same stages in the different seasons, making conclusions more difficult. When comparing the two seasons (Fig. 1), the aroma attributes perceived in both seasons were found to be significantly different in the assessed wines. The aroma attributes in the wines corresponded to the descriptors associated with stages in the berry sugar accumulation model described by Deloire (2011).
CONCLUSIONS
Wines were made from different grape treatments harvested at different maturity levels using the berry sugar accumulation model (Deloire, 2011) in two consecutive seasons. Descriptive analysis was used to characterise differences in the perceived aroma and mouthfeel attributes of the wines made with grapes at the different maturity stages of sequential harvesting. In both seasons berry composition was influenced significantly by the prevailing light and temperature conditions within the season. Descriptors for wines corresponded with those predicted by sequential harvest using the berry sugar accumulation model, as wines made from berries harvested during the "fresh fruit" stage were classified as 'fresh', 'green' in 2010/2011, and wines made from the 'mature' stage were associated with 'prune' and 'raisin' attributes in 2011/2012. Wines from the STD treatment were consistently rated as having higher 'satin' properties in and after expectoration.
Sequential harvesting is an interesting way to explore the evolution of grape ripening and the aromas and mouthfeel attributes in the associated wines in a consumer-driven wine world. Ideally, the study should be conducted over additional seasons with the same treatments to investigate the impact of light intensity on grape ripening. Aspects of this work that should be further investigated include associating wine composition with specific mouthfeel attributes, and determining matrix effects on mouthfeel. Additionally, grapes from the respective treatments should be harvested across each ripeness levels in different seasons, to determine whether ripeness (i.e harvest time) has more of a sensory impact than light quantity and quality.
LITERATURE CITED
Adams, D.O. & Scholz, R.C., 2007. Tannins - the problem of extraction. In: Proceedings 13th Australian Wine Industry Technical Conference, Adelaide, South Australia pp. 160-164. [ Links ]
Amerine, M.A. & Winkler, A.J., 1941. Maturity studies with California grapes. I. The Balling-acid ratio of wine grapes. Proc. Amer. Soc. Hort. Sci. 38, 373-387. [ Links ]
Archer E. & Strauss, H.C., 1990. Effect of vine spacing on some physiological aspects of Vitis vinifera L. (cv. Pinot noir). S. Afr. J. Enol. Vitic. 11, 76-86. [ Links ]
Azuma, A, Yakushiji, H, Koshita, Y, Kobayashi, S., 2012. Flavonoid biosynthesis-related genes in grape skin are differentially regulated by temperature and light conditions. Planta, 236, 1067-1080. [ Links ]
Bajec, M. R. & Pickering, G. J., 2008. Astringency: mechanisms and perception. Crit. Rev. Food Sci. Nutr, 48, 858-875. [ Links ]
Bakker, J., Picinelli, A., Bridle, P. & Gracia-Viquera, C., 1993. Colour and composition changes during ageing. Vitis 32, 111-118. [ Links ]
Baranowski, E.S. & Nagel, C.W., 1983. Kinetics of malvidin-3-glucoside condensation in wine model systems. J. Food Sci. 48, 419-421. [ Links ]
Berli, F.J, Moreno, D, Piccoli, P, Hespanhol-Viana, L, Silva, M.F, Bressan-Smith, R, Cavagnaro, J.B, Bottini, R., 2011. Abscisic acid is involved in the response of grape (Vitis vinifera L.) cv. Malbec leaf tissues to ultraviolet-B radiation by enhancing ultraviolet-absorbing compounds, antioxidant enzymes and membrane sterols. Plant Cell Environ. 33, 1-10. doi: 10.1111/j.1365-3040.2009.02044.x [ Links ]
Bergqvist, J, Dokoozlian, N, Ebisuda, N., 2001. Sunlight exposure and temperature effects on berry growth and composition of Cabernet Sauvignon and Grenache in the central San Joaquin valley of California. Am. J. Enol. Vitic. 52, 1, 1-7. [ Links ]
Bindon, K.A., Dry, P.R. & Loveys, B.R., 2008. The Interactive Effect of Pruning Level and Irrigation Strategy on Grape Berry Ripening and Composition in Vitis vinifera L. cv. Shiraz. S. Afr. J. Enol. Vitic. 29, 2, 7178. [ Links ]
Bindon K., Varela C., Kennedy J., Holt H. & Herderich M., 2013. Relationships between harvest time and wine composition in Vitis vinifera L. cv. Cabernet Sauvignon 1. Grape and wine chemistry. Food Chem. 138, 1696-1705. [ Links ]
Bindon K., Holt H., Williamson P.O., Varela C., Herderich M. & Francis I.L., 2014. Relationships between harvest time and wine composition in Vitis vinifera L. cv. Cabernet- Sauvignon 2. Wine sensory properties and consumer preference. Food Chem. 154, 90-101. [ Links ]
Blancquaert, E.H. (2015) Berry tannin structure and phenolics evolution in cv. Cabernet Sauvignon (Vitis vinifera L.): effect of light and temperature. PhD Agric dissertation, Stellenbosch University, Private Bag X1, 7602, Matieland (Stellenbosch), South Africa. [ Links ]
Botes, M.P. 2009. Evaluation of parameters to determine optimum ripeness in cabernet Sauvignon grapes in relation to wine quality. MSc Agric thesis. Stellenbosch University, Private Bag X1, 7602, Matieland (Stellenbosch), South Africa. [ Links ]
Boulton, R.B, Singleton, V.L., Bisson, L.F. & Kunkee, R.E., 1996. Principles and practices of winemaking. Chapman & Hall, New York. [ Links ]
Bravdo, B., Hepner, Y., Loinger, C., Cohen, S. & Tabacman, H., 1985. Effect of crop level and crop load on growth, yield, must and wine composition, and quality of Cabernet Sauvignon. Am. J. Enol. Vitic. 36, 125-131. [ Links ]
Canals, R., Llaudy, M.C., Vallis, J., Canals, J.M. & Zamora, F., 2005. Influence of ethanol concentration on the extraction of color and phenolic compounds from the skins and seeds of Tempranillo grapes at different stages of ripening. J. Agric. Food Chem. 53, 4019-4025. [ Links ]
Carbonneau, A., Champagnol, F., Deloire, A. & Sevila, F., 1998. Récolte et qualité du raisin. In C. Flanzy (Ed.), Enologie, fondements scientifiques et technologiques, Paris, Technique et Documentation Lavoisier. pp. 649-670. [ Links ]
Cerpa-Calderón, F.K. & Kennedy, J.A., 2008. Berry integrity and extraction of skin and seed proanthocyanidins during red wine fermentation. J. Agric. Food. Chem. 56, 9006-9014. [ Links ]
Cheynier, V., Remy, S. & Fulcrand, H., 2000. Mechanisms of anthocyanin and tannin changes during winemaking and ageing. In: Proceedings of the ASEV 50th Anniversary Annual Meeting, Seattle, Washington. American Society for Enology and Viticulture: Davis, 337-344. [ Links ]
Cheynier, V., Dueñas-Paton, M., Salas, E., Maury, C, Jean-Marc Souquet, J., Sarni-Manchado, P. & Fulcrand, H., 2006. Structure and properties of wine pigments and tannins. Am. J. Enol. Vitic. 57, 298-305. [ Links ]
Chou, H., Suklje, K., Antalick, G., Schmidtke, L.M. & Blackman, J.W., 2018. Late-Season Shiraz Berry Dehydration That Alters Composition and Sensory Traits of Wine. J. Agric. Food Chem. 66 29, 7750-7757. [ Links ]
Cohen, S.D., Tarara, J.M., Gambetta, G.A., Matthews, M.A., Kennedy, J.A., 2012. Impact of diurnal temperature variation on grape berry development, proanthocyanidin accumulation, and the expression of flavonoid pathway genes. J Exp. Bot. 63, 2655-2665. doi:10.1093/jxb/err449 [ Links ]
Coombe, B.G.,1995. Adoption of a system for identifying grapevine growth stages. Aust. J. Grape Wine Res.1, 104-10. doi: 10.1111/j.1755-0238.1995.tb00086.x [ Links ]
Cortell, J.M. & Kennedy, J.A. 2006. Effect of shading on accumulation of flavonoid compounds in (Vitis vinifera L.) Pinot noir fruit and extraction in a model system. J. Agric. Food. Chem. 54, 8510-8520. [ Links ]
Cosme, F., Ricardo-da-Silva, J.M. & Laureano, O., 2009. Effect of various proteins on different molecular weight proanthocyanidin fractions of red wine during wine fining. Am. J. Enol. Vitic. 60, 74-81. [ Links ]
Crippen, D.D.J., Morrison, J.C., 1986. The effects of sun exposure on the phenolic content of Cabernet Sauvignon berries during development. Am. J. Enol. Vitic. 37, 4, 243-247. [ Links ]
Dallas, C., Ricardo-da-Silva, J.M. & Laureano, O., 1996. Interactions of oligomeric procyanidins in model wine solutions containing malvidin-3-glucoside and acetaldehyde. J.Sci. Food Agric. 70, 493-500. [ Links ]
Dai, Z.W, Vivin, P., Ollat, N., Barrieu, F. & Delrot, S., 2010. Physiological and modelling approaches to understand water and carbon fluxes in relation with grape berry growth and quality. Aust. J. Grape Wine Res. 16, 70-85. [ Links ]
Delgado, R., Martín, P., del Álamo, M. & González, M., 2004. Changes in the phenolic composition of grape berries during ripening in relation to vineyard nitrogen and potassium fertilisation rates. J Sci Food Agric, 84, 623 - 630 [ Links ]
Deloire, A.J., 2011. The concept of sugar loading. Wynboer, January, 9395. [ Links ]
Deloire, A.J., Heyns, D., 2011. The leaf water potentials: Principles, method and thresholds. Wineland, 129-131. [ Links ]
Deloire, A.J., 2013. Berry ripening and wine aroma. Practical Winery and Vineyard, April, 1-3. [ Links ]
Dokoozlian, N.K, Kliewer, W.M., 1996. Influence of light on grape berry growth and composition varies during fruit development. J. Am. Soc. Hortic Sci. 121, 869-874. [ Links ]
Downey, M.O., Harvey, J.S., Robinson, S.P., 2004. The effect of bunchshading on berry development and flavonoid accumulation in Shiraz grapes. Aust. J. Grape Wine Res.10, 55-73. doi: 10.1111/j.1755-0238.2004.tb00008.x [ Links ]
Downey, M.O., Dokoozlian, N.K. & Krstic, M.P., 2006. Cultural practice and environmental impacts on the flavonoid composition of grapes and wine: a review of recent research. Am. J. Enol. Vitic. 57, 257-268. [ Links ]
Du Plessis, C.S. & Van Rooyen, P.C., 1982. Grape maturity and wine quality. S. Afr. Enol. Vit. 3, 41-45. [ Links ]
Eglinton, J., Griesser, M., Henschke, P., Kwiatkowski, M., Parker, M. & Herderich, M., 2004. Yeast-mediated formation of pigmented polymers in red wine. In: Red Wine Color: Exploring the Mysteries. Waterhouse A.L., and Kennedy J.A. (Eds.) (American Chemical Society: Washington, DC.) pp. 9-21. [ Links ]
Fang, F., Li, J., Zhang, P., Tang, K., Wang, W., Pan, Q. & Juang, W., 2008. Effects of grape variety, harvest date, fermentation vessel and wine ageing on flavonoid concentration in red wines. Food Research International, 41, 1, 53-60. [ Links ]
Fernández, K., Kennedy, J.A. & Agosin, E., 2007. Characterization of grape and wine proanthocyanidins of Vitis vinifera cv. Carmenere. J. Agric. Food Chem. 55, 3675-3680. [ Links ]
Ferrer-Gallego, R., Hernández-Hierro, J.M., Rivas-Gonzalo, J.C., Escribano-Bailón, M.T., 2014. Sensory evaluation of bitterness and astringency sub-qualities of wine phenolic compounds: synergistic effect and modulation by aromas. Food Res Int, 62, 1100-1107. [ Links ]
Flint, S.D., Jordan, P.W., Caldwell, M.M., 1985. Plant protective response to enhanced UVB radiation under field conditions: leaf optical properties and photosynthesis. Photochem Phytobiol. 41, 95-99. doi: 10.1111/j.1751-1097.1985.tb03454.x [ Links ]
Gao, Y, Cahoon, G.A., 1994. Cluster shading effects on fruit quality, skin color, and anthocyanin content and composition in Reliance (Vitis hybrid). Vitis, 33, 205-209. [ Links ]
Garcia-Beneytez, E., Revilla, E. & Cabello, F., 2002. Anthocyanin pattern of several red grape cultivars and wines made from them. Eur Food Res Technol 215, 32-37. [ Links ]
Garde-Cerdán, T., Jarauta, I., Salinas, M.R., Ancín-Azpilicueta, C., 2008. Comparative study of the volatile composition in wines obtained from traditional vinification and from the Ganimede method. J. Sci. Food Agric. 88, 10, 1777-1785. [ Links ]
Gawel, R., Oberholster, A. & Francis, I.L., 2000. Red wine mouth-feel terminology. Aust. J. Grape Wine Res. 6, 203-207. [ Links ]
Gawel, R., Francis, L. & Waters, E.J., 2007. Statistical correlations between the in-mouth t textural characteristics and the chemical composition of Shiraz wines. J. Agric. Food Chem. 55, 2683-2687. [ Links ]
Gonzalo-Diago, A., Dizy, M. & Fernández-Zurbano, P., 2014. Contribution of low molecular weight phenols to bitter taste and mouthfeel properties in red wines. Food Chem. 154, 187-198. [ Links ]
Gordillo, B., Rodríguez-Pulido, F.J., Gonzalez-Miret, M.L., Quijada-Morín, N., Rivas-Gonzalo, J.C., García-Estevez, I., Heredia, F.J. and Escribano-Bailon, M.T., 2015. Application of differential colorimetry to evaluate anthocyanin-flavonol-flavanol ternary copigmentation interactions in model solutions. J. Agric. Food Chem. DOI: 10.1021/acs.jafc.5b00181. [ Links ]
Gregan, S.M., Wargent, J.J., Liu, L., Shinkle, J., Hofmann, R., Winefield, C., Trought, M., Jordan, B., 2012. Effects of solar ultraviolet radiation and canopy manipulation on the biochemical composition of Sauvignon blanc grapes. Aust. J. Grape WineRes.18, 2, 227-238. doi: 10.1111/j.1755-0238.2012.00192.x [ Links ]
Habertson, F. & Adams, J. A., 2002. Tannins in skins and seeds of Cabernet Sauvignon, Syrah and Pinot noir berries during ripening. Am. J. Enol. Vitic. 53, 54-59. [ Links ]
Haselgrove, L., Botting, D., van Heeswijck, R., H0j, P.B., Dry, P.R., Ford, C. & Iland, P.G., 2000. Canopy microclimate and berry composition: The effect of bunch exposure on the phenolic composition of Vitis vinifera L cv. Shiraz grape berries. Aust. J. Grape Wine Res. 6, 141-149. [ Links ]
Hazak, J.C., Harbertson, J.F., Adams, D.O., Lin, C.H. & Ro, B.R., 2005. The phenolic components of grape berries in relation to wine composition. Acta Horticulturae 689, 189-196. [ Links ]
Heymann, H. & Noble, A.C., 1987. Descriptive analysis of commercial Cabernet Sauvignon wines from California. Am. J. Enol. Vitic. 38, 41-44. [ Links ]
Holt, H.E., Francis, I.L., Field, J., Hererich, M.J. & Iland, P.G., 2008. Relationships between wine phenolic composition and wine sensory properties for Cabernet Sauvignon (Vitis vinifera L.). Aust. J. Grape Wine Res. 14, 162-176. [ Links ]
Hunter, J.J., De Villiers, O.T. & Watts, J.E., 1991. The effect of partial defoliation on quality characteristics of Vitis vinifera L. cv. Cabernet Sauvignon grapes. II. Skin color, skin sugar, and wine quality. Am. J. Enol. Vitic. 42, 13-18. [ Links ]
Hunter, J.J., Ruffner, H.P., Volschenk, C.G. & Le Roux, D.J., 1995. Partial defoliation of Vitis vinifera L. cv. Cabernet Sauvignon/99 Richter: Effect on root growth, canopy efficiency, grape composition, and wine quality. Am. J. Enol. Vitic. 46, 306-314 [ Links ]
Iland, P., Ewart, A., Sitters, J., Markides, A. & Bruer, N., 2000. Techniques for chemical analysis and quality monitoring during winemaking. In: Patrick Iland wine promotions (1st ed.) Campbelltown, Australia. [ Links ]
Jackson, D.I. & Lombard, P.B., 1993. Environmental management practices affecting grape composition and wine quality - A review. Am. J. Enol. Vitic. 44, 409-430. [ Links ]
Jordão, A.M., Ricardo-da-Silva, J.M., Laureano, O., 2001. Evolution of catechins and oligomeric procyanidins during grape maturation of Castelão Frances and Touriga Francesca. Am. J. Enol. Vitic. 52, 3, 230-234. [ Links ]
Joslyn, M.A. & Goldstein, J.L., 1964. Astringency of fruits and fruit products in relation to phenolic content. Adv. Food Res. 13, 178-217. [ Links ]
Joscelyne, V., Downey, M., Mazza, M. & Bastian, S., 2007. Partial shading of Cabernet Sauvignon and Shiraz vines altered wine colour and mouthfeel attributes but increased exposure had little impact. J. Agric. Food Chem. 55, 10888-10896. [ Links ]
Kalua, C.M. & Boss, P.K., 2009. Evolution of Volatile Compounds during the Development of Cabernet Sauvignon Grapes (Vitis vinifera L.). Agric. Food Chem. 57, 3818-3830. [ Links ]
Katsnelson, A., 2015. From the tongue to the brain. A body of research by Charles Zuker explains how we distinguish bitter from sweet, salty from sour-and why we should care. Accessed: 1 June 2015. (http://www.columbiamedicinemagazine.org/features/spring-2015/tongue-brain). [ Links ]
Kennedy, J.A. & Jones, G.P., 2001. Analysis of proanthocyanidin cleavage products following acid-catalyses in the presence of excess phloroglucinol. J. Agric. Food. Chem. 49, 1740-1746. [ Links ]
Kennedy, J.A., Ferrier, J., Harbertson, J.F. & Gachons, C.P.D., 2006. Analysis of tannins in red wine using multiple methods: Correlation with perceived astringency. Am. J. Enol. Viticult. 57, 481-485. [ Links ]
Kolb, C.A, Kopecky, J Riederer, M., 2003. Pfündel, E.E. UV screening by phenolics in berries of grapevine (Vitis vinifera). Funct Plant Biol. 30, 1177-1186. [ Links ]
Kourakou, S., 1974. Optimalerreifergrad derTraubenin bezugaufden gewiinschten weityp (Fr). Paper presented, XIV Congress international de la vigne et du vin. O.I.V. Bolzano. Italy, Oct. [ Links ]
Koundouras, S., Marinos, V., Gkoulioti, A., Kotseridis, Y. & van Leeuwen, C., 2006. Influence of vineyard location and vine water status on fruit maturation of nonirrigated cv. Agiorgitiko (Vitis vinifera L.). Effects on wine phenolic and aroma components. J. Agric. Food Chem. 54, 5077- 5086. [ Links ]
Koyama, K., Goto-Yamamoto, N. J., 2008. Bunch shading during different developmental stages affects the phenolic biosynthesis in berry skins of 'Cabernet Sauvignon' grapes. Am. Soc.Hortic. Sci. 133, 743-753. [ Links ]
Lacey, M.J., Allen, M.S., Roger, L.N Harris, Brown, W.V., 1991. Methoxypyrazines in Sauvignon blanc grapes and wines. . Am. J. Enol. Vitic. 42, 2, 103-108. [ Links ]
Lawless, H.T. & Heymann, H., 2010. Data Relationships and Multivariate Applications. In: Sensory evaluation of food. Publisher Springer New York. pp. 433-449. [ Links ]
Lea, A.G.H. & Arnold, G.M., 1978. The phenolics of ciders: Bitterness and astringency. J. Sci. Food Agric. 29, 478-483. [ Links ]
Le Moigne, M., Symoneaux, R. & Jourjon, F., 2008. How to follow grape maturity for wine professionals with seasonal judge training? Food Qual. Prefer. 19, 672-681. [ Links ]
Li, Z., Pan, Q, Jin, Z., Mu, L. & Duan, C. 2011. Comparison on phenolic compounds in Vitis vinifera cv. Cabernet Sauvignon wines from five winegrowing regions in China. Food Chemistry, 125, 1 77-83. [ Links ]
Ma, W., Guo, A., Zhang, Y., Wang, H., Liu, Y. and Li, H., 2014. A review on astringency and bitterness perception of tannins in wine. Trends in Food Science & Technology 40, 6-19. [ Links ]
Mercurio, M.D. & Smith, P. A., 2008. Tannin quantification in red grapes and wine: Comparison of polysaccharide- and protein-based tannin precipitation techniques and their ability to model wine astringency. J. Agric. Food Chem. 56, 5528-5537. [ Links ]
Mori, K, Sugaya, S, Gemma, H. (2005). Decreased anthocyanin biosynthesis in grape berries grown under elevated night temperature condition. Sci. Hortic. 105, 319-330. doi: https://doi.org/10.1016/j.scienta.2005.01.032 [ Links ]
Mori, K, Goto-Yamamoto, N, Kitayama, M, Hashizume, K., 2007. Loss of anthocyanins in red-wine grape under high temperature. J. Exp. Bot. 58, 1935-1945. doi: 10.1093/jxb/erm055 [ Links ]
Morrison, J. C. & Noble, A. C., 1990. The effects of leaf and cluster shading on the composition of Cabernet Sauvignon grapes and on fruit and wine sensory properties. Am. J. Enol. Vitic. 41, 193-200. [ Links ]
Nel, A.P., Van Rensburg, P. & Lambrecht, M.G., 2014. The influence of different winemaking techniques on the extraction of grape tannins and antho-cyanins. S. Afr. J. Enol. Vitic. 35, 2, 304-320. [ Links ]
Nell, M., 2015.Sensory characterisation of several red cultivar (Vitis vinifera L.) wines, using berry sugar accumulation as a physiological indicator and sequential harvest. MScAgric thesis, Stellenbosch University, Private Bag X1, 7602, Matieland (Stellenbosch), South Africa. [ Links ]
Noble, A.C., 1990. Bitterness and astringency in wine. In Developments in Food Science 25. Bitterness in Foods and Beverages. R.L. Rouseff (Ed.), pp. 145-158. Elsevier, New York. [ Links ]
Oberholster, A., Francis, I., Iland, P. & Waters, E. 2009. Mouthfeel of wines made with and without pomace contact and added anthocyanins. Aust. J. Grape Wine Res. 15, 59-69. [ Links ]
Oberholster, A., Carstens, L., Du Toit, W., 2013. Investigation of the effect of gelatine, egg albumin and cross-flow microfiltration on the phenolic composition of Pinotage wine. Food Chem. 138, 1275-1281. [ Links ]
Ollat, N. & Gaudillère, J.P., 1996. Investigation of assimilates import mechanisms in berries of Vitis vinifera var. Cabernet-Sauvignon. Acta Horticulturae 427, 141 - 149. [ Links ]
Ott, R.L., 1998. An introduction to statistical methods and data analysis. Duxbury Press, Belmont, California. [ Links ]
Ough, C.S. & Nagaoka, R., 1984. Effect of cluster thinning and vineyard yields on grape and wine composition and wine quality of Cabernet Sauvignon. Am. J. Enol. Vitic. 35, 30-34. [ Links ]
Ozmianski, J., Romeyer, F.M., Sapis, J.C. & Macheix, J.J., 1986. Grape seed phenolics: extraction as affected by some conditions occurring during wine processing. Am. J. Enol. Vitic. 37, 7-12. [ Links ]
Peña-Neira, A., Cáceres, A. & Pastenes, C., 2007. Low Molecular Weight Phenolic and Anthocyanin Composition of Grape Skins from cv. Syrah (Vitis vinifera L.) in the MaipoValley (Chile): Effect of Clusters Thinning and Vineyard Yield. Food Sci Tech Int. 13, 2:153-158. [ Links ]
Ren, M., Wang, X., Du, G., Tian, C., Zhang, J., Song, X. & Zhu, D., 2017. Influence of different phenolic fractions on red wine astringency based on polyphenol/protein binding. S. Afr. J. Enol. Vitic. 38, 1, 118-124. [ Links ]
Picinelli, A., Bakker, J. & Bridle, P., 1994. Model wine solutions: effect of sulphur dioxide on colour and composition during ageing. Vitis 33, 31-35. [ Links ]
Price, S.F., Breen, P.J., Valladao, M. & Watson, B.T., 1995. Cluster exposure and quercetin in Pinot noir grapes and wine. Am. J. Enol. Vitic. 46, 187-194. [ Links ]
Preys, S., Mazerolles, G., Courcoux, P., Samson, A., Fischer, U., Hanafi, M., Bertrand, D. & Cheynier, V., 2006. Relationship between polyphenolic composition and some sensory properties in red wines using multiway analyses. Anal. Chim. Acta 563, 126-136. [ Links ]
Ricardo-da-Silva, J.M., Rigaud, J., Cheynier, V., Cheminat, A. & Moutounet, M. 1991. Procyanidin dimers and trimers from grape seeds. Phytochemistry 30, 1259-1264. [ Links ]
Ricardo-da-Silva, J.M., Belchior, A.P., Spranger, M.I. & Bourzeix, M., 1992a. Oligomeric procyanidins of three grapevine varieties and wines from Portugal. Sci. Aliments 12, 223-237. [ Links ]
Ricardo-da-Silva, J.M., Mourgues, J. & Moutounet, M., 1992b. Dimer and trimer procyandins in Carignan and Mouvédre grapes and red wines. Vitis 31, 55-63. [ Links ]
Ristic, R., Downey, M.O., Illand, P.G., Bindon, K., Francis, I.L., Herderich, M., Robinson, S., 2007. Exclusion of sunlight from Shiraz grapes alters wine colour, tannin and sensory properties. Aust. J. Grape Wine Res. 13, 53-65. [ Links ]
Robichaud, J.L. & Noble, A.C., 1990. Astringency and bitterness of selected phenolics in wine. J. Sci. Food Agric. 53, 343-353. [ Links ]
Romero, C. & Bakker, J., 2000. Effect of acetaldehyde and several acids on the formation of vitisin A in model wine anthocyanin and colour evolution. Int. J. Food Sci. Technol. 35, 129-140. [ Links ]
Rojas-Lara, B.A. & Morrison, J.C., 1989. Differential effects of shading fruit or foliage on the development and composition of grape berries. Vitis 28, 199-208. [ Links ]
Rossi, J.A. & Singleton, V.L., 1966. Flavor effects and adsorptive properties of purified fractions of grape seed phenols. Am. J. Enol. Vitic. 17, 240-246. [ Links ]
Ryan, J.M, Revilla, E., 2003. Anthocyanin composition of Cabernet Sauvignon and Tempranillo grapes at different stages of ripening. J. Agric. Food Chem. 51, 3372-3378. doi: 10.1021/jf020849u [ Links ]
Schneider, R., Razungles, A., Charrier, F., & Baumes, R., 2002. Effet du site, de la maturité et de l'éclairement des grappes sur la composition aromatique des baies de Vitis vinifera L. cv. Melon B. dans le vignoble du Muscadet Bulletin de l'OIV. pp. 270-282. [ Links ]
Shapiro, S.S. & Wilk, M.B., 1965. An analysis of variance test for normality (complete samples). Biometrika 52, 591-611. [ Links ]
Somers, T.C. & Evans, M.E., 1974. Wine quality: Correlations with colour density and anthocyanin equilibria in a group of young red wines. J. Sci. Food Agric 25, 1369-1379. [ Links ]
Song, J., Smart, R., Wang, H, Dambergs, B., Sparrow, A. & Qian, M.C., 2015. Effect of grape bunch sunlight exposure and UV radiation on phenolics and volatile composition of Vitis vinifera L. cv. Pinot noir wine. Food Chemistry 173, 424-431. [ Links ]
Spayd, S.E., Tarara, J.M., Mee, D.L. & Ferguson, J.C., 2002. Separation of sunlight and temperature effects on the composition of Vitis vinifera cv. Merlot berries. Am. J. Enol. Vitic. 53, 3, 171-181. [ Links ]
Suklje, K., Zhang, X., Antalick, G., Clark, A.C., Deloire, A & Schmidtke, L.M., 2016. Berry shriveling significantly alters Shiraz (Vitis vinifera L.) grape and wine chemical composition. J. Agric. Food Chem. 64, 870- 880. [ Links ]
Swiegers, J.H. & Pretorius, I.S., 2007. Modulation of volatile sulfur compounds by wine yeast. Appl Microbiol Biotechnol 74, 954-960. [ Links ]
Van Rooyen, P.C, Ellis, L.P. & Du Plessis, C.S., 1984. Interactions between grape maturity and quality for Pinotage and Cabernet Sauvignon wines from four locations. S. Afr. Enol, Vitic. 5, 29-34. [ Links ]
Vidal, S., Francis, L., Guyot, S., Marnet, N., Kwiatkowski, M. & Gawel, R., 2003. The mouth-feel properties of grape and apple proanthocyanidins in a wine-like medium. J. Sci. Food Agric. 83, 6, 564-573. [ Links ]
Walker, R.R., Blackmore, D.H., Clingeleffer, P.R., Kerridge, G.H., Ruhl, E.H. & Nicholas, P. R., 2005. Shiraz berry size in relation to seed number and implications for juice and wine composition. Aust. J. Grape Wine Res. 11, 2-8. [ Links ]
Submitted for publication: July 2018
Accepted for publication: June 2019
Acknowledgements: We gratefully acknowledge the Wine Industry Network for Expertise and Technology (Winetech) and the Technology and Human Resources for Industry Programme (THRIP) for financial support. We would also like to acknowledge Ms Nina Muller and Mrs Erika Moelich for assistance during the sensory analysis and Mrs Marieta Van der Rijst and Prof. Martin Kidd for statistical analyses .
* Corresponding author: E-mail address: ewitbooi@sun.ac.za

