


Services on Demand
Article
 English (pdf)
 Article in xml format
 Article references
Indicators

Related links
-
 Cited by Google
 -
 Similars in Google
Share

 Permalink
South African Journal of Enology and Viticulture
On-line version ISSN 2224-7904
Print version ISSN 0253-939X
S. Afr. J. Enol. Vitic. vol.40 n.2 Stellenbosch 2019
http://dx.doi.org/10.21548/42-2-3270
ARTICLES
doi:https://doi.org/10.21548/42-2-3270
Profiling Potentially Smoke Tainted Red Wines: Volatile Phenols and Aroma Attributes
M. McKayI, *; F.F. BauerII; V PanzeriIII; L. MokwenaIV; A. BuicaV
IDepartment of Viticulture and Oenology; Stellenbosch University
IIDepartment of Viticulture and Oenology; Stellenbosch University
IIIInstitute for Grape and Wine Sciences; Stellenbosch University
IVCentral Analytical Facility, Stellenbosch University, Private Bag X1, Matieland (Stellenbosch) 7602, South Africa
VDepartment of Viticulture and Oenology; Stellenbosch University
ABSTRACT
Malodourous compounds, including volatile phenols (VPs) are frequently found at concentrations below their odour thresholds in wine, and may therefore be considered to present no threat to wine quality. Most investigations into smoke taint quantify compounds by chemical/analytical means, or investigate sensory effects of supra- and peri-threshold contamination in model wine. In this project, twelve wines (submitted by the South African industry as potentially smoke tainted) were screened for VPs using GC-MS, and characterized using descriptive analysis (DA) by a sensory panel highly trained in smoke taint evaluation. Results were compared statistically to elucidate relationships between chemical and sensory characteristics. It was demonstrated, using the combined dataset that concentration and composition of VPs in the wines correlated well with certain sensory attributes. Guaiacol was present in most samples at peri- or supra-threshold levels, but was not correlated with taint unless in combination with other phenols, in which case it was associated with 'smoky', 'ashy' and 'herbaceous' attributes. Wines with supra-threshold levels of VPs showed negative attributes ('chemical / plastic', 'tar / BR' and 'medicinal / Elastoplast™'). In some cases, sensory effects ('earthy / dusty / potato skin', 'mouldy / musty' and 'cooked vegetables (veg.)') could not be attributed to supra-threshold VP contamination, and therefore seemed to be due to combinations of VPs at subthreshold levels. Associations between negative attributes and historical bushfire events prior to harvest were found for a number of the wines. This study emphasizes the importance of understanding effects of VPs on wine aroma, and escalating awareness and sensitivity to these issues in the wine industry.
Key words: red wine; volatile phenols; smoke taint; sensory analysis; GC-MS
INTRODUCTION
In order to establish and maintain strong, positive international brands in a fiercely competitive market, it is important that wine producers understand the character of their products and ensure consistency of required sensory features. Negative attributes in red wine, for example, smoke taint, 'ashiness', 'greenness' / 'herbaceousness' and 'burnt rubber (BR)' have been discussed by various authors (Goode, 2008; Hammond, 2015; Heyns, 2014) and necessitate the investigation of compounds associated with these descriptors.
Volatile phenols (VPs) are a group of compounds that have been associated with smoky, burnt and acrid attributes (Parker, et al., 2013). Their presence in wine may derive from a number of sources including grapes and yeast, in particular the Brettanomyces species (Romano et al., 2009; Weiss, 2014). Wood maturation has been found to contribute to the pool of VPs (Boidron et al., 1988; Prida & Chatonnet, 2010), with the cresols, as well as 3, 4-dimethylphenol (3,4-DMP), guaiacol and 4-EP increasing as a result of lignin pyrolysis during the toasting of oak barrels (Etievant, 1981; Cadahía et al., 2003; Fernandez de Simon et al., 2008). Although VPs may derive from a number of sources, in recent years much research concerning VPs has been centered on smoke taint, an off-odour that results from exposure of grapes to bushfire smoke.
Bushfires often occur in very close proximity to vineyards in most wine growing areas globally, with recent examples including the United States of America (Jin et al., 2015), Australia (Cox, 2018), the Iberian Peninsula (Barnes, 2018), and South Africa (SA). The contribution of VPs to the pool of taint compounds in grapes and wine has been shown to escalate severely following a bushfire event (Kennison, 2013; Krstic et al., 2015; Ristic et al., 2016). These compounds have been individually characterized in different matrices by a number of authors (Wilkinson et al., 2011; Parker et al., 2013; Petrozziello et al., 2014) and their odour detection thresholds (ODTs) have been established (Table 1). Previous researchers (Kennison et al., 2009; Ristic et al., 2017) have elucidated the presence and characteristics of individual VPs in deliberately smoke-tainted (experimental) wine. Some authors have characterized the effects of individual smoke taint compounds in specific matrices (Parker et al., 2013).
The chemical nature of different compounds present, their concentrations, the interactive effects and the matrix all play a role in how volatile compounds are perceived sensorially. Aroma compounds in wine are perceived together, and different combinations could have olfactory impact even when they are present at peri-threshold or sub-threshold levels (Lorrain, et al., 2013). Recent research has shown that aroma compounds such as thiols produce aromatic differences in wine when they are present in combination (Coetzee et al., 2015, Lapalus et al., 2016; Wilson, et al., 2018), which suggests that malodourous compounds in combination at peri- and sub-threshold levels in wine might also produce variable aromatic effects. Chemical assessment of the sensory impact of compounds in wines generally consider the ODT or OAV (odour activity value) of individual compounds, and disregard or overlook the combinatorial effects of all the compounds in solution, including the matrix effect. An example of this impact is the alcohol concentration of wine, which has been shown to affect the volatility of aroma compounds (Petrozziello et al., 2014). This situation is further complicated if off-flavour contributors are present in combination at peri- and sub-threshold levels, because they may present an aroma profile that even professionals find difficult to define or separate into components (Tempere et al., 2014).
In order to address industry needs for VP analysis, and build a body of knowledge regarding smoke taint issues, producers in South Africa are encouraged to submit commercial finished wines and tank samples to the Department of Viticulture and Oenology (DVO), Stellenbosch University (SU) each year following bushfires in regions adjacent to vineyards in the Western Cape, South Africa. To our knowledge, the impact of VPs has not previously been analysed and characterized both sensorially and chemically in inadvertently smoke-affected commercial wines. The aims of this project were thus to investigate whether the sensory attributes of these commercial (actually or potentially smoke-affected) wines as evaluated by a trained panel using descriptive analysis (DA), could be correlated with VP content, as quantified by gas chromatography-mass spectrometry (GC-MS). Results in this study are presented in terms of sensory and chemical data, and an evaluation of relationships that might exist between them, as well as discussion of whether the results can be correlated with incidents of smoke-exposure of grapes. This study may therefore provide useful information to the wine industry through increasing understanding of ways in which problematic compounds (in this case VPs) contribute to sensory characteristics, and elucidating whether sensory predictions can be made from chemical data.
MATERIALS AND METHODS
Wines
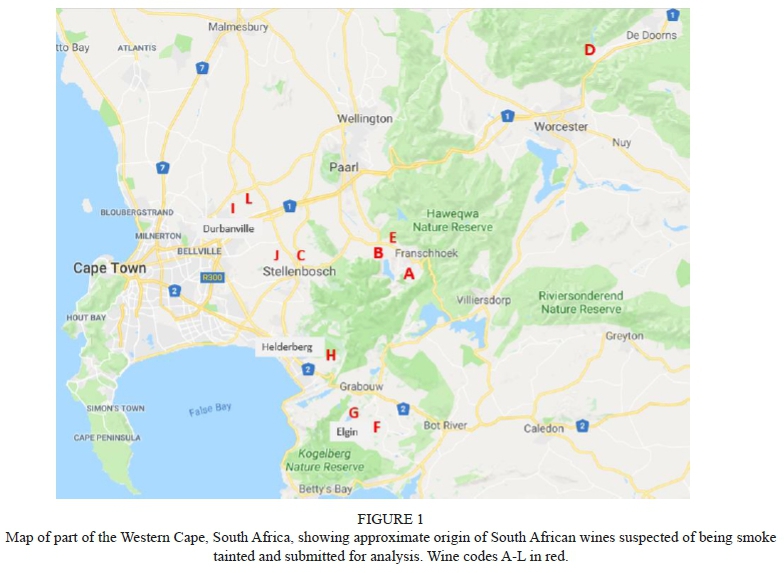
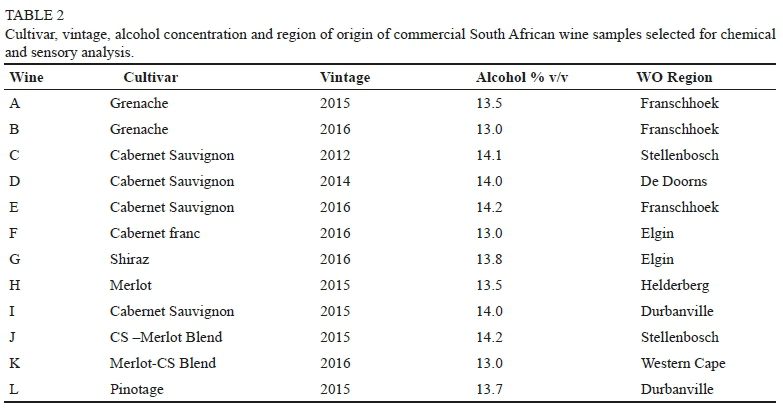
Wine samples (750 mL bottles) were randomly selected for this study from wines submitted during 2016 and 2017 by South African wine producers for sensory analysis at the DVO and VP analysis at the Central Analytical Facility (CAF) at SU. Only red wines were submitted by industry, therefore no white wines were available for the study. Producers had indicated that the submitted wines may have had smoke taint issues through vineyard expose to smoke, or as a result of their own informal assessment. The wines were from different South African Wine of Origin (WO) regions (see Figure 1 and Table 2), and were labelled A to L for the purpose of the study.
Wines were not prescreened before the study (except by producers), and it was therefore not known if the wines were actually contaminated with smoke or VPs. Twelve wines were selected for this study as this was the maximum that could be assessed by a sensory panel in one session using DA, without incurring sensory fatigue (Campo et al., 2010). Wines were stored in the Stellenbosch University 'vinothéque\ a wine storage area with controlled temperature (15 °C) and relative humidity (70%).
Sensory analysis
DA was conducted on the twelve wines selected for study. Ten assessors, all healthy non-smoking females with an age range of 20-60 years, took part in the sensory analysis panel sessions. All panelists, who regularly attended sensory analysis sessions at the DVO, and formed part of a formal 'smoke taint' panel, had previous experience in DA. Sensory data were obtained for this study in compliance with institutional procedures for sensory analysis (Ethical Clearance VIT-2018-6570). All participants provided their informed consent before participating in the study.
Sensory training
A combination of consensus and ballot training was conducted before testing in two training sessions, with an interval of one day between sessions. As smoke taint sensory analysis had been carried out with this panel previously, panelists were familiar with a number of smoke-related attributes, and therefore did not require the usual extensive training associated with DA.
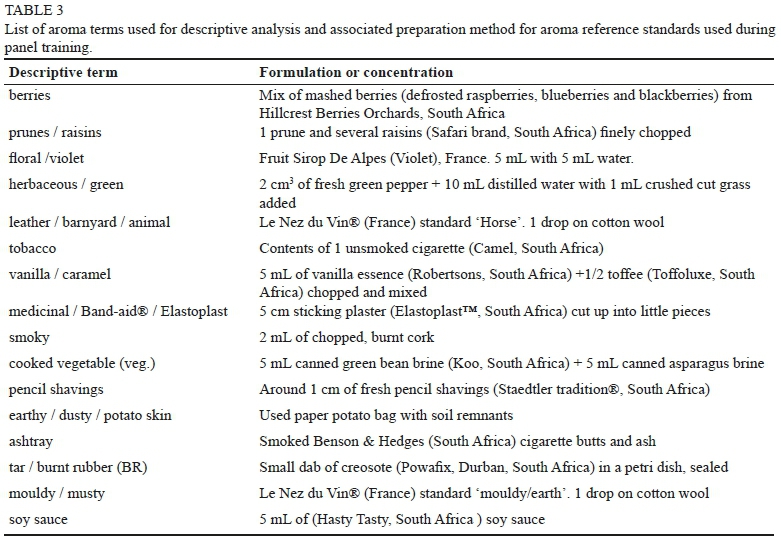
For the first thirty minutes of each training session, panelists were asked to re-familiarise themselves with an initial set of ten reference standards (based on previous smoke taint work), which were presented in 50 mL amber glass bottles (Consol glass, RSA). After a break of 20 min, panelists were presented with 20 mL of each commercial wine sample in black ISO 3591 standard tasting glasses (Consol glass, Stellenbosch, South Africa), and asked to assess wine aroma silently for around 30 min, using the agreed attribute lists, but also including any additional aromas perceived that were not on the list. Following this, the panel discussed the aroma attributes of each sample, and differences and similarities between samples, which were noted by the panel leader. These discussions generated a comprehensive list of aroma descriptors that were unique to the wines under study. The panel was also asked to rate the intensity of the various aroma attributes, and the panel leader noted frequencies and intensities on a whiteboard as the discussion took place. The panel agreed by consensus to include or exclude various aroma attributes, and reduce redundant terms, until a simplified list of descriptors was decided upon that described all the odour families present in the wines. The data regarding the descriptors and intensities were collected, sorted and tabulated at the end of each session by the panel leader. A final list of seventeen attributes for testing was confirmed after the last training session. These attributes, agreed upon through consensus by the panel, included 'sweet-associated'/ generally positive attributes: 'berries', 'floral / violets', 'prunes / raisins', 'vanilla / caramel', 'tobacco', and 'pencil shavings'. Attributes generally regarded as negative to red wine character were also identified: 'herbaceous / green', 'cooked veg.', 'leather / barnyard', 'earthy / dusty / potato skin', 'smoky', 'ashtray', 'medicinal / Elastoplast™' (also called 'Band-Aid'® by the panel), 'mouldy / musty', 'tar / burnt rubber (BR)', and 'soy sauce'. Reference standards for the aroma attributes are shown in Table 3.
Sensory testing
The sensory testing phase of the twelve wines was carried out in a well-ventilated, well-lit sensory laboratory with a temperature of 20°C. Each taster worked in an isolated white booth, and no communication was permitted between tasters. Wine samples of exactly 20 mL were presented to tasters in black ISO glasses (covered with clear inert polystyrene lids (Petri dish, Labsupply, Cape Town, South Africa)) to allow equilibration of volatiles in the headspace. The twelve wines were evaluated for aroma attributes only, in triplicate, over two sessions (three sets of six samples in each session). Samples were marked with random three-digit codes and presented to tasters according to William Latin Square design in a unique, counterbalanced manner to avoid order effects, such as those caused by fatigue or desensitisation of panel members. Tasters were also asked to pause for 15 min between sets. Tasters assessed the wines according to the prescribed attributes list, and assigned an intensity to the attributes perceived in the wine by marking on an unstructured line scale, with 0 as not perceived/lowest rating, and 100 as highest intensity. If an attribute was not present/perceived, the panelist was asked to assign zero on the line scale.
GC-MS analysis
Wines were analyzed by GC-MS according to a modified version of a previously described method (De Vries et al., 2016). Twelve VPs were quantified: guaiacol, 2,6-dimethyl phenol (2,6-DMP), 4-methylguaiacol (4-MG), o-cresol, phenol, 4-ethylguaiacol (4-EG), w-cresol, p-cresol, 2,3-dimethylphenol (2,3-DMP), eugenol, 4-ethylphenol (4-EP) and 3,4-dimethylphenol (3,4-DMP).
Stock solutions of 1 mg/L of pure compounds (all reference standards supplied by Sigma-Aldrich/Merck, KGaA, Darmstadt, Germany), were diluted for calibration purposes, creating an 8-point calibration series from 0.05 to 100 μg/L. Three 10 mL aliquots of each wine were transferred into 20 mL SPME glass vials (Gerstel, Mülheim, Germany). An internal standard, deuterated anisole-d8 (methoxybenzene-d8; Sigma-Aldrich/Merck, Darmstadt, Germany), was added to each vial at a concentration of 10 μg/L. Two mL of 30% w/v NaCl (Merck, Germany) in ultra-pure distilled water (Millipore, Bedford, MA, USA) was also added to each vial. The vials were sealed with PTFE-lined magnetic crimp caps (Gerstel), and vortexed (Vortex-Genie® 2; Scientific Industries Inc., NY, USA) for 30 seconds before being placed on the auto-sampler (Thermo Scientific TriPlus RSH). Vials were incubated in the auto-sampler for 5 min at 50 °C, after which a pink 65 μm Polydimethylsiloxane / Divinylbenzene / (PDMS/DVB) / 'Stableflex' SPME fiber (Supelco, Belafonte, PA, USA) was exposed to the headspace for 15 min at the same temperature. After exposure, the fiber was injected and left for 10 min in order to allow desorption of volatiles. The injector was operated in splitless mode. Analysis of VPs was performed using a Thermo Scientific trace 1300 gas chromatograph (Anatech, coupled to a Thermo Scientific TSQ 8000 Triple Quadrupole Mass) (Anatech Instruments (Pty) Ltd, RSA). The MS-detector was set for acquisition in single reaction monitoring (SRM) mode. Chromatographic separation of the VPs was performed on a polar Zebron ZB-FFAP (30 m, 0.25 mm ID, 0.25 μπι film thickness capillary column. The initial oven temperature was 50 °C, held for 3 min, then increased to a final temperature of 250 °C at a rate of 15 °C/min and a final hold time of 3 min. The injector, ionization source and transfer line temperatures were maintained at 250 °C. Helium at 1 mL/min flow rate was used as carrier gas. The emission current of 50 μA was used with argon collision. Compounds were identified by cross-referencing retention times and mass spectra with the NIST11 spectral library. The limit of detection (LOD) and limit of quantitation (LOD) for analytes were calculated using the slope of the calibration curve for each compound and the standard deviation of the response at low concentrations (σ) where LOD = 3.3 σ / slope and LOQ = 10 σ / slope.
Data analysis
A mixed model two-way analysis of variance (ANOVA) was applied to assess the significance of the attributes and panelists' performance, using both PanelCheck® version 1.2.1 (Nofima, Âs, Norway) and Statistica version 12 (StatSoft Inc., Tulsa, USA). Consensus amongst panelists was assessed by Tucker plots. Post hoc Fisher's least significant difference (LSD) and least squares means (LSM) were used to test for significance of sensorial differences between the wines. A p-value threshold of 0.05 was used to determine statistical significance. Principal component analysis (PCA) bi-plots and 'heatmaps' were created using sensory and chemical data, to demonstrate similarities or dissimilarities between wines. To illustrate associations between sensory attributes and VP chemistry, multiple factor analysis (MFA) was performed. Wine sensory data, as well as sensory and chemical interactions were analyzed using Statistica 12 (Dell Software, Texas, USA). 'Heatmaps' were generated for sensory and chemical data using R 3.4.2 (R Core Team, 2015).
RESULTS
Sensory results
The twelve wines were evaluated for attributes using DA with a trained sensory panel. Separate ANOVAs were generated for each attribute using a mixed model with panelists as the random effect.
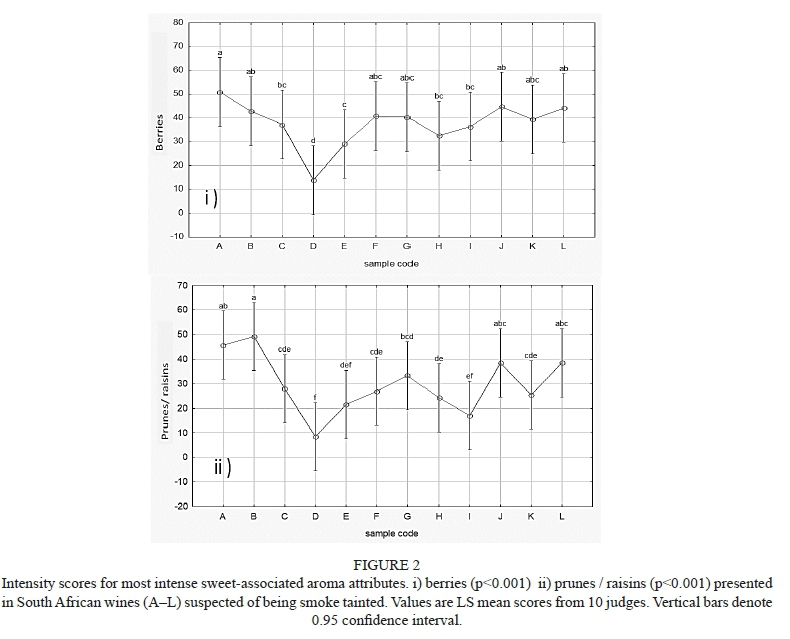
Data are not shown for attributes that were perceived at low intensity (<20), and were similar in all the wines with no significant differences (p>0.05) between wines. These include positive (sweet / fruity) attributes 'vanilla / caramel', 'tobacco', 'pencil shavings' and 'floral / violet'. The two most intense fruity / sweet attributes, i.e. 'berries' and 'prunes / raisins' can be seen in the LSM diagrams in Figure 2. Wine D was perceived as significantly lower than all other samples in these two attributes.
Figure 3 shows selected negative or off-flavour attributes ('smoky', 'ashtray', 'herbaceous / cooked veg', 'medicinal / Elastoplast™', 'leather / barnyard', 'tar/burnt rubber (BR)', 'earthy / dusty / potato skin'), with wines C, D, E and H presenting these most strongly.
A clustered 'heatmap', a compact means of visualizing large data sets with a number of variables (Perez-Llamas & Lopez-Bigas, 2011), was produced from the sensory data for the twelve wines, giving an holistic picture of their attributes, and providing information on the differences and similarities between the wines (Figure 4). As the sensory data was unitless (0-100 line scale scores for intensity of each attribute), it was not necessary to normalise the dataset before compiling the heatmap.
On the horizontal axis, the seventeen aroma attributes are shown. Vertically, wines A to L are presented and the differences in the wines per attribute can be seen. Colour (or a shaded scheme) is used to represent 'bins' of average intensities for each attribute according to the 0-100 scale assigned by panel members. Wines are grouped in a dendogram on the left hand side of the heatmap based on a standard hierarchical clustering of similarity or dissimilarity of attributes and intensities. As can be seen, wines B, L, A, J and G are most closely associated with berry and prune flavours, and few other attributes. Wines K, I, F and C are grouped together and share lower intensity of most attributes generally, and exhibit some negative attributes like 'leather / barnyard' and 'tar / BR' at low levels. Wine D has strong intensities of negative attributes, but is in a sensory grouping with wines H and E, which are linked strongly through the 'earthy / dusty / potato skin' descriptor. These results mirror some findings from the LS means of the selected attributes (Figure 3).
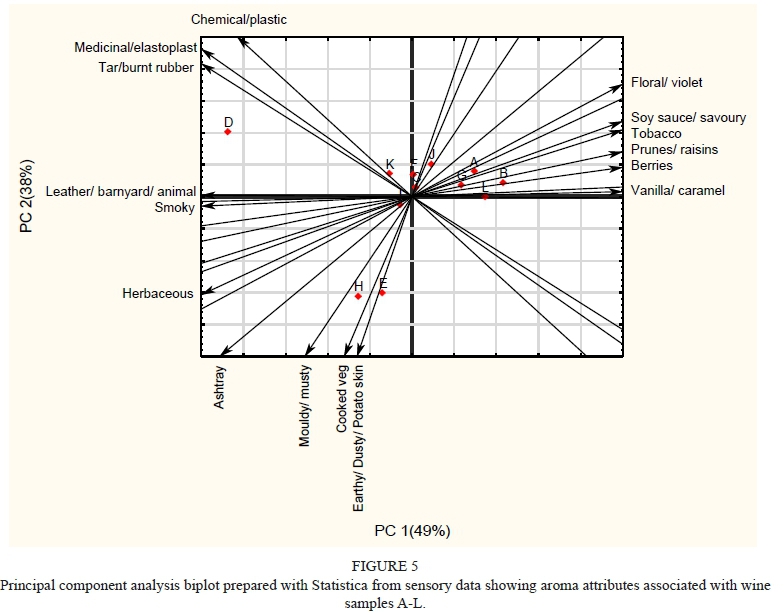
In the PCA biplot (Figure 5), the first two principal components explain more than 80% of the variation in the sensory dataset. The data for wines J, L, K, I and C show relative groupings with wines A, B, L and G in the quadrant closest to descriptors such as 'berries', 'floral / violet', 'prunes / raisins' and 'vanilla / caramel'. These two groupings (J, F, L, K, I, C and A, B, L, G) are present for both PC1/2 and PC1/3 (not shown). Wines H and E form a group that is associated with descriptors such as 'cooked veg.', 'mouldy / musty' and 'earthy', and these wines separate on PC2. Wine D separates out most strongly from all the other wines, and is most closely associated with wines that have attributes 'leather / barnyard' and 'tar / BR', and shows very high intensities for these attributes (mean intensity >60 on a 100 point scale).
GC-MS results for VP analysis
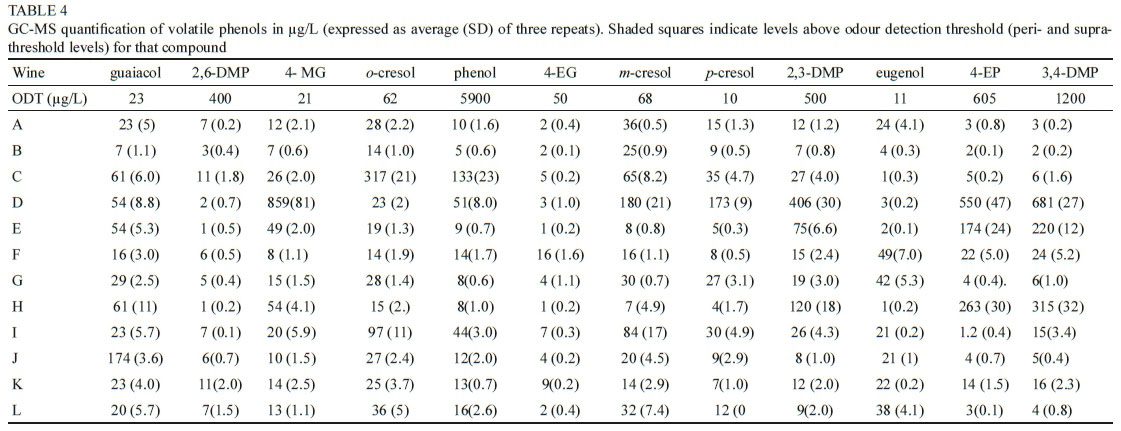
Results for the GC-MS analysis (averages for three instrumental repeats) of VPs are listed in Table 4, which also indicates where levels of compounds exceed the ODTs commonly used in the literature. Where possible, ODTs for red wine were used, but if not available, the ODT most appropriate to the study was considered.
As can be seen from Table 4, all of the wines contained at least one of the VPs at peri- or supra-threshold levels, and all of the wines (except B, J and L) contained guaiacol and p-cresol at potentially detectable levels. A few wines (C and D in particular) were notable in their very elevated levels of specific VPs. Most wines had low levels (below ODT) of the eugenol, phenol and 2,6-dimethyl phenol. Guaiacol is present at twice odour threshold in wine D. The level of 4-MG is 859 μg/L, around 40 times its ODT in water. The cresols are also found in high concentration in wine D: /w-cresol is present at 180 μg/L, or around three times its ODT in model wine; p-cresol at 17 times its ODT in model wine (173 μg/L). The xylenols are also present at higher levels than in the other wines: 2,3-DMP almost at its ODT levels and 3,4-DMP a 681 μg/L, at around half its ODT. Significantly, 4-EP is present very near its ODT (550 μg/L).
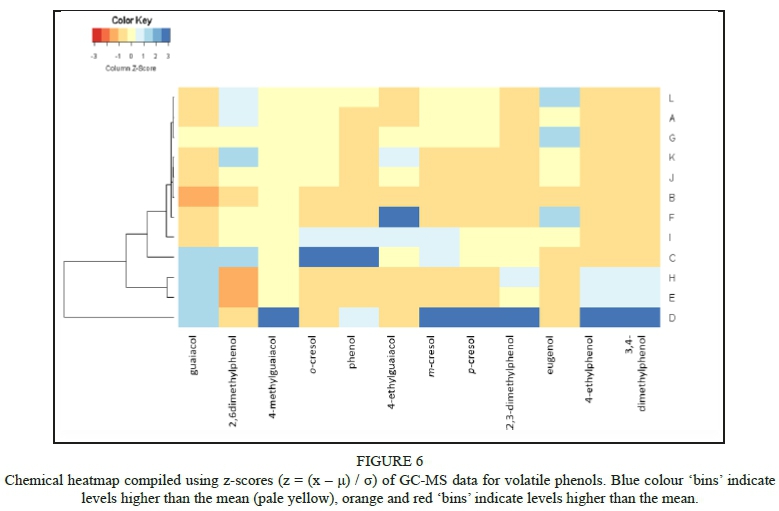
A heatmap was also compiled for the VP data (Figure 6). As the VP data showed levels that differed by several orders of magnitude (Table 4), standard scores (z-scores) were calculated in order to standardize the data, and minimize distortions caused by different compound levels.
The z-score for each compound was calculated using the formula z = (x - μ) / σ where x is the individual concentration value for the compound, μ is the mean for each compound group, and σ is the standard deviation for the group. Compounds are presented on the horizontal axis, and wines A to L are presented vertically so that the differences in the wines per compound (z-score) can be viewed. As previously, colour is used to represent 'bins' of average intensities for each compounds according to the VP z-scores with blue indicating levels higher than the mean (pale yellow). Wines are grouped on the left hand side of the heatmap based on a standard hierarchical clustering of similarity or dissimilarity of z-scores.
Inspection of the chemical heatmap shows similarities in wine groupings compared to those in the heatmap of sensory attributes (Figure 4). Wine D stands apart from the other samples (especially regarding its very high 4-MG content), with the closest group of wines in terms of chemical composition being E and H (notably high in guaiacol, 4-EP and 3,4-DMP). There is dissimilarity between these three wines (D, E and H) and the rest of the samples, which have much lower VP contents.
Within the larger sample grouping, F and C have similar levels of 4-MG, o-cresol and phenol. Wines L, A and G form a grouping, very closely related to K, J and B, based on low phenolic contents, with only 2,6-DMP and eugenol for the former grouping showing z-scores slightly higher than the mean.
Combined sensory and chemical data
A multiple factor analysis (MFA) correlation plot was generated combining results for 12 VPs and 17 aroma attributes (Figure 7). Compounds and / or attributes that contributed to the first and the second dimensions are located within the two correlation circles. Together the two dimensions account for 66.1% of the variance within the dataset. The inner circle represents a correlation factor (R2) of 0.7 and the outer circle a correlation factor (R2) of 1. In Figure 7A, attributes located along the positive axis of dimension 1 include 'chemical / plastic', 'tar / BR', 'medicinal / Elastoplast™', 'leather / barnyard'.
These attributes are associated with p- and /w-cresol, 4-MG, 2,3-DMP, 4-EP and 3,4-DMP. Wine D is positioned in this region of the MFA (Figure 7A), but the samples are so different from each other that they span a very wide range (Figure 7B) along dimension 1 (with wine D separating out from other wines) and dimension 2 (with wines E and H separating from other wines). Attributes located along the negative axis of dimension 1 are 'prunes / raisins', 'floral / violet' and 'tobacco', and most of the wines form a grouping in the negative quadrant along dimension 1 closer to these attributes and associated with eugenol, 2,6-DMP and 4-EG. The broad separation in dimension 1 therefore seems to be between sweet-associated attributes and faulty / negative attributes on the opposite side of the plot origin. Dimension 2 separates chemical-related attributes including 'chemical / plastic' and 'tar / BR', rubber and more vegetal-earthy attributes in the negative direction of this dimension. VPs associated most closely with the chemical attributes are p-and m-cresol, and 4-MG. Guaiacol is most closely associated with the 'smoky', 'ashtray' and interestingly, 'herbaceous'. Most of the wines have sweet-associated attributes, but wine D is strongly separated out from the other wines and associated with 'chemical' type faults, and wines E and H associate strongly with the 'earthy / dusty', 'cooked veg' and 'mouldy / musty' attribute set.
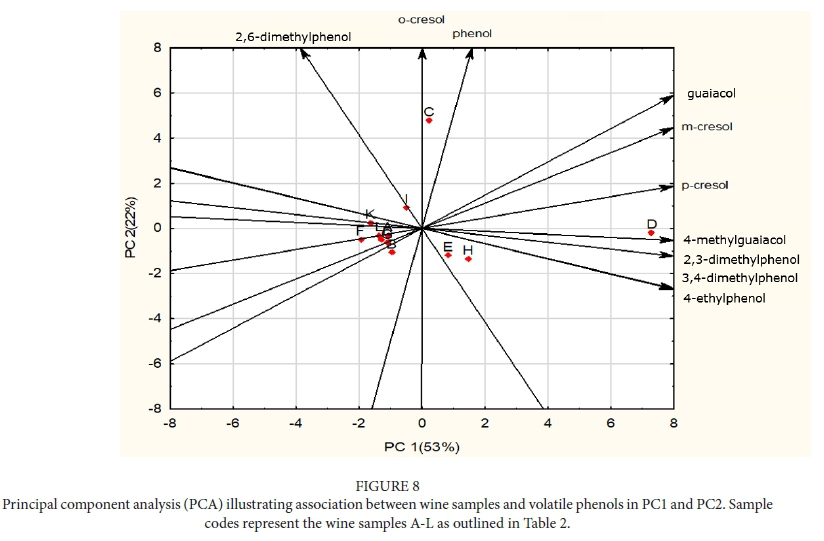
From this dataset, it appears that o-cresol and phenol are associated equally with positive and negative attributes. In the PCA of chemical compounds and wines (Figure 8), Wine D separates strongly along the first principal component as a result of its complex chemical composition (Figure 8) and wine C separates out along the second principal component from the other wines, possibly because of higher o-cresol and phenol content (Table 4).
DISCUSSION
Although previous research has shown the importance of VPs in smoke taint, it is crucial to consider aspects other than the VP concentrations that can impact on the aroma of wines. It is well known that the grape cultivar plays an important role in the overall aroma profile of the wine due to the presence of primary aroma components such as terpenes, methoxypyrazines and norisoprenoids (Ilc et al., 2016) that migrate from the grape to the wine during the vinification process. Compounds at peri- or sub-threshold levels may have their sensory contribution merged with that of the cultivar, with subsequent masking (Hein et al., 2009). Wine age has an impact on the formation of aging bouquet, and may increase levels of ethyl acetate and acetaldehyde that could have a masking or additive effect on certain components (Coetzee et al., 2016). Ethanol concentration has been shown to affect the volatility of certain components, and the perception of aroma; for example, the intensity of the smell of a mixture of nine fruity compounds in alcoholic solution was shown to decrease with the amount of ethanol present in the mixture (Escudero, et al., 2007). When ethanol was not present, the aroma was strong; however, as the concentration of ethanol increased in the study matrix, the intensity of the fruity odour decreased as ethanol concentration increased (Escudero et al., 2007). Goldner et al. (2009) showed that wines with the same aroma composition but higher alcohol levels were described as herbaceous instead of fruity. A reduction in alcohol content in wine can affect perceptual interactions between woody and fruity wine odorants and modify their chemical proportions (Le Berre et al., 2007). In the current sample set, alcohol concentrations (provided by the producers) ranged from 13% v/v to 14.2% v/v, but the alcohol levels of the wines did not appear to have any influence on aroma attributes. It is also noteworthy that the odour detection thresholds for six of the VPs analyzed are only available in the literature for water, and two are available only for alcohol (model wine) solution (Table 1). Only four of the compounds in this study have had ODT levels established in red wine, and given the potential matrix effects, these thresholds may not be comparable. The ODTs can only offer a tentative guideline as to how powerful the odour activity of a compound will be in a different matrix. OAVs were not calculated for this reason.
VPs are known for being produced during bushfires (Krstic et al., 2015), absorbed by grapes (Ristic et al., 2015), and carried through to wine (Ristic et al., 2011). It was therefore of value to consider bushfire events that may have impacted grapes prior to harvest. The Western Cape in South Africa has hot, dry summers, and the natural vegetation (the fynbos) has evolved to burn regularly (Strydom & Savage, 2016). Fynbos fires are rapid and fairly cool, moving very fast over mountainous regions with the assistance of often gale-force South Easterly winds, accompanied by smoke that can cover hundreds of square kilometers. Vineyards are located all over the province, and are frequently in the path of these bushfires. It is not unlikely, therefore, that grapes will be exposed to a range of smoke-associated volatiles including VPs, which may then transfer to wine (De Vries, et al., 2016).
Two sources were used to trawl historical data on fires in the Western Cape. These were Forest Watch (Fire) (https://fires.globalforestwatch.org/) and Advanced Fire Information Systems (AFIS) (https://southernafrica.afis.co.za/). Both websites provide detailed data on various aspects of bushfire monitoring via low earth orbit satellite, and have historical archives relating to fire events going back to 2008 and covering most land masses, and are a very useful resource for tracking fires in real time.
Although the phenological stage of smoke events discussed below is unknown, dates for bushfire data were targeted for the typical harvesting period for red wines in the Western Cape, viz., February to April. The closer to harvest the fire event occurs, the more impact it will have on the aroma of wine made from smoke-affected grapes (Shepherd et al., 2009; Kennison et al., 2009). It is acknowledged that this is a wide window, but the potential for smoke taint exists. A number of the aroma attributes may be explained in terms of the VP composition of the wines in this study, and the available ODTs for the various compounds. The PCA of the sensory results of the wines supports the frequency and intensity listings given in the heatmap and in the LS means graphs, as it shows that the data for samples separate into groups (Figures 3 and 4). The dendogram of chemical results (Figure 4) also shows a separation according to chemistry into similar groupings.
Based on the sensory and chemical data wines A, B, G, J and L formed a broad chemical and sensory association with low VP contents, and positive aroma attributes. Sensory characterization of these wines showed high levels of sweet-associated attributes, with the 'berries' descriptor, and 'vanilla / caramel' being the attributes with the highest means. As can be seen in the sensory heatmap (Figure 4), few negative descriptors were given for this group of wines. Wines A and B were Grenache from the Franschhoek region of the Western Cape (2015 and 2016 vintages respectively), wine G was a Shiraz from Elgin (2016), and Wines J (a blend) and L (Pinotage) were both vintage 2015. Based on date queries with ForestWatch and AFIS websites, these wines were all from regions that were unaffected by bushfires during the period leading up to harvest, with the exception of wine B. Fires between February and April 2016 in the La Rochelle Nature Reserve, as well as near the Berg River dam in Franschhoek may have affected this wine, but it was subject to one round of reverse osmosis (RO) due to suspected smoke taint. The winemaker submitted the wine for VP analysis to check that the RO had worked, which sensory analysis confirmed. There were no fires reported in 2015 in the Franschhoek valley during the period leading up to harvest. There were fires in the Grabouw town area between March and April 2016, which may have affected wine G, however, it showed no significantly negative characteristics despite having peri-threshold levels of guaiacol and p-cresol. Wine producing areas in Elgin lie to the south east of Grabouw, and prevailing wind is a strong south easterly wind throughout summer over this region. Smoke and ash would be likely to have been carried on the wind over the mountains to the Southeast towards the Helderberg basin, away from Elgin. Wine J was a Cabernet-Merlot blend from the Stellenbosch region, and most associated with the 'floral' descriptor (mean intensity of 23.77 on a 100 point scale). There were no fires recorded in the Stellenbosch region in 2015, although it was a year in which extensive fires occurred in other regions. Durbanville was unaffected by bushfires in the period leading up to harvest 2015, and wine L (a Pinotage from Durbanville) did not exhibit any strong smoke-related attributes. In fact, wine L showed a tendency to be lower in negative attributes like 'tar / BR', 'medicinal / Elastoplast™' and 'cooked veg.' than most of the other wines.
The second grouping of wines that is suggested by chemical and sensory data is the K, I, and F group, which unlike the first group, is not associated with positive fruity descriptors. These data support the findings by Atanasova et al. (2005) who observed that sub- and peri- threshold concentrations of woody compounds (including guaiacol) can modify the perception of a supra-threshold fruity odour. Wine F (a 2016 Cabernet Franc from Elgin) does not have any VPs at peri- or supra-threshold levels (Table 3), and does not exhibit any high intensities of aroma characteristics. The descriptors with the highest means for wine K were 'tar / BR' (mean intensity of 33), and 'leather / barnyard' but these were not significantly different from a number of the other wines. Wine K is WO 'Western Cape' (vintage 2016), Merlot and Cabernet Sauvignon blend, which indicates that the grapes may be sourced from different areas of the province. This wine contained guaiacol at peri-threshold concentration, but all other VPs were well below their ODTs. As previously noted, the Western Cape (Figure 1) was affected by severe bushfires during 2015 and 2016, which may explain the presence of guaiacol. The wine may also have had wood maturation, as this was not specified by the producers when samples were submitted. Wine I was a Cabernet Sauvignon from the Durbanville region (vintage 2015). Despite having a number of VPs at peri- and supra-threshold level (Table 3), this wine had no outstanding negative attributes. There were no notable fire events in Durbanville area during February to April 2015. Five of the VPs are present at supra-threshold levels, which would suggest that they should be detected by a trained panel, but this was not the case. The wines did express high fruit intensity, and this could well have masked any sensory contribution by the VPs present in these wines, as has been indicated by Atanasova et al. (2005) previously. These authors, and later De Vries et al. (2016), showed that guaiacol could contribute 'sweet, woody' notes to wine, which cannot be considered off-flavours, but Lorrain et al. (2013) found that VPs could impact red wine esters (sweet, fruity notes), so the olfactory space is complex. Additionally, the presence of other compounds like IBMP, which is known to be an important primary aroma contributor in Cabernet Sauvignon, and can affecting olfactory perception and mask other contributors (Hein et al., 2009).
Wine C (a Cabernet Sauvignon from the Stellenbosch WO region, vintage 2012) shares some characteristics with the K, I, F grouping, but also with wines H and E. AFIS recorded large bushfires between February and April 2012 in the Jonkershoek region, directly due South East of Stellenbosch. Wine C had the highest levels of o-cresol and phenol of all the wines, which would explain the significantly higher (p < 0.05) 'smoky' attribute (Figure 3-i). The 'leather / barnyard' (Figure 3-vi, mean intensity of 33.03) was higher than all other wines except H. This attribute is interesting because it is normally associated with 4-EP, and wine C contains negligible levels of this compound. The 'leather' characteristics may be due to olfactory effects of the cresol and phenol with other compounds, including IBMP, which have been described before (Lorrain et al., 2013; Campo et al., 2005).
Wines E (Cabernet Franc) and H are strongly associated with negative attributes (Figures 3 and 8). Wine E was a Cabernet Sauvignon from Franschhoek (2016), and was significantly higher (p < 0.05) in 'earthy / dusty / potato skin', 'mouldy / musty' and 'ashtray' attributes. Fires between February and April 2016 in Franschhoek may have affected this wine. As Franschhoek lies in a valley between high mountain peaks, smoke could have been trapped in the in low-lying areas and affected grapes in the period leading up to harvest. As this is also Cabernet Sauvignon, it is possible that the 'earthy / dusty / potato skin' could have been the result of supra-threshold levels of guaiacol and 4-MG interacting with IBMP and causing olfactory effects.
Wine H (Merlot) was also significantly higher (p < 0.05) in the 'earthy / dusty / potato skin' (mean intensity of 60.45) attribute than all the other wines (Figure 3). There were numerous large bushfires during March-April 2015 across the Western Cape, but particularly bad fires in the Helderberg region, with smoke trapped for several days in the Helderberg basin. Previous work by Australian researchers has shown that repeated or extended periods of smoke exposure of vineyards can lead to a cumulative effect in associated wines (Kennison et al., 2009). Fires burned for days in the Steenbras area with a prevailing wind from the Southeast taking large quantities of smoke and ash into Helderberg valley and wine producing areas. Wine H is significantly higher in the ashtray attribute (Figure 3ii), and shows 'green' characteristics as it is significantly higher in 'herbaceous' attribute (Figure 3iii) and the 'cooked veg.' attribute (Figure 3iv), both of which are associated with the cultivar, but may have been perceptually enhanced by the presence of smoke-derived compounds. This wine also is one of the highest in 'leather / barnyard' aroma. In wine samples E and H, guaiacol and 4-MG are present at supra-threshold levels, and 4-EP and 3,4-DMP are at approximately half their literature threshold values. The MFA (Figure 7A) indicates that 4-EP and 3,4-DMP are associated with 'leather / barnyard / animal' attributes. Guaiacol is associated strongly with the 'smoky' and 'ashtray' attributes (Figure 7A), but also, interestingly, is also close to the 'herbaceous' and 'mouldy / musty' attributes. In the MFA, o- and p-cresol, as well as 4-MG and 2,3-DMP are associated with 'chemical / plastic', 'tar / burnt rubber' and 'medicinal / Elastoplast™' attributes. The wines were submitted as definitely or potentially smoke-tainted by industry, and it may be that the mouldy, leathery or herbaceous characteristics could have added to, or been mistaken for smoke taint by industry members not specifically trained in identifying smoke taint attributes.
Wine D was chemically characterized by intense negative attributes, and high VP content (including, but not limited to, 4-MG at 859 μg/l, m- and p-cresol at ~180 μg/L, and 4-EP at 550 μg/L), which greatly exceeded published ODTs for these compounds. This wine separated out in both sensory and chemistry results from other samples. The wine was sensorially characterized by 'medicinal / Elastoplast™' (mean intensity of 68.53), 'tar / BR' (60.87) and 'chemical / plastic' (30.47) attributes, all significantly higher than other wines (Figures 3 and 4). The 'leather / barnyard' (intensity of 37.87) attribute was also higher than most of the other wines. This wine is from the De Doorns region, vintage 2014. It is a Cabernet Sauvignon, a cultivar that is traditionally harvested fairly late in the season. As most of these wines were submitted for assessment for smoke taint, it is probable that this wine was made from grapes affected by bushfires in the De Doorns region. March-April data for 2014 from the AFIS system shows bushfires on the slopes of the mountains directly to the south, and close to the town. As the WO area is in a long, deep valley running approximately north to south, with wine and grape growing areas spread across the bottom of the valley, it is entirely feasible that smoke settled in the valley, and was absorbed by grapes prior to winemaking. Previous work in this area of research has suggested that combinations of VPs can cause a 'burnt rubber' or 'tar' attribute (Panzeri, 2013), as seems to be the case in the last wine sample D.
Despite this, the levels of VPs in the samples, specifically 4-MG, o- and p-cresol and 4-EP, are not necessarily consistent with wines made from grapes that have been exposed to natural wildfires where guaiacol and syringol can be elevated (Hayasaka, et al., 2010; Parker et al., 2013; Krstic, 2015). Likewise, there are a number of aromas ('earthy / dusty / potato skin', 'cooked veg.', 'mouldy / musty' and 'herbaceous') that are not explained by close association with specific VPs at peri- or supra-threshold concentrations, and which may be the result of olfactory effects of sub-threshold combinations. It may also be the case that the VP levels in wines D, and E, (given the elevated levels of 4-EP), could have been due to other sources such as Brettanomyces yeast infection in barrels, toasted oak wood contact and/or the presence of creosoted wooden posts in or near vineyards. Wines E and H (Merlot and Cabernet Sauvignon) could simply be reflecting varietal character in their 'green' notes.
CONCLUSIONS
This study investigated the levels of volatile phenols (VPs) found in South African red wines that have been selected by industry as actually or potentially smoke tainted. As the sensory panel used in this study was experienced in smoke taint analysis, it is likely that this sensitivity could have contributed to the fact that taint-related attributes were responsible for most of the variation within the sensory sample set. However, VP content of samples could be correlated, in most but not all of the cases, to sensory descriptors for the wines, when odour detection thresholds for the compounds were taken into account. For example, it was demonstrated that certain sensory attributes ('smoky', 'ashtray') in some of the wines could be ascribed to higher levels of specific, or combinations of, VPs at peri-threshold levels. In other cases, however, it appeared that combinations of compounds (for example, cresols and xylenols) at sub-threshold levels led to unexpected sensory effects ('earthy / dusty', 'chemical' and 'tar / burnt rubber'). Guaiacol was present in eight of the twelve samples at or above ODT, but as the wines had been submitted by industry for suspected, or perceived smoke taint, this result was not surprising. Also, whether samples had received any oak treatment was omitted from the information provided on the samples, and wood treatment is a well-known source of this compound. Guaiacol did not seem to be correlated with a perception of 'smoke' in any of the wines unless it was in combination with other phenols, and in fact may have contributed to sweet-associated and fruity aromas in the majority of samples. Out of twelve wines, the four (C, D, E and H) that were described with the most negative attributes, at significantly higher levels than the others, were all from regions that had experienced severe fire events. Out of the eight wines that did not show negative attributes, only two were from regions that had experienced bushfires in the period leading up to harvest, and one of these had been treated with reverse osmosis.
A prescreening of the samples by expert tasters in smoke taint may have established that a number of the wines were not affected by smoke taint, negating the need for full sensory analysis and analysis. However, this requires that industry and/or researchers be trained to a high level. The subsequent investigation and discussion highlights the fact that these issues are more complex than smoke exposure of grapes causing smoke taint in wine, and the uncertainty around this type of information. There is certainly a need for better methods for monitoring smoke exposure in wine regions.
This study also emphasizes the importance of understanding the effects of compounds like VPs on wine, and escalating awareness of, and sensitivity to, the interactions and synergies between them. Further research would help to clarify effects of compounds at various levels and in different matrices. Confirming odour detection thresholds in specific matrices would be beneficial, as there seems to be limited information published in this regard. There is also value in investigating amelioration of the sensory effects of VPs if they are prominent and negatively impact wine quality.
LITERATURE CITED
Atanasova, B., Thomas-Danguin, T., Langlois, D., Nicklaus, S., Chabanet, C. & Etiévant, P., 2005. Perception of wine fruity and woody notes: influence of peri-threshold odorants. Food Qual Prefer. 16, 504-510. [ Links ]
Barnes, T., 2018. Portugal wildfires. The Independent. (August 5). News/ World/Europe. Retrieved from: https://www.independent.co.uk/news/world/europe/portugal-wildfires-algarve-faro-monchique-latest-injuries-heatwave-europe-a8478066.html. [ Links ]
Boidron, J., Chatonnet, P. and Pons, M., 1988. "Influence du bois sur certaines substances odorantes des vins." Connaiss. La Vigne Du Vin. 22, 275-94. [ Links ]
Cadahía, E., Fernandez de Simón, B., et al., 2003. Volatile Compounds in Spanish, French, and American Oak Woods after Natural Seasoning and Toasting J. Agric. Food Chem. 51, 20, 5923-5932. [ Links ]
Campo, E., Ballester, J., Langlois, J., Dacremont, C. & Valentin, D., 2010. Comparison of conventional descriptive analysis and a citation frequency-based descriptive method for odor profiling: An application to Burgundy Pinot noir wines. Food Qual. Prefer. 21, 44-55. [ Links ]
Campo, E., Ferreira, V., Escudero, A. & Cacho, J., 2005. Prediction of the wine sensory properties related to grape variety from dynamic-headspace gas chromatography-olfactometry data. J. Agric. Food Chem. 53, 56825690. [ Links ]
Chatonnet, P., Dubourdie, D., Boidron, J. & Pons, M., 1992. The origin of ethylphenols in wines. J. Sci. Food Agric. 60, 165-78. [ Links ]
Coetzee, C., Brand, J., Emerton, G., Jacobson, D., Silva Ferreira, A. & Du Toit, W., 2015. Sensory interaction between 3-mercaptohexan-1-ol, 3-isobutyl-2-methoxypyrazine and oxidation-related compounds. Aus. J. Grape Wine Res. 21, 179-188. [ Links ]
Coetzee, C., Brand, J., Jacobson, D. & Du Toit, W. J., 2016. Sensory effect of acetaldehyde on the perception of 3-mercaptohexan-1-ol and 3-isobutyl-2-methoxypyrazine. Aus. J. Grape Wine Res. 22, 197-204. [ Links ]
Cox, L., 2018. Sydney's bushfire season starts in winter: We may have to rethink how we live. The Guardian International Edition, https://www.theguardian.com/cities/2018/aug/15/syd. [ Links ]
Czerny, M., Christlbauer, M., Fischer, A., Granvogl, M., Hammer, M., Hartl, C. & Hernandez, N., 2008. Re-investigation on odour thresholds of key food aroma compounds and development of an aroma language based on odour qualities of defined aqueous odorant solutions. Eur. Food Res. Techn. 228, 265-73. [ Links ]
De Vries, C. J., Buica, A., Brand, J. & Mckay, M., 2016. The impact of smoke from vegetation fires on sensory characteristics of Cabernet Sauvignon wines made from affected grapes. S. Afr. J. Enol. Vitic. 37, 22-30. [ Links ]
De Vries, C., Mokwena, L., Buica, A. & McKay, M., 2016. Determination of volatile phenols in Cabernet Sauvignon wines, made from smoke-affected grapes, by using HS-SPME GC-MS. S. Afr. J. Enol. Vitic. 37, 15-21. [ Links ]
Escudero, A., Campo, E., Farina, L., Cacho, J. & Ferreira, V., 2007. Analytical characterization of the aroma of five premium red wines. Insights into the role of odor families and the concept of fruitiness of wines. J. Agric. Food Chem. 55, 4501-4510. [ Links ]
Etievant, P. X., 1981. Volatile phenol determination in wine. J Agric Food Chem. 29, 65-67. [ Links ]
Fernandez de Simon, B., Cadahia, E., Sanz, M., Poveda, P., Perz-Margairno, P., Ortega-Heras, M. & Gonzalez-Huerta, C., 2008. Volatile compounds and sensorial characterization of wines from four Spanish denominations of origin, aged in Spanish Rebollo (Quercus pyrenaica Willd.) oak wood barrels. J Agric Food Chem. 56, 9046-9055. [ Links ]
Goldner, M., Zamora, M., Lira, P., Gianninoto, H. & Bandoni, A., 2009. Effect of ethanol level in the perception of aroma attributes and the detection of volatile compounds in red wine. J. Sens. Stud. 24, 243-257. [ Links ]
Goode, J., 2008. Burnt Rubber: The great South African wine debate. Retrieved June 26, 2018, from: http://www.wineanorak.com/blog/2008/10/burnt-rubber-great-south-african-wine.html. [ Links ]
Hammond, C.E., 2015. South African wine under fire. Retrieved June 26, 2018, from http://www.carolynevanshammond.com/blog/2015/10/12/south-african-wine-under-fire-1. [ Links ]
Hayasaka, Y., Baldock, G., Parker, M., Pardon, K., Black, C., Herderich, M., Jeffery, D., 2010. Glycosylation of smoke-derived volatile phenols in grapes as a consequence of grapevine exposure to bushfire smoke. J. Agric. Food Chem. 58, 20, 10989-10998. [ Links ]
Hein, K., Ebeler, S. & Heymann, H., 2009. Perception of fruity and vegetative aromas in red wine. J. Sens. Stud. 24, 441-455. [ Links ]
Heyns, E., 2014. The green South African palate - when does mint become eucalyptus or even downright weedy? Wineland Magazine. Retrieved June 26, 2018, from http://www.wineland.co.za/the-green-south-african-palate-when-does-mint-become-eucalyptus-or-even-downright-weedy/. [ Links ]
Ilc, T., Werck-Reichhart, D. & Navrot, N., 2016. Meta-Analysis of the core aroma components of grape and wine aroma. Front. Plant. Sci. 7 September, 1-15. [ Links ]
Jin, Y., Goulden, M.L., Faivre, N., Veraverbeke, S., Sun, F., Hall, A. & Randerson, J.T., 2015. Identification of two distinct fire regimes in Southern California: implications for economic impact and future change. Env. Res. Lett. 10, 094005. [ Links ]
Kennison, K., 2013. Effect of smoke in grape and wine production. Government of Western Australia, Department of Agriculture and Food Bulletin, Bulletin 4. [ Links ]
Kennison, K., Wilkinson, K., Pollnitz, A., Williams, H., & Gibberd, M., 2009. Effect of timing and duration of grapevine exposure to smoke on the composition and sensory properties of wine. Aus. J. Grape Wine Res. 15, 228-237. [ Links ]
Krstic, M., Johnson, D. & Herderich, M., 2015. Smoke-derived volatile phenols and their glycosidic metabolites in grapes and vines as biomarkers for smoke exposure and their role in the sensory perception of smoke taint. Aust J Grape Wine Res. 21, 537-553. [ Links ]
Lapalus, E., 2016. Linking sensory attributes to selected aroma compounds in South African Cabernet Sauvignon wines. Master's Thesis, Stellenbosch University, Private Bag X1, 7602 Matieland (Stellenbosch), South Africa. [ Links ]
Le Berre, E., Atanasova, B., Langlois, D., Etievant, P. & Thomas-Danguin, T., 2007. Impact of ethanol on the perception of wine odorant mixtures. Food Qual. Prefer. 18, 901-908. [ Links ]
Lorrain, B., Tempere, S., Iturmendi, N., Moine, V., De Revel, G. & Teissedre, P.L., 2013. Influence of phenolic compounds on the sensorial perception and volatility of red wine esters in model solution: An insight at the molecular level. Food Chem. 140, 76-82. [ Links ]
Panzeri, V., 2013. Influence of vineyard posts type on the chemical and sensorial composition of Sauvignon blanc and Merlot noir wines. Master's Thesis, Stellenbosch University, Private Bag X1, 7602 Matieland (Stellenbosch), South Africa. [ Links ]
Parker, B., Baldock, G., Hayasaka, Y., Mayr, C., Williamson, P., Francis, I. & Johnson, D., 2013. Seeing through smoke. Wine Vitic. J. 28, 42-46. [ Links ]
Parker, M., Osidacz, P., Baldock, G., Hayasaka, Y., Black, C., Pardon, K., Jeffery, D., Geue, J., Herderich, M. & Francis, I., 2012. Contribution of Several Volatile Phenols and Their Glycoconjugates to Smoke-Related Sensory Properties of Red Wine. J. Agric. Food Chem. 60, 2629-37. [ Links ]
Perez-Llamas, C. & Lopez-Bigas, N., 2011. Gitools: Analysis and visualisation of genomic data using interactive heat-maps. PLoS ONE 6, e19541. [ Links ]
Petrozziello, M., Asproudi, A., Guaita, M., Borsa, D., Motta, S., Panero, L. & Bosso, A., 2014. Influence of the matrix composition on the volatility and sensory perception of 4-ethylphenol and 4-ethylguaiacol in model wine solutions. Food Chem. 149, 197-202. [ Links ]
Prida, A. & Chatonnet, P., 2010. Impact of oak-derived compounds on olfactory perception of barrel-aged wines. Am J Enol Vitic. 50, 447-455. [ Links ]
PubChem. 2018. 2,3-Dimethylphenol C8H10O - PubChem. PubChem: Open Chemistry Database. 2018. https://pubchem.ncbi.nlm.nih.gov/compound/2_3-dimethylphenol. [ Links ]
Ristic, R., Boss, P. & Wilkinson, K., 2015. Influence of Fruit Maturity at Harvest on the Intensity of Smoke Taint in Wine. Molecules 20, 8913-8927. [ Links ]
Ristic, R., Fudge, A., Pinchbeck, K., De Bei, R., Fuentes, S., Hayasaka, Y., Tyerman, S. & Wilkinson, K., 2016. Impact of grapevine exposure to smoke on vine physiology and the composition and sensory properties of wine. Theor. Exp. Plant Phys. 28, 67-83. [ Links ]
Ristic, R., Osidacz, P., Pinchbeck, K.A., Hayasaka, Y., Fudge, A.L. & Wilkinson, K.L., 2011. The effect of winemaking techniques on the intensity of smoke taint in wine. Aus. J. Grape Wine Res. 17, 29-40. [ Links ]
Ristic, R., Van Der Hulst, L., Capone, D. & Wilkinson, K., 2017. Impact of bottle aging on smoke-tainted wines from different grape cultivars. J. Agric. Food Chem. 65, 4146-4152. [ Links ]
Romano, A., Perello, M.C., Lonvaud-Funel, A., Sicard, G. & De Revel, G., 2009. Sensory and analytical re-evaluation of 'Brett character.' Food Chem. 114, 15-19. [ Links ]
Strydom, S. & Savage, M., 2016. A spatio-temporal analysis of fires in South Africa. S. Afr. J. of Sci. 112, 1-8. [ Links ]
Tempere, S., Cuzange, E., Schaaper, M.H., De Lescar, R., De Revel, G. & Sicard, G., 2014. "Brett character" in wine: Is there a consensus among professional assessors? A perceptual and conceptual approach. Food Qual. Prefer. 34, 29-36. [ Links ]
Verschueren, K., 2001. Handbook of Environmental Data on Organic Chemicals. John Wiley & Sons, New York, USA [ Links ]
Weiss, S., 2014. The influence of grape variety on the production of volatile phenols in Portuguese wines.https://repositorio.ucp.pt/bitstream/10400.14/16238/1/Thesis_Katrin_SophieWeiss_MSc_SEFOTECH_FINAL.pdf. Accessed November 22, 2018. [ Links ]
Wilkinson, K.L., Ristic, R., Pinchbeck, K.A., Fudge, A.L., Singh, D.P., Pitt, K.M. & Herderich, M.J., 2011. Comparison of methods for the analysis of smoke related phenols and their conjugates in grapes and wine. Aus. J. Grape Wine Res. 17, S22-S28. [ Links ]
Wilson, C., Brand, J., Du Toit, W. & Buica, A. 2018. Interaction Effects of 3-Mercaptohexan-1-ol (3MH), linalool and ethyl hexanoate on the aromatic profile of South African dry Chenin blanc wine by Descriptive Analysis (DA). South African J Enol Vitic. 39, 271-283. [ Links ]
Submitted for publication: October 2018
Accepted for publication: May 2019
* Corresponding author: E-mail address: marianne@sun.ac.za; Tel.: +27-21-8083774
Acknowledgements: Prof. Martin Kidd of Stellenbosch University is acknowledged for analyzing the statistical aspects of the study. Winetech and THRIP (NRF) acknowledged funding associated with volatile phenol projects
Author disclosures: Marianne McKay, Astrid Buica and Florian Bauer conceived and designed this study; Lucky Mokwena performed the GC-MS volatile phenol analyses. Valeria Panzeri led the sensory analysis panel. Marianne McKay acquired the funding, carried out the experimental work and wrote the paper, which was revised and edited by all the authors.

