


Services on Demand
Article
 English (pdf)
 Article in xml format
 Article references
Indicators

Related links
-
 Cited by Google
 -
 Similars in Google
Share

 Permalink
South African Journal of Enology and Viticulture
On-line version ISSN 2224-7904
Print version ISSN 0253-939X
S. Afr. J. Enol. Vitic. vol.40 n.2 Stellenbosch 2019
http://dx.doi.org/10.21548/42-2-3375
The analysis of individual and polymeric phenolic compounds were also performed at 0M and for all treatments after 3 M, 6 M and 9 M of storage using RP-HPLC according to Garrido-Banuelos et al. (2019). WL samples were centrifuged for 5 min at 8000 rpm and 20 μL of the supernatant was injected. Calibrations were done for the following phenolic standards with additional compounds quantified as equivalents indicated in brackets: gallic acid, (+)-catechin ((-)-epicatechin, B1, polymeric phenols), caffeic acid (GRP, caftaric acid), p-coumaric acid, quercetin-3-glucoside (quercetin-3-glucuronide, quercetin-3-galactoside), quercetin, myricetin, kaempferol from Sigma-Aldrich Chemie (Steinheim, Germany), and malvidin-3-glucoside (delphinidin-, cyanidin-, malvidin-, peonidin-, petunidin- 3-glucosides, -3-acetyl-glucosides, -3-p-coumaryl-glucosides, polymeric pigments) from Extrasynthese (Lyon, France). The identification of the compounds was done based on retention times of standards and the UV-Vis spectra (acquired by injection of standards or from the literature). To simplify the large set of data, certain individual compounds were grouped, namely the sum of total hydroxycinnamic acids, total flavonols, the total glucosylated-anthocyanins, total acetylated-anthocyanins and total coumaroylated-anthocyanins.
Statistical analysis
All analyses were carried out using Statistica 13.2 (TIBCO Statistica software, Palo Alto, CA, USA). Significant differences were judged on a 5% significance level (p < 0.05) with Fisher LSD Post Hoc tests. Principal Component Analysis (PCA) was performed with SIMCA 14.1 software (Sarto-rium Stedim Biotech - Malmö, Sweden).
RESULTS AND DISCUSSION
Colour and phenolic extraction in the different extracts
Based on previous trials, all extractions were performed for nine days in order to allow for a better extraction from the grape seeds. At 0 M (after nine days of extraction) the colour density (CD) and the total red pigments (TRP) were similar between the three extracts. As expected, higher TP and tannin concentration were found in the SKSD and especially SK4SD samples prepared with more seeds, compared to SK (prepared with only skin tannins). Considering the individual phenolic compounds, especially gallic acid and catechin concentrations were significantly different between the different extracts at 0 M (Table 1).
Influence of a different phenolic extract on oxygen consumption
The oxygen consumption (mg/L) was firstly monitored for the C and Ox samples at 0 M, and only for Ox samples in the following oxygenations after 3 M and 6 M of storage. The oxygen consumption of the following oxidations was only monitored during the first three days (70-75 hours). As illustrated in Figure 1, the different extracts, which probably differ in concentration and chemical nature, clearly played a role as the oxygen consumption rates differed between the storage times and treatments. These differences in the oxygen depletion rates could possibly be explained by changes occurring in the phenolic profile and concentration of the extracts over time. Firstly, as shown in Figure 1 A1, there was a quick depletion of the low amount of oxygen present in C samples (probably due to a minimal oxygen intake during sample preparation). From Figure 1 A2, which illustrates the oxygen consumption in Ox vials at 0 M, minimal differences were found between the extracts. At 0 M, the higher phenolic levels, together with possible differences in the nature of the phenols, did not seem to influence oxygen consumption, differing from the findings of Pascual et al., (2017). In both cases, the dissolved oxygen in the different extracts was depleted after a few hours. On the other hand, the oxygen consumption rate varied over time, as the phenolic profiles of the extracts evolved. Oxygen consumption measured after 3 M was generally slower compared to 0 M (Figure 1 A3). Interestingly, after 3 M the oxygen consumption was slower in the SK4SD samples. We consider that the initial excess of seed phenols may have had an influence on the formation rate of new polymeric forms involving oxidative reactions during the early stages of storage. This may have led to an extract composition with lower levels of compounds susceptible to oxidation after 3 M. Furthermore, oxygen consumption observed in Figure 1 A4 was even slower for all three extracts after 6 M, probably also as a consequence of a lower substrate availability to react with oxygen in the WL media.
Colour and phenolic evolution of the final extracts
Differences were observed in terms of the colour parameter and phenolic levels as determined spectrophotometrically at 0 M, as well as a function of storage time. Storage time played a particularly important role, as significant differences were also found in colour and the phenolic concentration between the different extracts over time. Whilst the extract was the most important factor in determining TP levels and, obviously, the tannin concentration, oxygen had a large influence on the colour parameter such as the TRP and CD, especially the absorbance at 420 nm for the latter. Furthermore, time was also a determining factor, especially for the TRP.
The evolution of the phenolic parameters determined spectrophotometrically as a function of time (Table 1 supplementary) for the three extracts and C and Ox samples are shown in Figure 2. The cumulative effect of all the studied parameters drives a clear separation between the samples. In Figure 2 A1, it can be seen that the different extracts were separated along the PC1 axis (54.4%). As previously mentioned, the TP and tannin concentration were mainly influenced by the respective extract composition. The scores plot and the corresponding loadings plot (Figure 2- A1 and B) showed a general higher phenolic content in SK4SD treatments, especially compared to SK treatments. Over the course of time, these differences between the extracts became smaller, especially after 9 M, probably as a consequence of phenolic degradation, but also as a result of over-polymerisation reactions and subsequent precipitation of insoluble phenolic compounds. In Figure 2 A2, the samples are coloured according to the sampling stages (0 M, 3 M, 6 M and 9 M). After 9 M, the extracts were more closely distributed along the PC1 axis (54.4%). When the samples were coloured according to the C/Ox treatment, the samples were distributed along the PC2 axis (21.3%), with Ox samples being characterised by a generally higher phenolic and especially tannin concentrations (Figures 2 and 3). Contrary to the findings of Geldenhuys et al. (2012), oxygen was also found to play an important role in tannin concentrations (Figure 2 A3). However, Geldenhuys et al. (2012) applied progressive micro-oxygenation, whereas in this study a large amount of oxygen was added at a time.
A general loss of colour and reduction in phenolic levels was found over time, especially pronounced from 0 M (Table 1) to 3 M, except for the total tannin concentration as determined by the MCP method (Figure 3). As an example, TRP levels decreased in all the samples during the first 3M, especially in most of the C treatments (Table 1 supplementary). Oxygen seemed to have enhanced the polymerisation between certain compounds, thereby possibly limiting the degradation of certain red pigments. The TRP content was significantly higher in the SKSD and SK4SD Ox treatments at 3 M (Table 1 supplementary). From then onwards, the differences between C and Ox treatments and between the extracts became less over time.
Conversely, the tannin content showed different patterns from 0 to 3 M within the different treatments. As illustrated in Figure 3 (values at 0 M are specified on the Y axis), clear differences were found between C and Ox samples. While the MCP tannin levels were relatively constant from 0 M to 3 M in C samples (except for a slight increase in SKSD), an increase in the tannin concentration was observed in Ox (SKSD and SK4SD) samples during the same period. However, after 3 M, the tannin levels were only significantly higher in SK4SD-Ox samples compared to the corresponding C samples (Figure 3). During the following three months, the C treatments showed a progressive decrease in tannin concentration, except for the SK treatment (constant from 3M to 9M), while not changing significantly up to 9M. (Figure 3). On the other hand, the Ox treatments' tannin levels increased (SK and SKSD) or remained stable (SK4SD) up to 6M of storage, which might also explain the different oxygen consumption rates observed for the second oxidation step after 3M of storage. From then, all the Ox extracts experienced a general decrease in tannin concentration towards the last sampling stage (9M). This decrease can possibly be explained by the formation of larger and/or more unstable polymers which are no longer soluble in the hydroalcoholic solution. Thus, the oxygen had an impact on the tannin polymerisation reactions, and likely the reactivity of the polymerisation reaction products towards methylcellulose (Figure 3). The significant role of oxygen in tannin polymerisation has been widely documented in literature (Singleton, 1987; Castellari et al., 2000; Atanasova et al., 2002; Waterhouse & Laurie, 2006; Gambuti et al., 2013; Quaglieri et al., 2017).
Oxygen also influenced the evolution of the amount of TRP in the extracts. In the presence of oxygen, higher phenolic levels might compete for reaction with oxygen, favouring specific polymerisation reactions. Thus, the higher pigment content can be explained by the depletion of oxygen as a consequence of the reaction of other phenolic compounds with oxygen, instead of the anthocyanins/pigments.
HPLC data for individual phenolics
Results obtained for the RP-LC analysis of selected individual phenolic concentrations are summarised in Tables 1 and 2. The different extracts, the presence/absence of oxygen and storage time played a role in affecting the phenolic composition of the treatments. Large differences in gallic acid concentrations were found between the three extracts. Higher amounts of seeds led to an obvious increase in gallic acid content (Table 1) at 0 M. From time 0 M to 3 M, a consistent decrease in the gallic acid concentration was observed for all samples, possibly linked to the formation of new polymeric forms (especially in SK4SD), precipitation or degradation reactions. The hypothetical interaction between gallic acid quinones and flavonol units has recently been reported (Mouls & Fulcrand, 2015). The concentration of polymeric phenols was also significantly higher in SKSD and SK4SD compared to SK samples (Table 2). These differences between the extracts remained over time. Over the storage time investigated (especially from 6 M), the polymeric phenol content was generally higher in Ox treatments. Therefore, the presence and reactivity of seed derived compounds and oxygen may influence polymerisation reactions.
Higher total flavonol contents were found in the Ox samples; however, the total hydroxycinnamic acid concentrations were higher in the C samples. Unexpectedly, the total hydroxycinnamic acid content seemed to slightly increase over time (Table 2), although in some cases not significantly. Literature reports a general decrease of hydroxycinnamic acid concentrations during storage (García-Falcón et al., 2007). However, an increase of certain hydroxycinnamic acids has also been observed (García-Falcón et al., 2007; Arapitsas et al., 2014), possibly as a result of copigment degradation expected to occur over time (Bimpilas et al., 2016).
Likewise, a large decrease was observed in the anthocyanin concentrations of all treatments from 0 M (Table 1) to 3 M (Table 2). The larger decrease in anthocyanin levels observed in the C treatments was not associated with the formation of higher polymeric pigments (Table 2). Nevertheless, the HPLC results confirmed the idea of certain oxidative reactions between phenols being favoured in the presence of oxygen. The oxidation of ethanol and tartaric acid could possibly have led to the formation of ethyl bridged structures between tannins moieties, thereby leading to lower reactivity of free anthocyanins. This may explain the higher concentration of monomeric anthocyanins found after 3 M, in the treatments where higher levels of seeds were present and oxygen added. Supporting this, after 3 M of storage, SK and SKSD samples showed a greater decrease in glucosylated, acetylated and coumaroylated anthocyanins in the absence of oxygen. On the other hand, SK4SD samples initially had higher concentration of polymeric pigments, thereby influencing the polymerisation reactions. These differences between the extracts in the concentrations of polymeric pigments, for both C and Ox samples, were also found at 3 M, but disappeared after 6 M of storage. In the interpretation of these results, we cannot discard the possibility that certain polymeric pigments are not detected by the RP-HPLC method. Nevertheless, after 6 M, all treatments experienced anthocyanin degradation and differences between treatments became smaller. The decrease in anthocyanins showed different rates among the different extracts. This delay may be linked to the excess of seed phenolics, with a higher reactivity in the presence of oxygen, and the exposure to several severe oxidations. These repeated oxidations could lead to over polymerisation, forming phenolic derived compounds not stable in solution, therefore precipitating. This anthocyanin degradation over time has been widely reported in red wines, and is at least partly a consequence of the formation of pigmented polymers (Somers, 1971; Somers & Evans, 1979; Pérez-Magarino & González-SanJosé, 2004; Arapitsas et al., 2014; Quaglieri et al., 2017). Also, the loss of anthocyanin derived forms over time was previously reported to be lower in oxygenated wines (Atanasova et al., 2002).
CONCLUSIONS
To date, a number of studies have focused on the impact of seed addition or removal on the colour, phenolic profile and sensory properties of wines (Meyer & Hernandez, 1970; Canals et al., 2008; Lee et al., 2008; Guaita et al., 2017), but there is a lack of information on the evolution of these wine parameters with age, as well as on the role of oxygen in this process. The main goal of this study was to assess the impact of oxygen addition on the phenolic composition of WL extracts containing three different defined A/T ratios. The extract composition seemed to play a greater role than the oxygen in phenolic evolution. Our results highlight the importance of the initial A/T ratio and of the nature of these respective compound classes on the polymerisation reactions occurring during initial stages of ageing. The higher the concentration of phenols in the solution, the greater the number of molecules susceptible to polymerise, and therefore the greater the competition between these substrates. In this context, seed derived phenols showed a high reactivity to form larger polymeric structures, both in the absence or presence of oxygen. Nevertheless, as a consequence of the oxidative process, excessive seed content may enhance the polymerisation reactions between proanthocyanidins, and thereby favour remaining of free monomeric anthocyanins in solution. The increase in polymeric phenols (Table 2), together with the higher levels of TRP (Table 1 supplementary data) and of monomeric anthocyanins (total glucosylated, acetylated and coumaroylated forms) in the SK4SD-Ox samples after 3M of storage (Table 2), support this idea.
Further research needs to investigate not only the impact of different phenolic ratios on the phenolic stability, but also the polymerisation reactions in the presence of different grape polysaccharides and protein proportions.
LITERATURE CITED
Adams, D.O., 2006. Phenolics and ripening in grape berries. Am. J. Enol. Vitic. 57, 249-256. [ Links ]
Arapitsas, P., Corte, A., Della., Gika, H., Narduzzi, L., Mattivi, F. & Theodoridis, G., 2016. Studying the effect of storage conditions on the metabolite content of red wine using HILIC LC-MS based metabolomics. Food Chem. 197, 1331-1340. [ Links ]
Arapitsas, P., Scholz, M., Vrhovsek, U., Blasi, S., Biondi, A., Masuero, D., Perenzoni, D., Rigo, A. & Mattivi, F., 2012. A Metabolomic Approach to the Study of Wine Micro- Oxygenation. PLoS ONE 7, 1-11. [ Links ]
Arapitsas, P., Speri, G., Angeli, A., Perenzoni, D. & Mattivi, F., 2014. The influence of storage on the '"chemical age"' of red wines. Metabolomics 10, 816-832. [ Links ]
Atanasova, V., Fulcrand, H., Cheynier, V. & Moutounet, M., 2002. Effect of oxygenation on polyphenol changes occurring in the course of wine-making. Analytica Chimica Acta. 458, 15-27. [ Links ]
Bimpilas, A., Panagopoulou, M., Tsimogiannis, D. & Oreopoulou, V., 2016. Anthocyanin copigmentation and color of wine : The effect of naturally obtained hydroxycinnamic acids as cofactors. Food Chem. 197, 39-46. [ Links ]
Bimpilas, A., Tsimogiannis, D., Balta-Brouma, K., Lymperopoulou, T. & Oreopoulou, V., 2015. Evolution of phenolic compounds and metal content of wine during alcoholic fermentation and storage. Food Chem. 178, 164171. [ Links ]
Bindon, K.A., Smith, P.A. & Kennedy, J.A., 2010. Interaction between Grape-Derived Proanthocyanidins and Cell Wall Material. Effect on Proanthocyanidin Composition and Molecular Mass. J. Agric. Food Chem. 58, 2520-2528. [ Links ]
Boulton, R., 2001. The copigmentation of anthocyanins and its role in the color of red wine: a critical review. Am. J. Enol. Vitic. 52, 67-87. [ Links ]
Canals, R., Llaudy, C., Miquel, J. & Fernando, C., 2008. Influence of the elimination and addition of seeds on the colour, phenolic composition and astringency of red wine. Am. J. Enol. Vitic. 226, 1183-1190. [ Links ]
Carrascón, V., Vallverdú-Queralt, A., Meudec, E., Sommerer, N., Fernandez-Zurbano, P. & Ferreira, V., 2018. The kinetics of oxygen and SO2 consumption by red wines. What do they tell about oxidation mechanisms and about changes in wine composition? Food Chem. 241, 206-214. [ Links ]
Casassa, L.F., 2017. Flavonoid Phenolics in Red Winemaking. Phenolic Compounds - Natural Sources, Importance and Applications [ Links ]
Castellari, M., Matricardi, L., Arfelli, G., Galassi, S. & Amati, A., 2000. Level of single bioactive phenolics in red wine as a function of the oxygen supplied during storage. Food Chem. 69, 61-67. [ Links ]
Cheynier, V., Salas, E., Souquet, J., Sarni-Manchado, P. & Fulcrand, H., 2006. Structure and Properties of Wine Pigments and Tannins. Am. J. Enol. Vitic. 3, 298-305. [ Links ]
Coetzee, C., Van Wyngaard, E., Suklje, K., Silva Ferreira, A.C. & Du Toit, W.J., 2016. Chemical and Sensory Study on the Evolution of Aromatic and Nonaromatic Compounds during the Progressive Oxidative Storage of a Sauvignon blanc Wine. J. Agric. Food Chem. 64, 7979-7993. [ Links ]
Dallas, C., Ricardo-da-Silva, J.M. & Laureano, O., 1996. Interactions of Oligomeric Procyanidins in Model Wine Solutions Containing Malvidin-3-Glucoside and Acetaldehyde. J. Sci. Food Agric. 70, 493-500. [ Links ]
Danilewicz, J.C., 2007. Interaction of sulfur dioxide, polyphenols, and oxygen in a wine-model system: Central role of iron and copper. Am. J. Enol. Vitic. 58, 53-60. [ Links ]
Es-Safi, N.E., Fulcrand, H., Cheynier, V. & Moutounet, M., 1999. Studies on the acetaldehyde-induced condensation of (-)-epicatechin and malvidin 3-O-glucoside in a model solution system. J. Agric. Food Chem. 47, 20962102. [ Links ]
Fulcrand, H., Cameira dos Santos, P.J., Sarni-Manchado, P., Cheynier, V. & Favre-Bonvin, J., 1996. Structure of new anthocyanin-derived wine pigments. J. Chem. Soc. 69, 60. [ Links ]
Gambuti, A., Rinaldi, A., Ugliano, M. & Moio, L., 2013. Evolution of Phenolic Compounds and Astringency during Aging of Red Wine: Effect of Oxygen Exposure before and after Bottling. J. Agric. Food Chem. 61, 1618-1627. [ Links ]
García-Falcón, M.S., Pérez-Lamela, C., Martínez-Carballo, E. & Simal-Gándara, J., 2007. Determination of phenolic compounds in wines: Influence of bottle storage of young red wines on their evolution. Food Chem. 105, 248-259. [ Links ]
Garrido-Banuelos, G., Buica, A., Schückel, J., Zietsman, A.J.J., Willats, W.G.T., Moore, J.P. & Du Toit, W.J., 2019. Investigating the relationship between grape cell wall polysaccharide composition and the extractability of phenolic compounds into Shiraz wines. Part I: Vintage and ripeness effects. Food Chem. 278, 36-46. [ Links ]
Geldenhuys, L., Oberholster, A. & Du Toit, W., 2012. Monitoring the Effect of Micro-oxygenation before Malolactic Fermentation on South African Pinotage Red Wine with Different Colour and Phenolic Analyses. SA J. Enol. Vitic. 33, 150-160. [ Links ]
González-Manzano, S., Rivas-Gonzalo, J.C. & Santos-Buelga, C., 2004. Extraction of flavan-3-ols from grape seed and skin into wine using simulated maceration. Analytica Chimica Acta. 513, 283-289. [ Links ]
González-Manzano, S., Santos-Buelga, C., Pérez-Alonso, J.J., Rivas-Gonzalo, J.C. & Escribano-Bailón, M.T., 2006. Characterization of the mean degree of polymerization of proanthocyanidins in red wines using Liquid Chromatography-Mass Spectrometry (LC-MS). J. Agric. Food Chem. 54, 4326-4332. [ Links ]
Guaita, M., Petrozziello, M., Panero, L., Tsolakis, C., Motta, S. & Bosso, A., 2017. Influence of early seeds removal on the physicochemical, polyphenolic, aromatic and sensory characteristics of red wines from Gaglioppo cv. Eur. Food Res. Technol. 243, 1311-1322. [ Links ]
He, F., Liang, N., Mu, L., Pan, Q., Wang, J., Reeves, M.J. & Duan, C., 2012a. Anthocyanins and Their Variation in Red Wines I. Monomeric Anthocyanins and Their Color Expression. Molecules. 17, 1571-1601. [ Links ]
He, F., Liang, N., Mu, L., Pan, Q., Wang, J., Reeves, M.J. & Duan, C., 2012b. Anthocyanins and Their Variation in Red Wines II. Anthocyanin Derived Pigments and Their Color Evolution. Molecules 17, 1483-1519. [ Links ]
Kennedy, J.A., Saucier, C. & Glories, Y., 2006. Grape and Wine Phenolics: History and Perspective. Am. J. Enol. Vitic. 3, 20-21. [ Links ]
Lee, J., Kennedy, J.A., Devlin, C., Redhead, M. & Rennaker, C., 2008. Effect of early seed removal during fermentation on proanthocyanidin extraction in red wine: A commercial production example. Food Chem. 107, 1270-1273. [ Links ]
Mattivi, F., Vrhovsek, U., Masuero, D. & Trainotti, D., 2009. Differences in the amount and structure of extractable skin and seed tannins amongst red grape varieties. Aust. J. Grape Wine Res. 15, 27-35. [ Links ]
McRae, J.M., Day, M.P., Bindon, K.A., Kassara, S., Schmidt, S.A., Schulkin, A., Kolouchova, R. & Smith, P.A., 2015. Effect of early oxygen exposure on red wine colour and tannins. Tetrahedron 71, 3131-3137. [ Links ]
Meyer, B.J. & Hernandez, R., 1970. Seed Tannin Extraction in Cabernet Sauvignon. Am. J. Enol. Vitic. 21, 184-188. [ Links ]
Monagas, M., Gómez-Cordovés, C. & Bartolome, B., 2006. Evolution of the phenolic content of red wines from Vitis vinifera L. during ageing in bottle. Food Chem. 95, 405-412. [ Links ]
Mouls, L. & Fulcrand, H., 2015. Identification of new oxidation markers of grape-condensed tannins by UPLC e MS analysis after chemical depolymerization. Tetrahedron 71, 3012-3019. [ Links ]
Pascual, O., González-Royo, E., Gil, M., Gómez-Alonso, S., García-Romero, E., Canals, J.M., Hermosín-Gutiérrez, I. & Zamora, F., 2016. Influence of Grape Seeds and Stems on Wine Composition and Astringency. J. Agric. Food Chem. 64, 6555-6566. [ Links ]
Pascual, O., Vignault, A., Gombau, J., Navarro, M., Gómez-Alonso, S., García-Romero, E., Canals, J.M., Hermosín-Gutiérrez, I., Teissedre, P.L. & Zamora, F., 2017. Oxygen consumption rates by different oenological tannins in a model wine solution. Food Chem. 234, 26-32. [ Links ]
Peleg, H., Gacon, K., Schlich, P. & Noble, A.C., 1999. Bitterness and astringency of flavan-3-ol monomers, dimers and trimers. J. Sci. Food and Agric. 79, 1123-1128. [ Links ]
Pérez-Magarino, S. & González-SanJosé, M.L., 2004. Evolution of flavanols, anthocyanins, and their derivatives during the aging of red wines elaborated from grapes harvested at different stages of ripening. J. Agric. Food Chem. 52, 1181-1189. [ Links ]
Peyrot Des Gachons, C. & Kennedy, J.A., 2003. Direct Method for Determining Seed and Skin Proanthocyanidin Extraction into Red Wine. J. Sci. Food Agric. 51, 5877-5881. [ Links ]
Picariello, L., Gambuti, A., Picariello, B. & Moio, L., 2017. Evolution of pigments, tannins and acetaldehyde during forced oxidation of red wine: Effect of tannins addition. LWT - Food Sci. Technol. 77, 370-375. [ Links ]
Quaglieri, C., Jourdes, M., Waffo-Teguo, P. & Teissedre, P.L., 2017. Updated knowledge about pyranoanthocyanins: Impact of oxygen on their contents, and contribution in the winemaking process to overall wine color. Trends Food Sci. Technol. 67, 139-149. [ Links ]
Ribéreau-Gayon, P., Glories, Y., Maujean, A. & Dubourdieu, D., 2006 (Vol. 2). Handbook of Enology. The chemistry of wine. Stabilization and treatments. John Wiley & Sons, LTD, [ Links ]
Sarneckis, C.J., Dambergs, R.G., Jones, P., Mercurio, M., Herderich, M.J. & Smith, RA., 2006. Quantification of condensed tannins by precipitation with methyl cellulose: Development and validation of an optimised tool for grape and wine analysis. Aust. J. Grape Wine Res. 12, 39-49. [ Links ]
Saucier, C., Bourgeois, G., Vitry, C., Roux, D. & Glories, Y., 1997. Characterization of (+)-Catechin-Acetaldehyde Polymers: A Model for Colloidal State of Wine Polyphenols. J. Agric. Food Chem. 45, 1045-1049. [ Links ]
Singleton, V.L., 1987. Oxygen with phenols and related reactions in musts, wines, and model systems: observations and practical implications. Am. J. Enol. Vitic. 38, 69-77. [ Links ]
Singleton, V.L. & Trousdale, E.K., 1992. Anthocyanin-Tannin Interactions Explaining differences in polymeric phenols between white and red wines. Am. J. Enol. Vitic. 43, 63-70. [ Links ]
Somers, T.C., 1971. The Polymeric Nature of Wine Pigments. Phytochem. 10, 2175-2186. [ Links ]
Somers, T.C. & Evans, M.E., 1974. Wine Quality: Correlations with Colour Density and Anthocyanin Equilibria in a Group of Young Red Wines. J. Agric. Food Chem. 25, 1369-1379. [ Links ]
Somers, T.C. & Evans, M.E., 1979. Grape pigment phenomena: Interpretation of major colour losses during vinification. J. Sci. Food Agric. 30, 623-633. [ Links ]
Souquet, J.M., Cheynier, V., Brossaud, F. & Moutounet, M., 1996. Polymeric proanthocyanidins from grape skins. Phytochem. 43, 509-512. [ Links ]
Sparrow, A.M., Dambergs, R.G., Bindon, K.A., Smith, P.A. & Close, D.C., 2015. Interaction of Grape Skin, Seed, and Pulp Tissues on Tannin and Anthocyanin Extraction in Pinot noir Wines. Am. J. Enol. Vitic., 1-27. [ Links ]
Springer, L.F., Chen, L.A., Stahlecker, A.C., Cousins, P. & Sacks, G.L., 2016. Relationship of Soluble Grape-Derived Proteins to Condensed Tannin Extractability during Red Wine Fermentation. J. Agric. Food Chem. 64, 8191-8199. [ Links ]
Timberlake, C.F. & Bridle, P., 1977. Anthocyanins: Colour Augmentation with Catechin and Acetaldehyde. J. Sci. Food Agric. 28, 539-544. [ Links ]
Du Toit, W.J., Marais, J., Pretorius, I.S. & Du Toit, M., 2006. Oxygen in must and wine: A review. SA J. Enol. Vitic. 27, 76-94. [ Links ]
Versari, A., Du Toit, W. & Parpinello, G.P., 2013. Oenological tannins: A review. Aust. J. Grape Wine Res. 19, 1-10. [ Links ]
Vignault, A., González-Centeno, M.R., Pascual, O., Gombau, J., Jourdes, M., Moine, V., Iturmendi, N., Canals, J.M., Zamora, F. & Teissedre, P.L., 2018. Chemical characterization, antioxidant properties and oxygen consumption rate of 36 commercial oenological tannins in a model wine solution. Food Chem. 268, 210-219. [ Links ]
Waterhouse, A.L. & Laurie, V.F., 2006. Oxidation of wine phenolics: A critical evaluation and hypotheses. Am. J. Enol. Vitic. 57, 306-313. [ Links ]
Wirth, J., Morel-Salmi, C., Souquet, J.M., Dieval, J.B., Aagaard, O., Vidal, S., Fulcrand, H. & Cheynier, V., 2010. The impact of oxygen exposure before and after bottling on the polyphenolic composition of red wines. Food Chem. 123, 107-116. [ Links ]
Yacco, R.S., Watrelot, A.A. & Kennedy, J.A., 2016. Red Wine Tannin Structure-Activity Relationships during Fermentation and Maceration. J. Agric. Food Chem. 64, 860-869. [ Links ]
Submitted for publication: February 2019
Accepted for publication: May 2019
* Corresponding author: E-mail address: abuica@sun.ac.za
# Present address: Product Design and Perception, RISE Research Institutes of Sweden - Agrifood and Bioscience, Box 5401, S-402 29, Göteborg, Sweden.
Acknowledgements: The authors would like to thank Winetech, Thrip and NRF for financial support
ARTICLES
doi:https://doi.org/10.21548/42-2-3224
Hydric behaviour and gas exchange in different grapevine varieties (Vitis vinifera L.) from the Maule Valley (Chile)
G. Gutiérrez-GamboaI; A.G. Pérez-DonosoII; A. Pou-MirIII; C. Acevedo-OpazoIV; H. Valdés-GómeII, *
IUniversidad de Talca, Facultad de Ciências Agrárias, Centro Tecnológico de la Vid y del Vino (CTW), Av. Lircay S/N, Talca, Chile
IIPontifícia Universidad Católica de Chile, Departamento de Fruticultura y Enología, Vicuna Mackena 4860, Santiago, Chile
IIIInstituto de Ciências de la Vid y del Vino (CSIC, Gobierno de La Rioja, Universidad de La Rioja). Carretera de Burgos, Km. 6. 26007 Logrorio, Spain
IVUniversidad de Talca, Facultad de Ciências Agrárias, CITRA, 2 Norte, 685 Talca, Chile
ABSTRACT
In the near future, stomatal behaviour will be crucial to counteract conditions arising from climate change. Grapevine varieties are classified as either isohydric or anisohydric, depending on the sensitivity of sto-mata to water deficit and on their water potential homeostasis. However, the great variability observed in different studies indicates that a continuum exists in the range of stomatal sensitivity to water stress. Thus, more knowledge about the hydric behaviour and the gas exchange of isohydric and anisohydric grapevine varieties under different water conditions could lead to the development of irrigation strategies oriented at improving water-use efficiency, yield and berry composition. In this study, research was conducted in order to characterise the stomatal regulation of four different Vitis vinifera L. varieties, namely Pinot noir, Sauvignon blanc, Chardonnay and Merlot, according to soil water status. Measurements of leaf gas exchange, together with measurements of stem water potential (Ψ$) and leaf water potential (Ψ1), were taken during two seasons. Under conditions of water stress, Chardonnay and Merlot reached a minimum Ψ$ of -1.67 and -1.68 MPa respectively, and higher levels of water-use efficiency (AN/g), of 62.3 and 69.7 μmol C02/mol H20 respectively. In Sauvignon blanc and Pinot noir, the minimum Ψ$ was -1.26 and -1.40 MPa respectively, with lower levels of AN/gs (53.1 and 50.5 μmol C02/mol H20, respectively). Under conditions of water stress (Ψ1 < -0.9 MPa and *Fs < -0.6 MPa), all varieties had a significantly increased A^g1, despite a significant reduction in gas exchange. Therefore, the hydric behaviour and gas exchange observed in this study suggest that Chardonnay and Merlot could be characterised as anisohydric varieties, as they present less sensitive stomatal control, while Pinot noir can be classified as a near-anisohydric variety and Sauvignon blanc as an isohydric variety. New investigations should consider other characteristics of the varieties to classify them better.
Keywords: Anisohydric, intrinsic water-use efficiency, isohydric, leaf water potential, stem water potential
INTRODUCTION
Recently, viticultural management has experienced a series of modifications due to the increase in temperatures, which has had direct effects on grapevine ripening and, consequently, on berry and wine quality (Van Leeuwen & Darriet, 2016). The effects of climate change on winemaking can vary according to the style of wine produced and by geographical location, with milder effects expected for coastal regions (Jones et ah, 2005; Duchêne et ah, 2010; Verdugo-Vásquez et ah, 2019). Model outputs have predicted an average warming of 2°C in the next 50 years for global wine-producing regions (Jones et ah, 2005). Advances from eight to 11 days for budburst and from 16 to 24 days for véraison have been predicted for the end of the 21st century for white grapevine varieties cultivated in Alsace (Duchêne et ah, 2010). A decrease in the length of each phenological stage in grapevines may yield a precocity towards the end of the 21st century of 40 days earlier than the current timeframe (Ollat & Touzard, 2014; Sgubin et ah, 2018). Thus, grapevines have undergone modifications in their physiological behaviour that have affected vegetative growth (Gomez del Campo et ah, 2002; Lebon et ah, 2006), berry development (McCarthy, 2000; Ojeda et ah, 2001), and the maturity and organoleptic composition of the grape berry at harvest (Koundouras et ah, 1999; Ojeda et ah, 2002). Thus, the observed climatic effects would be modifying both the spectrum and the distribution of the currently used grapevine varieties (Popescu et ah, 2009), and would imply the implementation of adequate measures to reduce the negative effects through adjustments and changes in agricultural systems.
Soil water deficit and vapour-pressure deficit (VPD) are the most important environmental factors affecting stomatal closure in the Mediterranean area (Klein, 2014). Pou et al. (2008) reported that stomatal conductance (gs) and the rate of transpiration (E) were strongly affected by VPD in a manner that is dependent on irrigation treatment. Depending on the stomatal control strategy followed in response to water deficit, grapevine varieties can behave as isohydric or anisohydric plants (West et al., 2012). In isohydric varieties, gs responds to a greater extent to the changes in VPD. This high stomatal sensitivity of isohydric plants is usually associated with higher levels of abscisic acid in the xylem sap, and with hydraulic responses (Tardieu & Simonneau, 1998; Soaref al., 2006). In contrast, anisohydric grapevines have less control over Ψ1, and the magnitude of Ψ1 decreases as VPD increases, reaching much lower values of Ψ1 in stressed vines than in grapevines growing under favourable water conditions. In this case, stomatal closure in these grapevines is associated with root signals or with the anatomical architecture related to stress conditions (Tardieu & Simonneau, 1998; Collins et al., 2010; Rogiers et al., 2011; Gerzon et al., 2015). Anisohydric grapevines present a substantial depression of their Ψ during drought, also showing some degree of tolerance to water stress (Bucci etal, 2005; Pou et al., 2012). Pou et al. (2012) reported that anisohydric behaviour results in better performance under moderate water stress and recovery than isohydric-behaved grapevines (Bucci et al., 2005; Pou et al., 2012).
A better knowledge of the hydric behaviour and gas exchange of isohydric and anisohydric grapevine varieties managed under different water conditions could lead to the development of irrigation strategies oriented to improving water productivity, yield and berry composition under the current effects of climate change. Therefore, the aim of this work was to characterise the vine water potential and gas exchange in four grapevines varieties (isohydric and anisohydric) managed under different water conditions in the Maule Valley, Chile over two consecutive seasons.
MATERIALS AND METHODS
Experimental site and plant material
The field trial was conducted in an experimental vineyard (cv. Chardonnay, Merlot, Pinot noir and Sauvignon blanc) belonging to the Vine and Wine Technological Centre of Talca University during the 2011/2012 and 2012/2013 seasons. The vineyard is located in Panguilemo, Talca, Maule Valley, Chile (35°22.2' south 71°35.39' west, and 121 metres above sea level). The ungrafted grapevines were planted in 2006, trained to a vertical shoot position trellis system and were pruned into two bilateral spur cordons. Planting density was about 5 000 vines ha1, with grapevine spacing between rows and within the row of 2.00 m χ 1.00 m and an east-west orientation. The soil texture was clay loam with a rooting depth of 150 cm, and the soil is classified as part of the Talca series (Thermic Ultic Haploxeralf). Bulk density, field capacity, wilting point and available water along the soil were 1.36 g cm3, 0.31 m3 m3, 0.13 m3 m3and 0.18 m3 m3 respectively. More information concerning soil and crop management carried out in the experimental field are available in Panitrur-De la Fuente et al. (2018).
Information about weather conditions was recorded by an automatic weather station installed 50 m from the trial plot. Maximum and minimum temperature in the 2011/2012 grapevine growth season (from September to April) was 34.6°C and 0.0°C respectively, while in the 2012/2013 season it was 34.5°C and 0.9°C respectively. Average temperature in the season was 16.9°C and 16.7°C for the 2011/2012 and 2012/2013 seasons respectively. The rainfall registered for the phenological cycle in the 2011/2012 season reached 31.8 mm, and was concentrated in the spring months. The rainfall registered for the 2012/2013 season reached 152.4 mm, was concentrated in November, and there was occasional rain throughout the summer, unlike the 2011/2012 season, when there was no precipitations during the summer. The reference evapotranspiration (ET) was estimated using the Penman-Monteith equation (Ahumada-Orellana et al., 2018). ET calculated for the 2011/2012 season was 1 037 mm, and for the 2012/2013 season it was 939 mm. In the 2011/2012 season, 1 438 chilling hours were accumulated, while in the 2012/2013 season 1 243 chilling hours were accumulated. During the 2011/2012 season, the accumulation of degree days was 1 375°C, while the accumulation of degree days during the 2012/2013 season was 1 311°C. Mean VPD during the experiment in the 2011/2012 season was 1.05 kPa, while in the 2012/2013 season it was 0.95 kPa. Additional information is presented in Figs 1 to 4 of the supplementary material.
Experimental design
The experimental design was a randomised complete block divided into two plots (treatments), in which the four Vitts vinifera L. varieties under study were arranged: Chardonnay, Merlot, Pinot noir and Sauvignon blanc. During the first season, one of the two blocks was managed under optimal water conditions (without irrigation restriction), while the other was managed with progressive water restrictions until reaching severe water deficit in the vines (leaf water potential < -1.4 MPa) (Van Leeuwen et al. (2009). During the second season, differential irrigation management was not carried out as in the first season; instead, all the plants were irrigated with the same water load. Despite this, plants presented differences in their water status in the second experimental year, thus presenting a wide range of water stress within the experiment. A total of eight treatments (variety χ water condition) were arranged in the vineyard, with five plants per treatment. The selected grapevines presented good phytosanitary conditions and were homogeneous in vegetative growth and productivity.
Gas exchange measurement
An infrared gas analyser, model LI 6400 (Li-cor, Lincoln, Nevada, USA), was used to measure stomatal conductance (gs), transpiration (E) and net C02 assimilation (AN). In addition, the intrinsic water-use efficiency (AN gs_1) was calculated as the ratio between AN and gs according to Medrano etal. (2014). The gas exchange measurements were carried out in the middle zone (6th leaf from the tip on fruit-bearing shoots) on the northern side of the canopy between 12:00 and 14:00 in five different plants per treatment on fully sunny days. The original position of the selected leaves in the canopy was not changed and the same light regime was maintained, thus ensuring that the leaves were exposed to full sunlight (PAR > 800 μmol m2 sec1). Measurements were taken every 15 days between December (one month before véraison) and April (near harvest) in each growing season.
Plant water status
Stem water potential (Ψβ) and leaf water potential (Ψ1) were measured using a pressure chamber (PMS Instrument Co., model 600, Corvallis, Oregon, USA) according to the protocol stated by Acevedo-Opazo et al. (2013) and Jara-Rojas et al. (2015). Briefly, five fully expanded and sun-exposed leaves per treatment were wrapped in plastic transparent film and aluminium foil for at least 2 h, thus achieving an equilibrium between leaf and plant xylem. Ψ1 measurement were performed on uncovered leaves at the same time that and gas exchange measurements were taken (between 12:00 and 14:00). To define the level of water stress in this study, data were divided into five ranges according to the thresholds proposed by van Leeuwen et al. (2009): i) no water deficit (Ψ1 > -0.9 MPa; > -0.6 MPa); ii) mild water deficit (-0.9 < Ψ1 < -1.1 MPa; -0.6 < < -0.9 MPa; iii) moderate to mild water deficit (-1.1 < Ψ1 < -1.3 MPa; -0.9 < < -1.1 MPa; iv) moderate to severe water deficit (-1.3 < Ψ1< -1.4 MPa; -1.1 < < -1.4 MPa; v) severe water deficit (Ψ1 and < -1.4 MPa).
Statistical analysis
The statistical analysis in relation to the parameters analysed was performed by ANOVA, using Centurion XVI.I (Statgraphics Technologies; The Plains, Virginia, USA). Differences between treatments were compared using the Duncan test at the 95% confidence level. Non-linear regressions between gs and Ψ1, gs and Ψβ, AN and gs, Ε and gs, Ε and Ψβ, and \ gs' and gs were developed for different levels of vine water status by each grapevine variety. The coefficient of determination (r2) was used to evaluate how well the regression line represents the data. The relationship between net C02 assimilation (A^) and stomatal conductance (gs) in each variety was contrasted with that in the literature in order to compare how these varieties behave under different experimental conditions.
RESULTS AND DISCUSSION
Relationship between stomatal conductance and plant water status
To evaluate genotypic sensitivity to water deficit, the stomatal conductance (gs) was compared with the leaf water potential (Ψ1) and stem water potential (Ψβ) (Figs 1 and 2 respectively) in the 2011/2012 and 2012/2013 seasons. For similar values of Ψ1 and Ψβ, all varieties except Sauvignon blanc presented higher maximum values of gs during the first season (2011/2012) than during the second season (2012/2013) (Figs 1 and 2), as well as lower minimum gs values (Figs 1 and 2). During the 2011/2012 season, minimum gs values for Chardonnay, Merlot, Pinot noir and Sauvignon blanc were 0.02, 0.01, 0.05 and 0.03 mol H20 nr2 s1 respectively, whereas they were 0.05, 0.05, 0.11 and 0.08 mol H20 nr2 s"1 respectively in the 2012/2013 season. This higher sensitivity of the stomatal response to water deficit during the former season is probably related to the higher vapour-pressure deficit (VPD) experienced at the time of the measurements, reaching 1.05 kPa, compared to the 0.95 kPa reached during the second season. Prieto et al. (2010) reported that Syrah, Marselan, Mouvèdre and Ekigaïna grapevine varieties presented higher stomatal regulation in response to increased ambient VPD. Moreover, even under mild to moderate water stress (-0.9 < Ψ1 < -1.3 MPa), the variability of gs values was also higher in 2011/2012 than in 2012/2013 (Fig 1). Generally, when Ψ1 was used as an indicator of water status, higher gs magnitudes and more variability were observed at lower water potentials than when was used. Although Ψ1 varies according to vine water status, it is also dependent on the microclimatic environment of the leaf; due to this, midday Ψ1 probably is not a very accurate indicator of vine water status (Van Leeuwen et al., 2007). Moreover, a clear separation in gs magnitudes between stressed and non-stressed grapevines was only found when water status was characterised as (Fig. 2). The variability in gs decreased in most of the grapevine varieties in the 2012/2013 season, especially for values lower than -0.9 MPa (moderate water deficit) (Fig. 2).
Regarding gs sensitivity, Chardonnay and Merlot reached maximum g values of 0.45 mol HO m2 s1, and minimum g values of 0.02 mol HO m2 s1 and 0.01 mol H20 nr2 s1 respectively, while Pinot noir and Sauvignon blanc reached maximum g values of 0.63 mol HO m2 s1. and minimum g values of 0.05 mol HO m2 s1 and 0.03 mol
H20 m2 s1 respectively. Stomatal conductance is not only related to the availability of soil water and VPD, but also the interactions of internal and external leaf factors, such as hydraulic adjustment, root signals or anatomical architecture (Collins et al., 2010; Pou et al., 2012; Gerzon et al., 2015). Indeed, it has been shown that differences in the abscisic acid concentration [ABA] in the xylem sap may explain the more sensitive reaction to water deficit in isohydric grapevine varieties compared to anisohydric varieties (Chaves et al., 2016). ABA could be involved in the closure of aquaporins in bundle sheath cells, decreasing the water flow to the mesophyll cells and strengthening the implications of a hydraulic component in stomata closure (Chaves et al., 2016). Thus, according to the results presented in Figs 1 and 2, this might be the case in Sauvignon blanc, since there is rapid stomatal closure as the water content in the soil decreases. In this way, the leaf water status interacts strongly with gas exchange and, consequently, there is a well-defined correlation between Ψ1 and gs (Prieto et al., 2010).
The Merlot, Pinot noir and Chardonnay grapevines progressively decreased their gs as stem water potential (Ψβ) became more negative due to high VPD and conditions of water stress. These varieties maintained moderately high gs levels under mild water deficit conditions (-0.9 MPa < < -0.6 MPa), as defined by Van Leeuwen et al. (2009). However, gs progressively declined with mild to moderate water stress (Ψβ < -0.6 MPa), and remained constant at a gs value close to 0.1 mol H20 m2 s1. This physiological behaviour is common in species described as having anisohydric responses to soil water deficit (Pou et ah, 2012). Thus, compared to isohydric behaviour, anisohydric behaviour involves the consumption of soil water resources by roots until lower water potentials are achieved (Chaves et ah, 2016). Merlot and Chardonnay presented lower values than Pinot noir and Sauvignon blanc (Fig. 2). In contrast, Sauvignon blanc grapevines managed under conditions of no water deficit (Ψε > -0.6 MPa). They presented high gs values (> 0.4 mol H20 m2 s1) and, after this point, the values dropped drastically (0.25 < mol H20 m2 s1) during the first season, leading to decreased transpiration and, consequently, decreased diffusion of C02 into the plant. During the second season, Pinot noir and Sauvignon blanc decreased their gs down to 0.2 mol H20 m2 s1 at values of -0.3 MPa (no water stress) (Fig. 2), thus avoiding a drastic fall in Ψβ. Pinor noir showed different hydric behaviour in the two experimental seasons. As a consequence, this variety was described as displaying anisohydric behaviour in the first season and isohydric behaviour in the second.
Relationship between net C02 assimilation and stomatal conductance
A typical exponential relationship for net C02 assimilation (AN) and stomatal conductance (gs) was found on the basis of the data measured during the field trial. Our data are located around the curve proposed by Medrano et al. (2002), which is considered representative for most grapevine varieties (Fig. 3). Moreover, different relationships between A^ and gs for each variety were obtained in both experimental years (Fig. 4).
The obtained \ data was homogeneously distributed throughout the gs data spectra for the Chardonnay, Pinot noir and Merlot grapevines (Fig. 4). Thus, as the gs increased, there was greater AN. In contrast, there were no \ values in Sauvignon blanc when the gs values were between 0.25 and 0.4 mol H20 m2 s1. At one extreme, when well-watered conditions were applied, this variety assimilated C02 at a high rate. However, under water-stressed conditions, gs fell considerably in comparison to the rest of the grapevine varieties, probably due its strong stomatal regulation, leading to a fast decrease in AN. This protective physiological response might have costs in terms of lower C02 assimilation rates during water stress, leading to a reduction of growth, and under severe abiotic stress this could reach a critical threshold for leaf damage (Chaves et al, 2010, 2016; Pou et al, 2012). One the other hand, Pinot noir grapevines growing under severe water-stress conditions did not completely close their stomata, maintaining a higher C02 assimilation rate than the other studied varieties. This could imply that, in this variety, lower gs magnitudes could be less limiting for C02 assimilation than for the transpiration rate compared to other varieties. Additionally, under well-watered conditions, this grapevine variety presented the highest maximum AN value compared with the rest of the studied varieties (Fig. 4), suggesting near-anisohydric behaviour in this case. Accordingly, Chaves et al. (2016) report that anisohydric varieties present cooler leaves and higher photosynthetic rates than isohydric ones. However, anisohydric grapevines may suffer accelerated dehydration under severe drought stress due to their high transpiration rates, which are not compensated by soil water uptake (Chaves et al., 2016). With respect to stomatal control strategy, certain authors have reported that Pinot noir behaved as an anisohydric variety when water stress was applied at the pre-véraison stage and as an isohydric variety when it was applied at the post-véraison stage (Poni et al.. 1993;Lovisoloefa/.,2010).
Transpiration according to stomatal conductance and plant water status
Grapevines close their stomata under conditions of water stress, leading to a decrease in transpiration (E). Therefore, gs has a great influence on Ε (Fig. 5). Correlation coefficients (r2) between Ε and gs were higher than 0.83 for the 2011/2012 season (data not shown). However, the obtained r2 in the 2012/2013 season were only significant for Chardonnay (r2 = 0.71). This was probably because the treatments performed during the second season did not generate a severe water deficit, which mean there were no extreme values.
The 2011/2012 season was warmer than the 2012/2013 season and presented a higher reference evapotranspiration (ETo) and vapour-pressure deficit (VPD). This had a direct effect on Ε and stomatal conductance (gs) rates, which were greater in the 2011/2012 season, favouring more negative water potentials.
Ε declined as became more negative. Similar Ε magnitudes close to 12 mmol H20 m2 s1 were observed in Chardonnay, Merlot and Sauvignon blanc grapevines for the 2011/2012 season (Fig. 6). Pinot noir grapevines reached maximum Ε values of slightly below the others. Chardonnay grapevines presented a progressive drop in Ε from 10.3 to 1.1 mmol H20 m2 s1, and values lower than -0.2 MPa (non-stressed vines). This behaviour was similar to that found in Merlot, Pinot noir and Sauvignon blanc grapevines, which presented a progressive fall in Ε as became more negative. In Chardonnay and Merlot, levels of below -1.6 MPa (severe water stress) gave rise to minimum Ε (< 1.1 mmol H20 m2 s1). However, the minimum value of Ε (1.45 mmol H20 m2 s1) in Sauvignon blanc was reached at -1.1 MPa, defined as moderate to severe water stress by Van Leeuwen et al. (2009). In addition, high levels of Ε were reached under non-stress conditions in Sauvignon blanc grapevines, and subsequently Ε fell drastically to Ψε values lower than -0.6 MPa, with an average value of 3.1 mmol H20 m2 s1. Moreover, stressed Pinot noir grapevines presented higher levels of Ε at very negative (-1.4 MPa) than those obtained in Sauvignon blanc, Chardonnay and Merlot. In Pinot noir, Ε fluctuated slightly at values lower than -0.9 MPa, ranging from 4.8 to 2.3 mmol H20 m2 s1, with a minimum value of 2.33 mmol H20 m2 s1 at -1.2 MPa. Then, under moderate to severe water-stress conditions, Ε fluctuated between 1.45 and 2.26 mmol H20 m2 s1. Therefore, Ε followed the same behaviour as g and contributed to the explanation of the isohydric (Sauvignon blanc) or anisohydric (Merlot and Chardonnay) behaviour of the varieties.
Intrinsic water-use efficiency
Merlot and Chardonnay grapevines showed higher levels of ANgs-1 than Pinot noir, mainly due to the low levels of gs obtained; therefore, it is likely that these varieties partially owe their higher efficiency in the use of water to the fact that their stomata were not completely open (Table 1). Sauvignon blanc and Pinot noir reached a lower \ gjlthan Merlot, together with high levels of gs, which could affect their productive potential under conditions of unfavourable water availability. Based on the literature, isohydric varieties under high evaporative demand have been considered as experiencing a more pronounced increase in \ gs-', thus being better adapted to drought stress than anisohydric varieties (Schultz 2003; Vandeleur et al., 2009). However, other reports in the literature show that the same variety could behave as iso- or anisohydric, depending on the experimental conditions (Chaves et al., 2010; Lovisolo et al., 2010). Moreover, Pou et al. (2012) showed that Chardonnay (considered an anisohydric variety) displayed higher water-use efficiency at the leaf level than two other isohydric varieties.
ANgs-1 is independent of atmospheric conditions, since it measures the ability of the leaf to regulate photosynthesis and gs (Medrano et al., 2007). Fig. 7 shows the different values of gs measured during the first and second experimental seasons and their respective estimated water-use efficiency (WUE) values. Based on our results for gs values between 0.70 and 0.14 mol H20 m2 s1 (slight stress) with adequate water availability, \ gs' gradually increased as the water status of the grapevines decreased. Under these conditions, AN decreased slightly and stomatal closure limited photosynthesis. Thereafter, as gs decreased from 0.14 mol H20 m2 s1 to 0.05 mol H20 m2 s1 (moderate water stress), \ decreased and AN gs-1 increased significantly. Under these conditions, stomatal limitations dominated and photosynthesis was reversible. Finally, at gs levels lower than 0.05 molH20 m2 s1 (severe water stress). \ gs' decreased drastically again, as has been reported by Cifre et al. (2005). Therefore, grapevines become less efficient in the use of water when there is severe water stress represented by low gs levels (Fig. 7). The depicted results displayed under moderate water stress differ from those reported by Douthe et al. (2018) when measuring WUE at the whole-plant scale. These authors showed that carbon and water fluxes were drastically reduced, while estimated WUE was not improved but decreased. So, in this case, scaling up WUE readings from leaves to the whole plant leads to some discrepancies among single-leaf and whole-canopy results. However, the results reported by these authors are in agreement with those shown in Fig. 7 for grapevines growing under severe water stress. Grapevine leaves from all locations in the canopy except those located in the central part, showed a similar radiation-use efficiency, suggesting that light interception considerably affects variations in photosynthesis within the grapevine canopy (Escalona et al., 2003). Thus, it is possible that, under severe water stress, variations between leaves within the canopy disappear and any single leaf may reflect what is happening at the whole-plant level. Additionally other factors, such as nocturnal water loss, changes in dry matter, partitioning among the sinks, or harvest load respiration rates, could also explain the lack of correlation usually reported between instantaneous WUE and intrinsic water-use efficiency (WUEi) (Douthe et al., 2018).
CONCLUSIONS
Chardonnay and Merlot decreased their leaf and stem water potential in accordance with the applied water stress and reached high levels of intrinsic water-use efficiency (WUEi) (ANg;1)(62.25and69.74μmol C02molΗ20' respectively). Thereby, Chardonnay and Merlot could be characterised in this trial as anisohydric varieties. In contrast, Sauvignon blanc drastically decreased gs (0.67 to 0.03 mol H20 m2 s1) and Ε (11.7 to 1.45 mmol H20 m2 s1) under conditions of water stress, leading to a strong decrease in \ (2.53 μmol C02 m2 s1), thus displaying isohydric behaviour. In Pinot noir, gs dropped (0.63 to 0.05 mol H20 m2 s1) in relation to the water deficit, and Ψ1 changed in association with the irrigation treatments, probably due to the availability of water in the soil. However, under stress conditions, gs' was lower in this variety (50.51 μmol C02 mol H20-1)-Accordingly, this variety could be characterised as either an isohydric or anisohydric variety. Consequently, these results suggest that Pinot noir may be considered as a near-anisohydric variety. In general, physiological responses of the varieties are directly related to the climate and water content in the soil and may vary from one area to another. For this reason, other physiological parameters could be measured to characterise more accurately the isohydric or anisohydric behaviour of the varieties of this study.
LITERATURE CITED
Acevedo-Opazo, C, Valdés-Gómez, Η., Taylor, J.A., Avalo, Α., Verdugo-Vásquez, Ν., Araya, Μ., Jara-Rojas, F. & Tisseyre, Β., 2013. Assessment of an empirical spatial prediction model of vine water status for irrigation management in a grapevine field. Agric. Water Manag. 124, 58-68. [ Links ]
Ahumada-Orellana, L.E., Ortega-Farias, S. & Searles, P.S., 2018. Olive oil quality response to irrigation cut-off strategies in a super-high density orchard. Agric. Water Manag. 202, 81-88. [ Links ]
Bucci, S.J., Goldstein, G., Meinzer, F.C., Franco, A.C., Campanello, P. & Scholz, F.G., 2005. Mechanisms contributing to seasonal homeostasis of minimum leaf water potential and predawn disequilibrium between soil and plant water potential in neotropical savanna trees. Trees Struct. Funct. 19. 296-304. [ Links ]
Chaves, M.M., Costa, J.M., Zarrouk, O., Pinheiro, C, Lopes, CM. & Pereira, J.S., 2016. Controlling stomatal aperture in semi-arid regions - The dilemma of saving water or being cool? Plant Sei. 251, 54-64. [ Links ]
Chaves, Μ.Μ., Zarrouk, Ο., Francisco, R., Costa, J.M., Santos, T.. Regalado, A.R, Rodrigues, M.L. & Lopes, CM., 2010. Grapevine under deficit irrigation: Hints from physiological and molecular data. Ann. Bot. 105(5), 661-676. [ Links ]
Cifre, J., Bota, J., Escalona, J., Medrano, H. & Flexas, J., 2005. Physiological tools for irrigation scheduling in grapevine (Vitts vinifera L.). An open gate to improve water-use efficiency? Agric. Ecosyst. Environ. 106, 159-170. [ Links ]
Collins, M.J., Fuentes, S. & Barlow, E.W.R., 2010. Partial rootzone drying and deficit irrigation increase stomatal sensitivity to vapour pressure deficit in anisohydric grapevines. Funct. Plant Biol. 37(2), 128-138. [ Links ]
Douthe, C, Medrano, H., Tortosa, 1., Escalona, J.M., Hernández-Montes, Ε. & Pou, Α., 2018. Whole-plant water use in field grown grapevine: Seasonal and environmental effects on water and carbon balance. Front. Plant Sei. 9, 1540. [ Links ]
Duchêne, Ε., Huard, F., Dumas, V, Schneider, C. & Merdinoglu, D., 2010. The challenge of adapting grapevine varieties to climate change. Clim. Res. 41, 193-204. [ Links ]
Escalona, J.M., Flexas, J., Bota, J. & Medrano, I., 2003. Distribution of leaf photosynthesis and transpiration within grapevine canopies under different drought conditions. Vitis 42(2), 57-64. [ Links ]
Gerzon, E., Biton, I., Yaniv, Y., Zemach, H., Netzer, Y, Schwartz, Α., Fait. A. & Ben-Ari, G., 2015. Grapevine anatomy as a possible determinant of isohydric or anisohydric behavior. Am. J. Enol. Vitic. 66(3), 340-347. [ Links ]
Gomez del Campo, Μ., Ruiz, C. & Lissaguirre, J.R., 2002. Effect of water stress on leaf area development, photosynthesis and productivity in Chardonnay and Airen grapevines. Am. J. Enol. Vitic. 53, 138-143 [ Links ]
Jara-Rojas, F., Ortega-Farias, S., Valdéz-Gómez, Η. & Acevedo-Opazo. C, 2015. Gas exchange relations of ungrafted grapevines (cv. Carménère) growing under irrigated field conditions. S. Afr. J. Enol. Vitic. 36, 231-242. [ Links ]
Jones, G.V., White, M.A., Cooper, O.R. & Storchmann, Κ., 2005. Climate change and global wine quality. Clim. Change 73(3), 319-343. [ Links ]
Klein, T., 2014. The variability of stomatal sensitivity to leaf water potential across tree species indicates a continuum between isohydric and anisohydric behaviours. Funct. Ecol. 28(6), 1313-1320. [ Links ]
Koundouras, S., Van Leeuwen, C, Seguin, G. & Gloires, Y, 1999. Influence de l'alimentation en eau sur la croissance de la vigne, la maturation des raisins et les caractéristiques des vins en zone méditerranéenne (Exemple de Némée, Grèce, cépage Saint Georges, 1997). J. Int. Sei. Vigne Vin 33, 149-160. [ Links ]
Lebon, E., Pellegrino, Α., Louarn, G. & Lecoeur, J., 2006. Branch development controls leaf area dynamics in grapevine (Vitis viniferá) growing in drying soil. Ann. Bot. 98, 175-185. [ Links ]
Lovisolo, C, Perrone, I., Carra, Α., Ferrandino, Α., Flexas, J., Medrano, H. & Schubert, Α., 2010. Drought-induced changes in development and function of grapevine (Vitis spp.) organs and in their hydraulic and non-hydraulic interactions at the whole-plant level: A physiological and molecular update. Funct. Plant Biol. 37(2), 98-116. [ Links ]
McCarthy, M., 2000. Developmental variation in sensitivity of Vitis vinifera L. (Shiraz) berries to soil water deficit. Aust. J. Grape Wine Res. 6, 136-140. [ Links ]
Medrano, H., Bota, J., Cifre, J., Flexas, J., Ribas-Carbó, Μ. & Gulías. J., 2007. Eficiência del uso del agua por las plantas. Grupo de Biologia de plantas en condiciones mediterrâneas. Departamento de Biologia. Universität de les Illes Balears- IMEDEA. Investigaciones Geográficas 43. 63-84. [ Links ]
Medrano, H., Escalona, J., Bota, J., Gulías, J. & Flexas, J., 2002. Regulation of photosynthesis of C-3 plants in response to progressive drought: Stomatal conductance as a reference parameter. Ann. Bot. 89(7), 895-905. [ Links ]
Medrano, H., Tomás, Μ., Martorell, S., Escalona, J.-M., Pou, Α., Fuentes. S., Flexas, J. & Bota, J., 2014. Improving water use efficiency of vineyards in semi-arid regions. Areview. Agron. Sustain. Dev. 35(2), 499-517. [ Links ]
Ojeda, H., Andary, C, Kraeva, E., Carbonneau, A. & Deloire, Α.. 2002. Influence of pre- and postveraison water deficit on synthesis and concentration of skin phenolic compounds during berry growth of Vitis vinifera cv. Shiraz. Am. J. Enol. Vitic. 53, 261-267. [ Links ]
Ojeda, H., Deloire, A. & Carbonneau, Α., 2001. Influence of water stress deficits on grape berry growth. Vitis 40, 141-145. [ Links ]
Ollat, N. & Touzard, J.-M., 2014. Long-term adaptation to climate change in viticulture and enology: The LACCAVE project. Special Laccave. J. Int. Sei. Vigne Vin 1-7. [ Links ]
Panitrur-De la Fuente, C, Valdés-Gómez, Η., Roudet, J., Acevedo-Opazo. C, Verdugo-Vásquez, Ν, Araya-Alman, Μ., Lolas, Μ., Moreno, Y. & Fermaud, M., 2018. Classification of wine grape cultivars in Chile and France according to their susceptibility to Botrytis cinerea related to fruit maturity. Aust. J. Grape Wine Res. 24, 145-157. [ Links ]
Poni, S., Lakso, A.N., Turner, J.R. & Melious, R.E., 1993. The effects of pre- and post-veraison water stress on growth and physiology of potted Pinot noir grapevines at varying crop levels. Vitis 32, 207-214. [ Links ]
Popescu, Α., Enache, V, Simion, C, Donici, A. & Tabaranu, G., 2009. Research concerning the economic impact of climate change upon grape production. Bulletin UASVM 66, 366-372. [ Links ]
Pou, Α., Flexas, J., Alsina, M. del M., Bota, J., Carambula, C, De Herralde. F., Galmés, J., Lovisolo, C, Jimenez, M., Ribas-Carbó, Μ., Rusjan, D.. Secchi, F., Tomás, Μ., Zsófi, Ζ. & Medrano, Η., 2008. Adjustments of water use efficiency by stomatal regulation during drought and recovery in the drought-adapted Vitis hybrid Richter-110 (V. berlandieri χ V. rupestris). Physiol. Plant 134(2), 313-323. [ Links ]
Pou, Α., Medrano, 1., Tomás, Μ., Martorell, S., Ribas-Carbó, Μ. & Flexas. J., 2012. Anisohydric behaviour in grapevines results in better performance under moderate water stress and recovery than isohydric behaviour. Plant Soil 359, 335-349. [ Links ]
Prieto, J.A., Lebon, E. & Ojeda, H., 2010. Stomatal behavior of different grapevine cultivars in response to soil water status and air water vapor pressure deficit. J. Int. Sei. Vigne Vin. 44, 9-20. [ Links ]
Rogiers, S., Greer, D.H., Hutton, R.J., Clarke, S.J. (2011) Transpiration efficiency of the grapevine cv. Semillon is tied to VPD in warm climates. AnnAppl Biol 158:106-114. doi:10.1111/j.l744-7348.2010.00446.x [ Links ]
Schultz, Η., 2003. Differences in hydraulic architecture account for near-isohydric and anisohydric behaviour of two field grown Vitis vinifera L. cultivars during drought. Plant Cell Environ. 26, 1393-1405. [ Links ]
Sgubin, G., Swingedouw, D., Dayon, G., Garcia de Cortázar-Atauri, I.. Ollat, N, Page, C. & Van Leeuwen, C, 2018. The risk of tardive frost damage in French vineyards in a changing climate. Agric. For. Meteorol. 250-251, 226-242. [ Links ]
Soar, C.J., Speirs, J., Maffel, S.M., Penrose, A.B., McCarthy, M.G. & Loveys, B.R., 2006. Grape vine varieties Shiraz and Grenache differ in their stomatal response to VPD: Apparent links with ABA physiology and gene expression in leaf tissue. Aust. J. Grape Wine Res. 12, 2-12. [ Links ]
Tardieu, F. & Simonneau, T, 1998. Variability among species of stomatal control under fluctuating soil water status and evaporative demand: Modelling isohydric and anisohydric behaviours. J. Exp. Bot. 49, 419-432. [ Links ]
Vandeleur, R.K., Mayo, G., Shelden, M.C., Gilliham, M., Kaiser, B.N. & Tyerman, S.D., 2008. The role of plasma membrane intrinsic protein aquaporins in water transport through roots: Diurnal and drought stress responses reveal different strategies between isohydric and anisohydric cultivars of grapevine. Plant Physiol. 149(1), 445-460. [ Links ]
Van Leeuwen, C. & Darriet, P., 2016. The impact of climate change on viticulture and wine quality. J. Wine Econ. 11, 150-167. [ Links ]
Van Leeuwen, C, Tregoat, O., Choné, X., Bois, Β., Pemet, D. & Gaudillère. J.P, 2009. Vine water status is a key factor in grape ripening and vintage quality for red Bordeaux wine. How can it be assessed for vineyard management purposes? J. Int. Sei. Vigne Vin. 43, 121-134. [ Links ]
Van Leeuwen, C, Trégoat, O., Choné, O., Gaudillère, J.-P. & Pernet, D., 2007. Different environmental conditions, different results: The role of controlled environmental stress on grape quality and the way to monitor it. In: Proc. XHIth Aust. Wine Ind. Tech. Conf, 28 July-2 August, Adelaide, Australia. [ Links ]
Verdugo-Vásquez, Ν., Acevedo-Opazo, C, Valdés-Gómez, Η., Ingram, Β.. Garcia de Cortazar, I. & Tisseyre, B., 2019. Towards an empirical model to estimate the spatial variability of grapevine phenology at the within field scale. Precis. Agric. 1-24. [ Links ]
West, A.G., Dawson, T.E., February, E.C., Midgley, G.F., Bond, W.J. & Aston, TL., 2012. Diverse functional responses to drought in a Mediterranean-type shrubland in South Africa. New Phytol. 195, 396-407. [ Links ]
Submitted for publication: September 2018
Accepted for publication: June 2019
* Corresponding author: E-mail address: hevaldes@uc.cl
Acknowledgements:
ARTICLES
doi:https://doi.org/10.21548/42-2-3270
Profiling Potentially Smoke Tainted Red Wines: Volatile Phenols and Aroma Attributes
M. McKayI, *; F.F. BauerII; V PanzeriIII; L. MokwenaIV; A. BuicaV
IDepartment of Viticulture and Oenology; Stellenbosch University
IIDepartment of Viticulture and Oenology; Stellenbosch University
IIIInstitute for Grape and Wine Sciences; Stellenbosch University
IVCentral Analytical Facility, Stellenbosch University, Private Bag X1, Matieland (Stellenbosch) 7602, South Africa
VDepartment of Viticulture and Oenology; Stellenbosch University
ABSTRACT
Malodourous compounds, including volatile phenols (VPs) are frequently found at concentrations below their odour thresholds in wine, and may therefore be considered to present no threat to wine quality. Most investigations into smoke taint quantify compounds by chemical/analytical means, or investigate sensory effects of supra- and peri-threshold contamination in model wine. In this project, twelve wines (submitted by the South African industry as potentially smoke tainted) were screened for VPs using GC-MS, and characterized using descriptive analysis (DA) by a sensory panel highly trained in smoke taint evaluation. Results were compared statistically to elucidate relationships between chemical and sensory characteristics. It was demonstrated, using the combined dataset that concentration and composition of VPs in the wines correlated well with certain sensory attributes. Guaiacol was present in most samples at peri- or supra-threshold levels, but was not correlated with taint unless in combination with other phenols, in which case it was associated with 'smoky', 'ashy' and 'herbaceous' attributes. Wines with supra-threshold levels of VPs showed negative attributes ('chemical / plastic', 'tar / BR' and 'medicinal / Elastoplast™'). In some cases, sensory effects ('earthy / dusty / potato skin', 'mouldy / musty' and 'cooked vegetables (veg.)') could not be attributed to supra-threshold VP contamination, and therefore seemed to be due to combinations of VPs at subthreshold levels. Associations between negative attributes and historical bushfire events prior to harvest were found for a number of the wines. This study emphasizes the importance of understanding effects of VPs on wine aroma, and escalating awareness and sensitivity to these issues in the wine industry.
Key words: red wine; volatile phenols; smoke taint; sensory analysis; GC-MS
INTRODUCTION
In order to establish and maintain strong, positive international brands in a fiercely competitive market, it is important that wine producers understand the character of their products and ensure consistency of required sensory features. Negative attributes in red wine, for example, smoke taint, 'ashiness', 'greenness' / 'herbaceousness' and 'burnt rubber (BR)' have been discussed by various authors (Goode, 2008; Hammond, 2015; Heyns, 2014) and necessitate the investigation of compounds associated with these descriptors.
Volatile phenols (VPs) are a group of compounds that have been associated with smoky, burnt and acrid attributes (Parker, et al., 2013). Their presence in wine may derive from a number of sources including grapes and yeast, in particular the Brettanomyces species (Romano et al., 2009; Weiss, 2014). Wood maturation has been found to contribute to the pool of VPs (Boidron et al., 1988; Prida & Chatonnet, 2010), with the cresols, as well as 3, 4-dimethylphenol (3,4-DMP), guaiacol and 4-EP increasing as a result of lignin pyrolysis during the toasting of oak barrels (Etievant, 1981; Cadahía et al., 2003; Fernandez de Simon et al., 2008). Although VPs may derive from a number of sources, in recent years much research concerning VPs has been centered on smoke taint, an off-odour that results from exposure of grapes to bushfire smoke.
Bushfires often occur in very close proximity to vineyards in most wine growing areas globally, with recent examples including the United States of America (Jin et al., 2015), Australia (Cox, 2018), the Iberian Peninsula (Barnes, 2018), and South Africa (SA). The contribution of VPs to the pool of taint compounds in grapes and wine has been shown to escalate severely following a bushfire event (Kennison, 2013; Krstic et al., 2015; Ristic et al., 2016). These compounds have been individually characterized in different matrices by a number of authors (Wilkinson et al., 2011; Parker et al., 2013; Petrozziello et al., 2014) and their odour detection thresholds (ODTs) have been established (Table 1). Previous researchers (Kennison et al., 2009; Ristic et al., 2017) have elucidated the presence and characteristics of individual VPs in deliberately smoke-tainted (experimental) wine. Some authors have characterized the effects of individual smoke taint compounds in specific matrices (Parker et al., 2013).
The chemical nature of different compounds present, their concentrations, the interactive effects and the matrix all play a role in how volatile compounds are perceived sensorially. Aroma compounds in wine are perceived together, and different combinations could have olfactory impact even when they are present at peri-threshold or sub-threshold levels (Lorrain, et al., 2013). Recent research has shown that aroma compounds such as thiols produce aromatic differences in wine when they are present in combination (Coetzee et al., 2015, Lapalus et al., 2016; Wilson, et al., 2018), which suggests that malodourous compounds in combination at peri- and sub-threshold levels in wine might also produce variable aromatic effects. Chemical assessment of the sensory impact of compounds in wines generally consider the ODT or OAV (odour activity value) of individual compounds, and disregard or overlook the combinatorial effects of all the compounds in solution, including the matrix effect. An example of this impact is the alcohol concentration of wine, which has been shown to affect the volatility of aroma compounds (Petrozziello et al., 2014). This situation is further complicated if off-flavour contributors are present in combination at peri- and sub-threshold levels, because they may present an aroma profile that even professionals find difficult to define or separate into components (Tempere et al., 2014).
In order to address industry needs for VP analysis, and build a body of knowledge regarding smoke taint issues, producers in South Africa are encouraged to submit commercial finished wines and tank samples to the Department of Viticulture and Oenology (DVO), Stellenbosch University (SU) each year following bushfires in regions adjacent to vineyards in the Western Cape, South Africa. To our knowledge, the impact of VPs has not previously been analysed and characterized both sensorially and chemically in inadvertently smoke-affected commercial wines. The aims of this project were thus to investigate whether the sensory attributes of these commercial (actually or potentially smoke-affected) wines as evaluated by a trained panel using descriptive analysis (DA), could be correlated with VP content, as quantified by gas chromatography-mass spectrometry (GC-MS). Results in this study are presented in terms of sensory and chemical data, and an evaluation of relationships that might exist between them, as well as discussion of whether the results can be correlated with incidents of smoke-exposure of grapes. This study may therefore provide useful information to the wine industry through increasing understanding of ways in which problematic compounds (in this case VPs) contribute to sensory characteristics, and elucidating whether sensory predictions can be made from chemical data.
MATERIALS AND METHODS
Wines
Wine samples (750 mL bottles) were randomly selected for this study from wines submitted during 2016 and 2017 by South African wine producers for sensory analysis at the DVO and VP analysis at the Central Analytical Facility (CAF) at SU. Only red wines were submitted by industry, therefore no white wines were available for the study. Producers had indicated that the submitted wines may have had smoke taint issues through vineyard expose to smoke, or as a result of their own informal assessment. The wines were from different South African Wine of Origin (WO) regions (see Figure 1 and Table 2), and were labelled A to L for the purpose of the study.
Wines were not prescreened before the study (except by producers), and it was therefore not known if the wines were actually contaminated with smoke or VPs. Twelve wines were selected for this study as this was the maximum that could be assessed by a sensory panel in one session using DA, without incurring sensory fatigue (Campo et al., 2010). Wines were stored in the Stellenbosch University 'vinothéque\ a wine storage area with controlled temperature (15 °C) and relative humidity (70%).
Sensory analysis
DA was conducted on the twelve wines selected for study. Ten assessors, all healthy non-smoking females with an age range of 20-60 years, took part in the sensory analysis panel sessions. All panelists, who regularly attended sensory analysis sessions at the DVO, and formed part of a formal 'smoke taint' panel, had previous experience in DA. Sensory data were obtained for this study in compliance with institutional procedures for sensory analysis (Ethical Clearance VIT-2018-6570). All participants provided their informed consent before participating in the study.
Sensory training
A combination of consensus and ballot training was conducted before testing in two training sessions, with an interval of one day between sessions. As smoke taint sensory analysis had been carried out with this panel previously, panelists were familiar with a number of smoke-related attributes, and therefore did not require the usual extensive training associated with DA.
For the first thirty minutes of each training session, panelists were asked to re-familiarise themselves with an initial set of ten reference standards (based on previous smoke taint work), which were presented in 50 mL amber glass bottles (Consol glass, RSA). After a break of 20 min, panelists were presented with 20 mL of each commercial wine sample in black ISO 3591 standard tasting glasses (Consol glass, Stellenbosch, South Africa), and asked to assess wine aroma silently for around 30 min, using the agreed attribute lists, but also including any additional aromas perceived that were not on the list. Following this, the panel discussed the aroma attributes of each sample, and differences and similarities between samples, which were noted by the panel leader. These discussions generated a comprehensive list of aroma descriptors that were unique to the wines under study. The panel was also asked to rate the intensity of the various aroma attributes, and the panel leader noted frequencies and intensities on a whiteboard as the discussion took place. The panel agreed by consensus to include or exclude various aroma attributes, and reduce redundant terms, until a simplified list of descriptors was decided upon that described all the odour families present in the wines. The data regarding the descriptors and intensities were collected, sorted and tabulated at the end of each session by the panel leader. A final list of seventeen attributes for testing was confirmed after the last training session. These attributes, agreed upon through consensus by the panel, included 'sweet-associated'/ generally positive attributes: 'berries', 'floral / violets', 'prunes / raisins', 'vanilla / caramel', 'tobacco', and 'pencil shavings'. Attributes generally regarded as negative to red wine character were also identified: 'herbaceous / green', 'cooked veg.', 'leather / barnyard', 'earthy / dusty / potato skin', 'smoky', 'ashtray', 'medicinal / Elastoplast™' (also called 'Band-Aid'® by the panel), 'mouldy / musty', 'tar / burnt rubber (BR)', and 'soy sauce'. Reference standards for the aroma attributes are shown in Table 3.
Sensory testing
The sensory testing phase of the twelve wines was carried out in a well-ventilated, well-lit sensory laboratory with a temperature of 20°C. Each taster worked in an isolated white booth, and no communication was permitted between tasters. Wine samples of exactly 20 mL were presented to tasters in black ISO glasses (covered with clear inert polystyrene lids (Petri dish, Labsupply, Cape Town, South Africa)) to allow equilibration of volatiles in the headspace. The twelve wines were evaluated for aroma attributes only, in triplicate, over two sessions (three sets of six samples in each session). Samples were marked with random three-digit codes and presented to tasters according to William Latin Square design in a unique, counterbalanced manner to avoid order effects, such as those caused by fatigue or desensitisation of panel members. Tasters were also asked to pause for 15 min between sets. Tasters assessed the wines according to the prescribed attributes list, and assigned an intensity to the attributes perceived in the wine by marking on an unstructured line scale, with 0 as not perceived/lowest rating, and 100 as highest intensity. If an attribute was not present/perceived, the panelist was asked to assign zero on the line scale.
GC-MS analysis
Wines were analyzed by GC-MS according to a modified version of a previously described method (De Vries et al., 2016). Twelve VPs were quantified: guaiacol, 2,6-dimethyl phenol (2,6-DMP), 4-methylguaiacol (4-MG), o-cresol, phenol, 4-ethylguaiacol (4-EG), w-cresol, p-cresol, 2,3-dimethylphenol (2,3-DMP), eugenol, 4-ethylphenol (4-EP) and 3,4-dimethylphenol (3,4-DMP).
Stock solutions of 1 mg/L of pure compounds (all reference standards supplied by Sigma-Aldrich/Merck, KGaA, Darmstadt, Germany), were diluted for calibration purposes, creating an 8-point calibration series from 0.05 to 100 μg/L. Three 10 mL aliquots of each wine were transferred into 20 mL SPME glass vials (Gerstel, Mülheim, Germany). An internal standard, deuterated anisole-d8 (methoxybenzene-d8; Sigma-Aldrich/Merck, Darmstadt, Germany), was added to each vial at a concentration of 10 μg/L. Two mL of 30% w/v NaCl (Merck, Germany) in ultra-pure distilled water (Millipore, Bedford, MA, USA) was also added to each vial. The vials were sealed with PTFE-lined magnetic crimp caps (Gerstel), and vortexed (Vortex-Genie® 2; Scientific Industries Inc., NY, USA) for 30 seconds before being placed on the auto-sampler (Thermo Scientific TriPlus RSH). Vials were incubated in the auto-sampler for 5 min at 50 °C, after which a pink 65 μm Polydimethylsiloxane / Divinylbenzene / (PDMS/DVB) / 'Stableflex' SPME fiber (Supelco, Belafonte, PA, USA) was exposed to the headspace for 15 min at the same temperature. After exposure, the fiber was injected and left for 10 min in order to allow desorption of volatiles. The injector was operated in splitless mode. Analysis of VPs was performed using a Thermo Scientific trace 1300 gas chromatograph (Anatech, coupled to a Thermo Scientific TSQ 8000 Triple Quadrupole Mass) (Anatech Instruments (Pty) Ltd, RSA). The MS-detector was set for acquisition in single reaction monitoring (SRM) mode. Chromatographic separation of the VPs was performed on a polar Zebron ZB-FFAP (30 m, 0.25 mm ID, 0.25 μπι film thickness capillary column. The initial oven temperature was 50 °C, held for 3 min, then increased to a final temperature of 250 °C at a rate of 15 °C/min and a final hold time of 3 min. The injector, ionization source and transfer line temperatures were maintained at 250 °C. Helium at 1 mL/min flow rate was used as carrier gas. The emission current of 50 μA was used with argon collision. Compounds were identified by cross-referencing retention times and mass spectra with the NIST11 spectral library. The limit of detection (LOD) and limit of quantitation (LOD) for analytes were calculated using the slope of the calibration curve for each compound and the standard deviation of the response at low concentrations (σ) where LOD = 3.3 σ / slope and LOQ = 10 σ / slope.
Data analysis
A mixed model two-way analysis of variance (ANOVA) was applied to assess the significance of the attributes and panelists' performance, using both PanelCheck® version 1.2.1 (Nofima, Âs, Norway) and Statistica version 12 (StatSoft Inc., Tulsa, USA). Consensus amongst panelists was assessed by Tucker plots. Post hoc Fisher's least significant difference (LSD) and least squares means (LSM) were used to test for significance of sensorial differences between the wines. A p-value threshold of 0.05 was used to determine statistical significance. Principal component analysis (PCA) bi-plots and 'heatmaps' were created using sensory and chemical data, to demonstrate similarities or dissimilarities between wines. To illustrate associations between sensory attributes and VP chemistry, multiple factor analysis (MFA) was performed. Wine sensory data, as well as sensory and chemical interactions were analyzed using Statistica 12 (Dell Software, Texas, USA). 'Heatmaps' were generated for sensory and chemical data using R 3.4.2 (R Core Team, 2015).
RESULTS
Sensory results
The twelve wines were evaluated for attributes using DA with a trained sensory panel. Separate ANOVAs were generated for each attribute using a mixed model with panelists as the random effect.
Data are not shown for attributes that were perceived at low intensity (<20), and were similar in all the wines with no significant differences (p>0.05) between wines. These include positive (sweet / fruity) attributes 'vanilla / caramel', 'tobacco', 'pencil shavings' and 'floral / violet'. The two most intense fruity / sweet attributes, i.e. 'berries' and 'prunes / raisins' can be seen in the LSM diagrams in Figure 2. Wine D was perceived as significantly lower than all other samples in these two attributes.
Figure 3 shows selected negative or off-flavour attributes ('smoky', 'ashtray', 'herbaceous / cooked veg', 'medicinal / Elastoplast™', 'leather / barnyard', 'tar/burnt rubber (BR)', 'earthy / dusty / potato skin'), with wines C, D, E and H presenting these most strongly.
A clustered 'heatmap', a compact means of visualizing large data sets with a number of variables (Perez-Llamas & Lopez-Bigas, 2011), was produced from the sensory data for the twelve wines, giving an holistic picture of their attributes, and providing information on the differences and similarities between the wines (Figure 4). As the sensory data was unitless (0-100 line scale scores for intensity of each attribute), it was not necessary to normalise the dataset before compiling the heatmap.
On the horizontal axis, the seventeen aroma attributes are shown. Vertically, wines A to L are presented and the differences in the wines per attribute can be seen. Colour (or a shaded scheme) is used to represent 'bins' of average intensities for each attribute according to the 0-100 scale assigned by panel members. Wines are grouped in a dendogram on the left hand side of the heatmap based on a standard hierarchical clustering of similarity or dissimilarity of attributes and intensities. As can be seen, wines B, L, A, J and G are most closely associated with berry and prune flavours, and few other attributes. Wines K, I, F and C are grouped together and share lower intensity of most attributes generally, and exhibit some negative attributes like 'leather / barnyard' and 'tar / BR' at low levels. Wine D has strong intensities of negative attributes, but is in a sensory grouping with wines H and E, which are linked strongly through the 'earthy / dusty / potato skin' descriptor. These results mirror some findings from the LS means of the selected attributes (Figure 3).
In the PCA biplot (Figure 5), the first two principal components explain more than 80% of the variation in the sensory dataset. The data for wines J, L, K, I and C show relative groupings with wines A, B, L and G in the quadrant closest to descriptors such as 'berries', 'floral / violet', 'prunes / raisins' and 'vanilla / caramel'. These two groupings (J, F, L, K, I, C and A, B, L, G) are present for both PC1/2 and PC1/3 (not shown). Wines H and E form a group that is associated with descriptors such as 'cooked veg.', 'mouldy / musty' and 'earthy', and these wines separate on PC2. Wine D separates out most strongly from all the other wines, and is most closely associated with wines that have attributes 'leather / barnyard' and 'tar / BR', and shows very high intensities for these attributes (mean intensity >60 on a 100 point scale).
GC-MS results for VP analysis
Results for the GC-MS analysis (averages for three instrumental repeats) of VPs are listed in Table 4, which also indicates where levels of compounds exceed the ODTs commonly used in the literature. Where possible, ODTs for red wine were used, but if not available, the ODT most appropriate to the study was considered.
As can be seen from Table 4, all of the wines contained at least one of the VPs at peri- or supra-threshold levels, and all of the wines (except B, J and L) contained guaiacol and p-cresol at potentially detectable levels. A few wines (C and D in particular) were notable in their very elevated levels of specific VPs. Most wines had low levels (below ODT) of the eugenol, phenol and 2,6-dimethyl phenol. Guaiacol is present at twice odour threshold in wine D. The level of 4-MG is 859 μg/L, around 40 times its ODT in water. The cresols are also found in high concentration in wine D: /w-cresol is present at 180 μg/L, or around three times its ODT in model wine; p-cresol at 17 times its ODT in model wine (173 μg/L). The xylenols are also present at higher levels than in the other wines: 2,3-DMP almost at its ODT levels and 3,4-DMP a 681 μg/L, at around half its ODT. Significantly, 4-EP is present very near its ODT (550 μg/L).
A heatmap was also compiled for the VP data (Figure 6). As the VP data showed levels that differed by several orders of magnitude (Table 4), standard scores (z-scores) were calculated in order to standardize the data, and minimize distortions caused by different compound levels.
The z-score for each compound was calculated using the formula z = (x - μ) / σ where x is the individual concentration value for the compound, μ is the mean for each compound group, and σ is the standard deviation for the group. Compounds are presented on the horizontal axis, and wines A to L are presented vertically so that the differences in the wines per compound (z-score) can be viewed. As previously, colour is used to represent 'bins' of average intensities for each compounds according to the VP z-scores with blue indicating levels higher than the mean (pale yellow). Wines are grouped on the left hand side of the heatmap based on a standard hierarchical clustering of similarity or dissimilarity of z-scores.
Inspection of the chemical heatmap shows similarities in wine groupings compared to those in the heatmap of sensory attributes (Figure 4). Wine D stands apart from the other samples (especially regarding its very high 4-MG content), with the closest group of wines in terms of chemical composition being E and H (notably high in guaiacol, 4-EP and 3,4-DMP). There is dissimilarity between these three wines (D, E and H) and the rest of the samples, which have much lower VP contents.
Within the larger sample grouping, F and C have similar levels of 4-MG, o-cresol and phenol. Wines L, A and G form a grouping, very closely related to K, J and B, based on low phenolic contents, with only 2,6-DMP and eugenol for the former grouping showing z-scores slightly higher than the mean.
Combined sensory and chemical data
A multiple factor analysis (MFA) correlation plot was generated combining results for 12 VPs and 17 aroma attributes (Figure 7). Compounds and / or attributes that contributed to the first and the second dimensions are located within the two correlation circles. Together the two dimensions account for 66.1% of the variance within the dataset. The inner circle represents a correlation factor (R2) of 0.7 and the outer circle a correlation factor (R2) of 1. In Figure 7A, attributes located along the positive axis of dimension 1 include 'chemical / plastic', 'tar / BR', 'medicinal / Elastoplast™', 'leather / barnyard'.
These attributes are associated with p- and /w-cresol, 4-MG, 2,3-DMP, 4-EP and 3,4-DMP. Wine D is positioned in this region of the MFA (Figure 7A), but the samples are so different from each other that they span a very wide range (Figure 7B) along dimension 1 (with wine D separating out from other wines) and dimension 2 (with wines E and H separating from other wines). Attributes located along the negative axis of dimension 1 are 'prunes / raisins', 'floral / violet' and 'tobacco', and most of the wines form a grouping in the negative quadrant along dimension 1 closer to these attributes and associated with eugenol, 2,6-DMP and 4-EG. The broad separation in dimension 1 therefore seems to be between sweet-associated attributes and faulty / negative attributes on the opposite side of the plot origin. Dimension 2 separates chemical-related attributes including 'chemical / plastic' and 'tar / BR', rubber and more vegetal-earthy attributes in the negative direction of this dimension. VPs associated most closely with the chemical attributes are p-and m-cresol, and 4-MG. Guaiacol is most closely associated with the 'smoky', 'ashtray' and interestingly, 'herbaceous'. Most of the wines have sweet-associated attributes, but wine D is strongly separated out from the other wines and associated with 'chemical' type faults, and wines E and H associate strongly with the 'earthy / dusty', 'cooked veg' and 'mouldy / musty' attribute set.
From this dataset, it appears that o-cresol and phenol are associated equally with positive and negative attributes. In the PCA of chemical compounds and wines (Figure 8), Wine D separates strongly along the first principal component as a result of its complex chemical composition (Figure 8) and wine C separates out along the second principal component from the other wines, possibly because of higher o-cresol and phenol content (Table 4).
DISCUSSION
Although previous research has shown the importance of VPs in smoke taint, it is crucial to consider aspects other than the VP concentrations that can impact on the aroma of wines. It is well known that the grape cultivar plays an important role in the overall aroma profile of the wine due to the presence of primary aroma components such as terpenes, methoxypyrazines and norisoprenoids (Ilc et al., 2016) that migrate from the grape to the wine during the vinification process. Compounds at peri- or sub-threshold levels may have their sensory contribution merged with that of the cultivar, with subsequent masking (Hein et al., 2009). Wine age has an impact on the formation of aging bouquet, and may increase levels of ethyl acetate and acetaldehyde that could have a masking or additive effect on certain components (Coetzee et al., 2016). Ethanol concentration has been shown to affect the volatility of certain components, and the perception of aroma; for example, the intensity of the smell of a mixture of nine fruity compounds in alcoholic solution was shown to decrease with the amount of ethanol present in the mixture (Escudero, et al., 2007). When ethanol was not present, the aroma was strong; however, as the concentration of ethanol increased in the study matrix, the intensity of the fruity odour decreased as ethanol concentration increased (Escudero et al., 2007). Goldner et al. (2009) showed that wines with the same aroma composition but higher alcohol levels were described as herbaceous instead of fruity. A reduction in alcohol content in wine can affect perceptual interactions between woody and fruity wine odorants and modify their chemical proportions (Le Berre et al., 2007). In the current sample set, alcohol concentrations (provided by the producers) ranged from 13% v/v to 14.2% v/v, but the alcohol levels of the wines did not appear to have any influence on aroma attributes. It is also noteworthy that the odour detection thresholds for six of the VPs analyzed are only available in the literature for water, and two are available only for alcohol (model wine) solution (Table 1). Only four of the compounds in this study have had ODT levels established in red wine, and given the potential matrix effects, these thresholds may not be comparable. The ODTs can only offer a tentative guideline as to how powerful the odour activity of a compound will be in a different matrix. OAVs were not calculated for this reason.
VPs are known for being produced during bushfires (Krstic et al., 2015), absorbed by grapes (Ristic et al., 2015), and carried through to wine (Ristic et al., 2011). It was therefore of value to consider bushfire events that may have impacted grapes prior to harvest. The Western Cape in South Africa has hot, dry summers, and the natural vegetation (the fynbos) has evolved to burn regularly (Strydom & Savage, 2016). Fynbos fires are rapid and fairly cool, moving very fast over mountainous regions with the assistance of often gale-force South Easterly winds, accompanied by smoke that can cover hundreds of square kilometers. Vineyards are located all over the province, and are frequently in the path of these bushfires. It is not unlikely, therefore, that grapes will be exposed to a range of smoke-associated volatiles including VPs, which may then transfer to wine (De Vries, et al., 2016).
Two sources were used to trawl historical data on fires in the Western Cape. These were Forest Watch (Fire) (https://fires.globalforestwatch.org/) and Advanced Fire Information Systems (AFIS) (https://southernafrica.afis.co.za/). Both websites provide detailed data on various aspects of bushfire monitoring via low earth orbit satellite, and have historical archives relating to fire events going back to 2008 and covering most land masses, and are a very useful resource for tracking fires in real time.
Although the phenological stage of smoke events discussed below is unknown, dates for bushfire data were targeted for the typical harvesting period for red wines in the Western Cape, viz., February to April. The closer to harvest the fire event occurs, the more impact it will have on the aroma of wine made from smoke-affected grapes (Shepherd et al., 2009; Kennison et al., 2009). It is acknowledged that this is a wide window, but the potential for smoke taint exists. A number of the aroma attributes may be explained in terms of the VP composition of the wines in this study, and the available ODTs for the various compounds. The PCA of the sensory results of the wines supports the frequency and intensity listings given in the heatmap and in the LS means graphs, as it shows that the data for samples separate into groups (Figures 3 and 4). The dendogram of chemical results (Figure 4) also shows a separation according to chemistry into similar groupings.
Based on the sensory and chemical data wines A, B, G, J and L formed a broad chemical and sensory association with low VP contents, and positive aroma attributes. Sensory characterization of these wines showed high levels of sweet-associated attributes, with the 'berries' descriptor, and 'vanilla / caramel' being the attributes with the highest means. As can be seen in the sensory heatmap (Figure 4), few negative descriptors were given for this group of wines. Wines A and B were Grenache from the Franschhoek region of the Western Cape (2015 and 2016 vintages respectively), wine G was a Shiraz from Elgin (2016), and Wines J (a blend) and L (Pinotage) were both vintage 2015. Based on date queries with ForestWatch and AFIS websites, these wines were all from regions that were unaffected by bushfires during the period leading up to harvest, with the exception of wine B. Fires between February and April 2016 in the La Rochelle Nature Reserve, as well as near the Berg River dam in Franschhoek may have affected this wine, but it was subject to one round of reverse osmosis (RO) due to suspected smoke taint. The winemaker submitted the wine for VP analysis to check that the RO had worked, which sensory analysis confirmed. There were no fires reported in 2015 in the Franschhoek valley during the period leading up to harvest. There were fires in the Grabouw town area between March and April 2016, which may have affected wine G, however, it showed no significantly negative characteristics despite having peri-threshold levels of guaiacol and p-cresol. Wine producing areas in Elgin lie to the south east of Grabouw, and prevailing wind is a strong south easterly wind throughout summer over this region. Smoke and ash would be likely to have been carried on the wind over the mountains to the Southeast towards the Helderberg basin, away from Elgin. Wine J was a Cabernet-Merlot blend from the Stellenbosch region, and most associated with the 'floral' descriptor (mean intensity of 23.77 on a 100 point scale). There were no fires recorded in the Stellenbosch region in 2015, although it was a year in which extensive fires occurred in other regions. Durbanville was unaffected by bushfires in the period leading up to harvest 2015, and wine L (a Pinotage from Durbanville) did not exhibit any strong smoke-related attributes. In fact, wine L showed a tendency to be lower in negative attributes like 'tar / BR', 'medicinal / Elastoplast™' and 'cooked veg.' than most of the other wines.
The second grouping of wines that is suggested by chemical and sensory data is the K, I, and F group, which unlike the first group, is not associated with positive fruity descriptors. These data support the findings by Atanasova et al. (2005) who observed that sub- and peri- threshold concentrations of woody compounds (including guaiacol) can modify the perception of a supra-threshold fruity odour. Wine F (a 2016 Cabernet Franc from Elgin) does not have any VPs at peri- or supra-threshold levels (Table 3), and does not exhibit any high intensities of aroma characteristics. The descriptors with the highest means for wine K were 'tar / BR' (mean intensity of 33), and 'leather / barnyard' but these were not significantly different from a number of the other wines. Wine K is WO 'Western Cape' (vintage 2016), Merlot and Cabernet Sauvignon blend, which indicates that the grapes may be sourced from different areas of the province. This wine contained guaiacol at peri-threshold concentration, but all other VPs were well below their ODTs. As previously noted, the Western Cape (Figure 1) was affected by severe bushfires during 2015 and 2016, which may explain the presence of guaiacol. The wine may also have had wood maturation, as this was not specified by the producers when samples were submitted. Wine I was a Cabernet Sauvignon from the Durbanville region (vintage 2015). Despite having a number of VPs at peri- and supra-threshold level (Table 3), this wine had no outstanding negative attributes. There were no notable fire events in Durbanville area during February to April 2015. Five of the VPs are present at supra-threshold levels, which would suggest that they should be detected by a trained panel, but this was not the case. The wines did express high fruit intensity, and this could well have masked any sensory contribution by the VPs present in these wines, as has been indicated by Atanasova et al. (2005) previously. These authors, and later De Vries et al. (2016), showed that guaiacol could contribute 'sweet, woody' notes to wine, which cannot be considered off-flavours, but Lorrain et al. (2013) found that VPs could impact red wine esters (sweet, fruity notes), so the olfactory space is complex. Additionally, the presence of other compounds like IBMP, which is known to be an important primary aroma contributor in Cabernet Sauvignon, and can affecting olfactory perception and mask other contributors (Hein et al., 2009).
Wine C (a Cabernet Sauvignon from the Stellenbosch WO region, vintage 2012) shares some characteristics with the K, I, F grouping, but also with wines H and E. AFIS recorded large bushfires between February and April 2012 in the Jonkershoek region, directly due South East of Stellenbosch. Wine C had the highest levels of o-cresol and phenol of all the wines, which would explain the significantly higher (p < 0.05) 'smoky' attribute (Figure 3-i). The 'leather / barnyard' (Figure 3-vi, mean intensity of 33.03) was higher than all other wines except H. This attribute is interesting because it is normally associated with 4-EP, and wine C contains negligible levels of this compound. The 'leather' characteristics may be due to olfactory effects of the cresol and phenol with other compounds, including IBMP, which have been described before (Lorrain et al., 2013; Campo et al., 2005).
Wines E (Cabernet Franc) and H are strongly associated with negative attributes (Figures 3 and 8). Wine E was a Cabernet Sauvignon from Franschhoek (2016), and was significantly higher (p < 0.05) in 'earthy / dusty / potato skin', 'mouldy / musty' and 'ashtray' attributes. Fires between February and April 2016 in Franschhoek may have affected this wine. As Franschhoek lies in a valley between high mountain peaks, smoke could have been trapped in the in low-lying areas and affected grapes in the period leading up to harvest. As this is also Cabernet Sauvignon, it is possible that the 'earthy / dusty / potato skin' could have been the result of supra-threshold levels of guaiacol and 4-MG interacting with IBMP and causing olfactory effects.
Wine H (Merlot) was also significantly higher (p < 0.05) in the 'earthy / dusty / potato skin' (mean intensity of 60.45) attribute than all the other wines (Figure 3). There were numerous large bushfires during March-April 2015 across the Western Cape, but particularly bad fires in the Helderberg region, with smoke trapped for several days in the Helderberg basin. Previous work by Australian researchers has shown that repeated or extended periods of smoke exposure of vineyards can lead to a cumulative effect in associated wines (Kennison et al., 2009). Fires burned for days in the Steenbras area with a prevailing wind from the Southeast taking large quantities of smoke and ash into Helderberg valley and wine producing areas. Wine H is significantly higher in the ashtray attribute (Figure 3ii), and shows 'green' characteristics as it is significantly higher in 'herbaceous' attribute (Figure 3iii) and the 'cooked veg.' attribute (Figure 3iv), both of which are associated with the cultivar, but may have been perceptually enhanced by the presence of smoke-derived compounds. This wine also is one of the highest in 'leather / barnyard' aroma. In wine samples E and H, guaiacol and 4-MG are present at supra-threshold levels, and 4-EP and 3,4-DMP are at approximately half their literature threshold values. The MFA (Figure 7A) indicates that 4-EP and 3,4-DMP are associated with 'leather / barnyard / animal' attributes. Guaiacol is associated strongly with the 'smoky' and 'ashtray' attributes (Figure 7A), but also, interestingly, is also close to the 'herbaceous' and 'mouldy / musty' attributes. In the MFA, o- and p-cresol, as well as 4-MG and 2,3-DMP are associated with 'chemical / plastic', 'tar / burnt rubber' and 'medicinal / Elastoplast™' attributes. The wines were submitted as definitely or potentially smoke-tainted by industry, and it may be that the mouldy, leathery or herbaceous characteristics could have added to, or been mistaken for smoke taint by industry members not specifically trained in identifying smoke taint attributes.
Wine D was chemically characterized by intense negative attributes, and high VP content (including, but not limited to, 4-MG at 859 μg/l, m- and p-cresol at ~180 μg/L, and 4-EP at 550 μg/L), which greatly exceeded published ODTs for these compounds. This wine separated out in both sensory and chemistry results from other samples. The wine was sensorially characterized by 'medicinal / Elastoplast™' (mean intensity of 68.53), 'tar / BR' (60.87) and 'chemical / plastic' (30.47) attributes, all significantly higher than other wines (Figures 3 and 4). The 'leather / barnyard' (intensity of 37.87) attribute was also higher than most of the other wines. This wine is from the De Doorns region, vintage 2014. It is a Cabernet Sauvignon, a cultivar that is traditionally harvested fairly late in the season. As most of these wines were submitted for assessment for smoke taint, it is probable that this wine was made from grapes affected by bushfires in the De Doorns region. March-April data for 2014 from the AFIS system shows bushfires on the slopes of the mountains directly to the south, and close to the town. As the WO area is in a long, deep valley running approximately north to south, with wine and grape growing areas spread across the bottom of the valley, it is entirely feasible that smoke settled in the valley, and was absorbed by grapes prior to winemaking. Previous work in this area of research has suggested that combinations of VPs can cause a 'burnt rubber' or 'tar' attribute (Panzeri, 2013), as seems to be the case in the last wine sample D.
Despite this, the levels of VPs in the samples, specifically 4-MG, o- and p-cresol and 4-EP, are not necessarily consistent with wines made from grapes that have been exposed to natural wildfires where guaiacol and syringol can be elevated (Hayasaka, et al., 2010; Parker et al., 2013; Krstic, 2015). Likewise, there are a number of aromas ('earthy / dusty / potato skin', 'cooked veg.', 'mouldy / musty' and 'herbaceous') that are not explained by close association with specific VPs at peri- or supra-threshold concentrations, and which may be the result of olfactory effects of sub-threshold combinations. It may also be the case that the VP levels in wines D, and E, (given the elevated levels of 4-EP), could have been due to other sources such as Brettanomyces yeast infection in barrels, toasted oak wood contact and/or the presence of creosoted wooden posts in or near vineyards. Wines E and H (Merlot and Cabernet Sauvignon) could simply be reflecting varietal character in their 'green' notes.
CONCLUSIONS
This study investigated the levels of volatile phenols (VPs) found in South African red wines that have been selected by industry as actually or potentially smoke tainted. As the sensory panel used in this study was experienced in smoke taint analysis, it is likely that this sensitivity could have contributed to the fact that taint-related attributes were responsible for most of the variation within the sensory sample set. However, VP content of samples could be correlated, in most but not all of the cases, to sensory descriptors for the wines, when odour detection thresholds for the compounds were taken into account. For example, it was demonstrated that certain sensory attributes ('smoky', 'ashtray') in some of the wines could be ascribed to higher levels of specific, or combinations of, VPs at peri-threshold levels. In other cases, however, it appeared that combinations of compounds (for example, cresols and xylenols) at sub-threshold levels led to unexpected sensory effects ('earthy / dusty', 'chemical' and 'tar / burnt rubber'). Guaiacol was present in eight of the twelve samples at or above ODT, but as the wines had been submitted by industry for suspected, or perceived smoke taint, this result was not surprising. Also, whether samples had received any oak treatment was omitted from the information provided on the samples, and wood treatment is a well-known source of this compound. Guaiacol did not seem to be correlated with a perception of 'smoke' in any of the wines unless it was in combination with other phenols, and in fact may have contributed to sweet-associated and fruity aromas in the majority of samples. Out of twelve wines, the four (C, D, E and H) that were described with the most negative attributes, at significantly higher levels than the others, were all from regions that had experienced severe fire events. Out of the eight wines that did not show negative attributes, only two were from regions that had experienced bushfires in the period leading up to harvest, and one of these had been treated with reverse osmosis.
A prescreening of the samples by expert tasters in smoke taint may have established that a number of the wines were not affected by smoke taint, negating the need for full sensory analysis and analysis. However, this requires that industry and/or researchers be trained to a high level. The subsequent investigation and discussion highlights the fact that these issues are more complex than smoke exposure of grapes causing smoke taint in wine, and the uncertainty around this type of information. There is certainly a need for better methods for monitoring smoke exposure in wine regions.
This study also emphasizes the importance of understanding the effects of compounds like VPs on wine, and escalating awareness of, and sensitivity to, the interactions and synergies between them. Further research would help to clarify effects of compounds at various levels and in different matrices. Confirming odour detection thresholds in specific matrices would be beneficial, as there seems to be limited information published in this regard. There is also value in investigating amelioration of the sensory effects of VPs if they are prominent and negatively impact wine quality.
LITERATURE CITED
Atanasova, B., Thomas-Danguin, T., Langlois, D., Nicklaus, S., Chabanet, C. & Etiévant, P., 2005. Perception of wine fruity and woody notes: influence of peri-threshold odorants. Food Qual Prefer. 16, 504-510. [ Links ]
Barnes, T., 2018. Portugal wildfires. The Independent. (August 5). News/ World/Europe. Retrieved from: https://www.independent.co.uk/news/world/europe/portugal-wildfires-algarve-faro-monchique-latest-injuries-heatwave-europe-a8478066.html. [ Links ]
Boidron, J., Chatonnet, P. and Pons, M., 1988. "Influence du bois sur certaines substances odorantes des vins." Connaiss. La Vigne Du Vin. 22, 275-94. [ Links ]
Cadahía, E., Fernandez de Simón, B., et al., 2003. Volatile Compounds in Spanish, French, and American Oak Woods after Natural Seasoning and Toasting J. Agric. Food Chem. 51, 20, 5923-5932. [ Links ]
Campo, E., Ballester, J., Langlois, J., Dacremont, C. & Valentin, D., 2010. Comparison of conventional descriptive analysis and a citation frequency-based descriptive method for odor profiling: An application to Burgundy Pinot noir wines. Food Qual. Prefer. 21, 44-55. [ Links ]
Campo, E., Ferreira, V., Escudero, A. & Cacho, J., 2005. Prediction of the wine sensory properties related to grape variety from dynamic-headspace gas chromatography-olfactometry data. J. Agric. Food Chem. 53, 56825690. [ Links ]
Chatonnet, P., Dubourdie, D., Boidron, J. & Pons, M., 1992. The origin of ethylphenols in wines. J. Sci. Food Agric. 60, 165-78. [ Links ]
Coetzee, C., Brand, J., Emerton, G., Jacobson, D., Silva Ferreira, A. & Du Toit, W., 2015. Sensory interaction between 3-mercaptohexan-1-ol, 3-isobutyl-2-methoxypyrazine and oxidation-related compounds. Aus. J. Grape Wine Res. 21, 179-188. [ Links ]
Coetzee, C., Brand, J., Jacobson, D. & Du Toit, W. J., 2016. Sensory effect of acetaldehyde on the perception of 3-mercaptohexan-1-ol and 3-isobutyl-2-methoxypyrazine. Aus. J. Grape Wine Res. 22, 197-204. [ Links ]
Cox, L., 2018. Sydney's bushfire season starts in winter: We may have to rethink how we live. The Guardian International Edition, https://www.theguardian.com/cities/2018/aug/15/syd. [ Links ]
Czerny, M., Christlbauer, M., Fischer, A., Granvogl, M., Hammer, M., Hartl, C. & Hernandez, N., 2008. Re-investigation on odour thresholds of key food aroma compounds and development of an aroma language based on odour qualities of defined aqueous odorant solutions. Eur. Food Res. Techn. 228, 265-73. [ Links ]
De Vries, C. J., Buica, A., Brand, J. & Mckay, M., 2016. The impact of smoke from vegetation fires on sensory characteristics of Cabernet Sauvignon wines made from affected grapes. S. Afr. J. Enol. Vitic. 37, 22-30. [ Links ]
De Vries, C., Mokwena, L., Buica, A. & McKay, M., 2016. Determination of volatile phenols in Cabernet Sauvignon wines, made from smoke-affected grapes, by using HS-SPME GC-MS. S. Afr. J. Enol. Vitic. 37, 15-21. [ Links ]
Escudero, A., Campo, E., Farina, L., Cacho, J. & Ferreira, V., 2007. Analytical characterization of the aroma of five premium red wines. Insights into the role of odor families and the concept of fruitiness of wines. J. Agric. Food Chem. 55, 4501-4510. [ Links ]
Etievant, P. X., 1981. Volatile phenol determination in wine. J Agric Food Chem. 29, 65-67. [ Links ]
Fernandez de Simon, B., Cadahia, E., Sanz, M., Poveda, P., Perz-Margairno, P., Ortega-Heras, M. & Gonzalez-Huerta, C., 2008. Volatile compounds and sensorial characterization of wines from four Spanish denominations of origin, aged in Spanish Rebollo (Quercus pyrenaica Willd.) oak wood barrels. J Agric Food Chem. 56, 9046-9055. [ Links ]
Goldner, M., Zamora, M., Lira, P., Gianninoto, H. & Bandoni, A., 2009. Effect of ethanol level in the perception of aroma attributes and the detection of volatile compounds in red wine. J. Sens. Stud. 24, 243-257. [ Links ]
Goode, J., 2008. Burnt Rubber: The great South African wine debate. Retrieved June 26, 2018, from: http://www.wineanorak.com/blog/2008/10/burnt-rubber-great-south-african-wine.html. [ Links ]
Hammond, C.E., 2015. South African wine under fire. Retrieved June 26, 2018, from http://www.carolynevanshammond.com/blog/2015/10/12/south-african-wine-under-fire-1. [ Links ]
Hayasaka, Y., Baldock, G., Parker, M., Pardon, K., Black, C., Herderich, M., Jeffery, D., 2010. Glycosylation of smoke-derived volatile phenols in grapes as a consequence of grapevine exposure to bushfire smoke. J. Agric. Food Chem. 58, 20, 10989-10998. [ Links ]
Hein, K., Ebeler, S. & Heymann, H., 2009. Perception of fruity and vegetative aromas in red wine. J. Sens. Stud. 24, 441-455. [ Links ]
Heyns, E., 2014. The green South African palate - when does mint become eucalyptus or even downright weedy? Wineland Magazine. Retrieved June 26, 2018, from http://www.wineland.co.za/the-green-south-african-palate-when-does-mint-become-eucalyptus-or-even-downright-weedy/. [ Links ]
Ilc, T., Werck-Reichhart, D. & Navrot, N., 2016. Meta-Analysis of the core aroma components of grape and wine aroma. Front. Plant. Sci. 7 September, 1-15. [ Links ]
Jin, Y., Goulden, M.L., Faivre, N., Veraverbeke, S., Sun, F., Hall, A. & Randerson, J.T., 2015. Identification of two distinct fire regimes in Southern California: implications for economic impact and future change. Env. Res. Lett. 10, 094005. [ Links ]
Kennison, K., 2013. Effect of smoke in grape and wine production. Government of Western Australia, Department of Agriculture and Food Bulletin, Bulletin 4. [ Links ]
Kennison, K., Wilkinson, K., Pollnitz, A., Williams, H., & Gibberd, M., 2009. Effect of timing and duration of grapevine exposure to smoke on the composition and sensory properties of wine. Aus. J. Grape Wine Res. 15, 228-237. [ Links ]
Krstic, M., Johnson, D. & Herderich, M., 2015. Smoke-derived volatile phenols and their glycosidic metabolites in grapes and vines as biomarkers for smoke exposure and their role in the sensory perception of smoke taint. Aust J Grape Wine Res. 21, 537-553. [ Links ]
Lapalus, E., 2016. Linking sensory attributes to selected aroma compounds in South African Cabernet Sauvignon wines. Master's Thesis, Stellenbosch University, Private Bag X1, 7602 Matieland (Stellenbosch), South Africa. [ Links ]
Le Berre, E., Atanasova, B., Langlois, D., Etievant, P. & Thomas-Danguin, T., 2007. Impact of ethanol on the perception of wine odorant mixtures. Food Qual. Prefer. 18, 901-908. [ Links ]
Lorrain, B., Tempere, S., Iturmendi, N., Moine, V., De Revel, G. & Teissedre, P.L., 2013. Influence of phenolic compounds on the sensorial perception and volatility of red wine esters in model solution: An insight at the molecular level. Food Chem. 140, 76-82. [ Links ]
Panzeri, V., 2013. Influence of vineyard posts type on the chemical and sensorial composition of Sauvignon blanc and Merlot noir wines. Master's Thesis, Stellenbosch University, Private Bag X1, 7602 Matieland (Stellenbosch), South Africa. [ Links ]
Parker, B., Baldock, G., Hayasaka, Y., Mayr, C., Williamson, P., Francis, I. & Johnson, D., 2013. Seeing through smoke. Wine Vitic. J. 28, 42-46. [ Links ]
Parker, M., Osidacz, P., Baldock, G., Hayasaka, Y., Black, C., Pardon, K., Jeffery, D., Geue, J., Herderich, M. & Francis, I., 2012. Contribution of Several Volatile Phenols and Their Glycoconjugates to Smoke-Related Sensory Properties of Red Wine. J. Agric. Food Chem. 60, 2629-37. [ Links ]
Perez-Llamas, C. & Lopez-Bigas, N., 2011. Gitools: Analysis and visualisation of genomic data using interactive heat-maps. PLoS ONE 6, e19541. [ Links ]
Petrozziello, M., Asproudi, A., Guaita, M., Borsa, D., Motta, S., Panero, L. & Bosso, A., 2014. Influence of the matrix composition on the volatility and sensory perception of 4-ethylphenol and 4-ethylguaiacol in model wine solutions. Food Chem. 149, 197-202. [ Links ]
Prida, A. & Chatonnet, P., 2010. Impact of oak-derived compounds on olfactory perception of barrel-aged wines. Am J Enol Vitic. 50, 447-455. [ Links ]
PubChem. 2018. 2,3-Dimethylphenol C8H10O - PubChem. PubChem: Open Chemistry Database. 2018. https://pubchem.ncbi.nlm.nih.gov/compound/2_3-dimethylphenol. [ Links ]
Ristic, R., Boss, P. & Wilkinson, K., 2015. Influence of Fruit Maturity at Harvest on the Intensity of Smoke Taint in Wine. Molecules 20, 8913-8927. [ Links ]
Ristic, R., Fudge, A., Pinchbeck, K., De Bei, R., Fuentes, S., Hayasaka, Y., Tyerman, S. & Wilkinson, K., 2016. Impact of grapevine exposure to smoke on vine physiology and the composition and sensory properties of wine. Theor. Exp. Plant Phys. 28, 67-83. [ Links ]
Ristic, R., Osidacz, P., Pinchbeck, K.A., Hayasaka, Y., Fudge, A.L. & Wilkinson, K.L., 2011. The effect of winemaking techniques on the intensity of smoke taint in wine. Aus. J. Grape Wine Res. 17, 29-40. [ Links ]
Ristic, R., Van Der Hulst, L., Capone, D. & Wilkinson, K., 2017. Impact of bottle aging on smoke-tainted wines from different grape cultivars. J. Agric. Food Chem. 65, 4146-4152. [ Links ]
Romano, A., Perello, M.C., Lonvaud-Funel, A., Sicard, G. & De Revel, G., 2009. Sensory and analytical re-evaluation of 'Brett character.' Food Chem. 114, 15-19. [ Links ]
Strydom, S. & Savage, M., 2016. A spatio-temporal analysis of fires in South Africa. S. Afr. J. of Sci. 112, 1-8. [ Links ]
Tempere, S., Cuzange, E., Schaaper, M.H., De Lescar, R., De Revel, G. & Sicard, G., 2014. "Brett character" in wine: Is there a consensus among professional assessors? A perceptual and conceptual approach. Food Qual. Prefer. 34, 29-36. [ Links ]
Verschueren, K., 2001. Handbook of Environmental Data on Organic Chemicals. John Wiley & Sons, New York, USA [ Links ]
Weiss, S., 2014. The influence of grape variety on the production of volatile phenols in Portuguese wines.https://repositorio.ucp.pt/bitstream/10400.14/16238/1/Thesis_Katrin_SophieWeiss_MSc_SEFOTECH_FINAL.pdf. Accessed November 22, 2018. [ Links ]
Wilkinson, K.L., Ristic, R., Pinchbeck, K.A., Fudge, A.L., Singh, D.P., Pitt, K.M. & Herderich, M.J., 2011. Comparison of methods for the analysis of smoke related phenols and their conjugates in grapes and wine. Aus. J. Grape Wine Res. 17, S22-S28. [ Links ]
Wilson, C., Brand, J., Du Toit, W. & Buica, A. 2018. Interaction Effects of 3-Mercaptohexan-1-ol (3MH), linalool and ethyl hexanoate on the aromatic profile of South African dry Chenin blanc wine by Descriptive Analysis (DA). South African J Enol Vitic. 39, 271-283. [ Links ]
Submitted for publication: October 2018
Accepted for publication: May 2019
* Corresponding author: E-mail address: marianne@sun.ac.za; Tel.: +27-21-8083774
Acknowledgements: Prof. Martin Kidd of Stellenbosch University is acknowledged for analyzing the statistical aspects of the study. Winetech and THRIP (NRF) acknowledged funding associated with volatile phenol projects
Author disclosures: Marianne McKay, Astrid Buica and Florian Bauer conceived and designed this study; Lucky Mokwena performed the GC-MS volatile phenol analyses. Valeria Panzeri led the sensory analysis panel. Marianne McKay acquired the funding, carried out the experimental work and wrote the paper, which was revised and edited by all the authors.
ARTICLES
doi:https://doi.org/10.21548/42-2-3403
Response of Soil Chemical Properties to Irrigation with Winery Wastewater on a Well-drained Sandy Soil
A.R. MulidziI,*; C.E. ClarkeII; P.A. MyburghI
ISoil and Water Science Division, ARC Irrfruitec-Nietvoorbij, Private Bag X5026, Stellenbosch 7599, South Africa
IIDepartment of Soil Science, Stellenbosch University, Private Bag X1, Matieland 7602, South Africa
ABSTRACT
Most wineries in South Africa dispose of their wastewater through land application. This is carried out by irrigating small areas of cultivated pasture with the wastewater or ponding, with the former being the more general practice. Land application of winery wastewater results in the accumulation of potassium (K+) and sodium (Na+) in the soil and leaching of calcium (Ca2+) and magnesium (Mg2+).This could lead to long term instability of soil structure. The objective of this study was to investigate the effect of irrigation with winery wastewater on chemical soil properties and potential environmental impacts. Therefore, an existing grazing paddock at a winery near Rawsonville was selected where wastewater had been applied for many years. Due to the high volumes of wastewater irrigation plus rainfall, the inevitable over-irrigation leached large amounts of cations, particular K+ and Na+, beyond 90 cm soil depth at the selected study site. These leached elements are likely to end up in natural water resources in the long run. Irrigation with winery wastewater did not have a pronounced effect on soil pH(KCl). This was probably due to the decomposition of organic matter, and the fact that the applied salts were leached beyond 90 cm depth. The study confirmed that disposal of winery wastewater through land application can only be recommended where wastewater application will not exceed the water requirement of the crop as well as the water holding capacity of the soil which is being irrigated.
Keywords: Chemical oxygen demand, Electrical conductivity, Potassium, Sodium adsorption ratio, Soil properties, Wastewater
INTRODUCTION
The South African wine industry makes a significant contribution to the economy as well as providing employment opportunities in rural areas (Howell & Myburgh, 2018). In 2017, the Western Cape experienced the worst drought in decade and this will have a lasting effect on agricultural production for years to come (Mulidzi et al., 2018). The use and availability of wastewater for irrigation have increased globally and the disposal thereof is governed by stringent legislation (Arienzo et al., 2009). Land application of winery wastewater results in the accumulation of potassium (K+) and sodium (Na+) in the soil and leaching of Ca2+ and Mg2+ (Mulidzi et al., 2018). In South Africa, most wineries still dispose of their wastewater through land application and this is carried out by irrigating small areas of cultivated pasture with the wastewater (Mulidzi et al., 2018). Using winery wastewater within the vineyard represents a sustainable approach to minimize off-site environmental impact (Hirzel et al., 2017). The use of winery wastewater for wine grape production is increasing, and it is therefore important to understand the environmental implication of such a practice (Laurenson et al., 2012).
Although the effects of high K+ concentrations in winery wastewater used for irrigation have not yet been researched extensively, it has been suggested that irrigation with K+ rich wastewaters could be advantageous to overall soil fertility (Mosse et al., 2011). However, long term application could result in the alteration of physicochemical soil properties. Application of winery wastewater over a long time on pastures resulted in the build-up of available K+ levels that had the potential to leach into the groundwater and other water sources (Christen et al., 2010). Application of wastewater with high amounts of K+ and Mg2+ resulted in loss of soil structural stability, and reduced hydraulic conductivity (Arienzo et al., 2012). Furthermore, disposal of winery wastewater through land application can increase levels of soil soluble K+ and the exchangeable potassium percentage (EPP), since most K+ in wastewater is immediately available (Arienzo et al., 2009).
Soils with low clay content retain less K+ in the exchangeable form, while soils with higher clay content retain K+ to a greater extent (Smiles & Smith, 2004). Another study showed that application of winery wastewater with K+ and Na+ concentration of approximately 400 mg/L on pastures and woodlots resulted in accumulation of available K+ levels of 1400 mg/kg over the long term (Kumar et al., 2006). The actual amounts and the ratios between the four dominant basic cations, namely Ca2+, Mg2+, K+ and Na+, adsorbed on the soil exchange complex, are important with regard to soil chemical and physical conditions, as well as plant nutrition. Adequate K+ is, for example, important for grapevine performance and K+ deficiencies will cause low yields (Raath, 2012). On the other hand, excessive K+ levels can cause poor wine quality in terms of low acidity and poor colouring of red wines (Kodur, 2011). Although there is limited information on the effects of K+ on structure stability, it seems that high levels of exchangeable K+, similar to Na+, can increase dispersion resulting in reduced soil hydraulic conductivity and water infiltration rate (Quirck & Schofield, 1955). The exchangeable cation composition in the soil is extremely important due to the different impacts of different cations with regard to dispersion and flocculation of soil colloids. Dispersion leads to degradation of soil structure, which causes problems such as soil crusting (surface sealing) and slaking that can lead to low water infiltration rates, low hydraulic conductivity, poor aeration, poor root development and functioning (Laker, 2004).
Application of winery wastewater that contain high concentrations of dissolved organic carbon and bicarbonate cleaning products has the potential to increase soil pH when applied to land (Laurenson & Houlbrooke, 2012).
Soil pH increase is due to anion hydrolysis and decarboxylation reactions when cations such as K+, Na+, Ca2+ and Mg2+ are applied with plant materials (Yan et al., 1996; Li et al., 2008). Disposal of winery wastewater containing high levels of P can increase the concentration of dissolved P in runoff. This risk is greatest when rainfall occurs immediately after application of the wastewater (Mulidzi et al., 2009). Based on the forgoing, the objective of the study was to investigate the effect of winery wastewater irrigation on the soil chemical properties and potential environmental impacts at an existing grazing paddock at a winery near Rawsonville where wastewater had been applied for many years.
MATERIALS AND METHODS
Experiment site
The experiment was carried out at a winery near Rawsonville (-33.4137.7° 19.1920.3°) in an existing cultivated pasture grazing paddock where winery wastewater had been applied for over 15 years. A detailed description of the site was previously reported by Mulidzi (2016).
Soil characteristics
The soils around Rawsonville were formed from the alluvium of the Breede River. The soil at the site selected for the study showed no clear stratification and contained a mottled subsoil, thus qualifying it for inclusion in the Longlands soil form (Soil Classification Working Group, 1991) or a Gleyic, Albic, Arenosol (IUSS Working Group WRB, 2014). The apedal soil consisted of fine sand. The B horizon showed few fine mottles with distinct contrast and brown colour.
Experiment layout
Three 2 m χ 3 m replication plots were demarcated on the 1st of July 2010. Rain gauges were installed in each plot at a height of 0.5 m to measure the amount of wastewater applied. A two litre plastic bottle was attached to each rain gauge at the irrigation site in order to collect the overflow wastewater when the rain gauge was full. Three rain gauges were also installed outside each paddock for measuring rainfall.
Application of winery wastewater to the soils
The overhead sprinkler was connected to the main wastewater line through which the winery disposes its wastewater by irrigating kikuyu grass. The volume of wastewater applied and rainfall were recorded weekly by means of rain meters. The field measurements started on 1 March 2011, sampling of winery wastewater commenced in April 2011 and the study ended at the end of November 2013.
Wastewater sampling and analysis
Winery wastewater sampling and analysis was described by Mulidzi et al. (2018).
Soil sampling and analysis
Soil samples were collected at the study site before wastewater monitoring began in March 2011. Thereafter, samples were collected annually in May before winter rainfall commences, and in November, after the winter rainfall period. Samples were collected in 2011, 2012 and 2013. Soil was sampled at 0 to 10 cm, 10 to 20 cm, 20 to 30 cm, 30 to 60 cm and 60 to 90 cm depth increments. All soil analyses were carried out by a commercial laboratory (Bemlab, Strand). Total organic carbon content was determined using the method described by Walkley and Black (1934).
The pH was determined in a 1 M potassium chloride (KCl) suspension. The Ca2+, Mg2+, K+ and Na+ were extracted with 1 M ammonium acetate at pH 7. The cation concentrations in the extracts were determined by means of atomic emission using an optical emission spectrometer (Varian ICP-OES). For this article, the cations will be referred to as extractable calcium (Ca2+extr), magnesium (Mg2+extr), potassium (K+extr) and sodium (Na+extr). The extractable potassium percentage (EPP') was calculated as follows:

where K+extr is the extractable K+ (cmol(+)/kg) and S is the sum of the basic cations (cmol(+)/kg).
In order to get an indication of the sodicity status of the soil, the extractable sodium percentage (ESP') was calculated as follows:

where Na+extr is the extractable Na+ (cmol(+)/kg) and S is the sum of the basic cations (cmol(+)/kg).
Phosphorus was determined according to the Bray No. 2 method, i.e. extraction with 0.03 M NH,F (ammonium fluoride) in 0.01 M HCl (hydrochloric acid). The P concentration in the extract was determined by means of atomic emission as mentioned above. The soil cation exchange capacity (CEC) was determined using 0.2 M ammonium acetate (pH=7 as extractant of exchangeable cations) method as described by The Non-affiliated Soil Analyses Work Committee (1990).
Statistical procedures
The experimental design was a randomised complete block with seven sampling times randomly replicated within each of three blocks. At each sampling time, determinations were made at five soil depth intervals. Univariate analysis of variance was performed, for each depth interval separately, on all variables assessed using GLM (General Linear Models) Procedure of SAS statistical software (Version 9.2; SAS Institute Inc., Cary, NC, USA). Values for different depth intervals were also combined in a split-plot analysis of variance with depth as sub-plot factor (Snedecor, 1980). Shapiro-Wilk test was performed to test for normality (Shapiro & Wilk, 1965). Student's t-least significant difference was calculated at the 5% level to compare treatment means (Ott, 1998). A probability level of 5% was considered significant for all significance tests.
RESULTS AND DISCUSSION
Chemical composition of winery wastewater
Basic cations: It was evident that the wastewater contained high amounts of K+ and Na+ which could have a negative impact on the soil (Fig. 1A). On average, K+ levels in the wastewater were substantially higher than the levels of Na+. This indicated that the winery probably used more K+ containing detergents than Na+ based ones. The annual fluctuation in K+ and Na+ could not be related to specific seasonal activities in the winery, e.g. grape crushing or bottling. However, almost throughout the entire study period the Na+ was higher than 70 mg/L, i.e. the upper threshold for unrestricted use for sprinkler irrigation (Ayers & Westcot, 1994). The levels of Ca2+ and Mg2+ in the wastewater were substantially lower than the monovalent ions (Fig. 1B). This was to be expected, since chemicals containing Ca2+ and Mg2+ do not play a prominent role in winery processes. At these low levels the bivalent ions would not have any negative effects on soils or crops. However, the Ca2+ and Mg2+ could have some positive effect on the water quality by reducing the SAR.
SAR: In 2011, the winery wastewater SAR was frequently higher than 5, the legal limit for irrigation with wastewater as stipulated in the Department of Water Affairs (2013) General Authorisation (Fig. 1C). During the remainder of the study period, the SAR was mostly equal to, or below the legal limit. It should be noted that the wastewater SAR did not follow a distinct annual pattern that could be related to specific activities in the winery.
EC: The winery wastewater EC was below the permissible limit of 2 dS/m, as stipulated in the Department of Water Affairs (2013) General Authorisation for irrigation with wastewater, except for prominent spikes in January 2012 and June 2013 (Fig. 1D). Similar to the SAR, the EC did not follow a distinct annual pattern that could be related to specific winery activities.
Anions: Similar to the cations, the variation in levels of HCO3-, as well as SO42- and Cl- could not be related to a specific activity in the winery (Fig. 2A & B). During February and March 2013, the level of Cl" was above the recommended threshold of 150 mg/L for vineyard irrigation (Howell & Myburgh, 2013, and references therein) (Fig. 2B).
Phosphorus: Since the levels of P were generally low throughout the study period (Fig. 2B), land application of the wastewater would not make a significant contribution to the P requirements of crops.
pH: With the exception of November and December 2011, the winery wastewater pH was generally equal to or less than 6, the lower limit for wastewater irrigation as stipulated in the Department of Water Affairs (2013) General Authorisation (Fig. 2C). Annually, the pH tended to be higher in winter than during the harvest period. Since the pH was below the legal requirement for disposal through land application during these periods, it was not suitable for irrigation of crops.
COD: Throughout the study period, the winery wastewater COD was considerably higher than 400 mg/L, the upper limit for wastewater irrigation where 500 m3 of wastewater is applied per day as stipulated in the Department of Water Affairs (2013) General Authorisation (Fig. 2D). Therefore, the wastewater did not comply with the legislation for disposal through land application. Furthermore, the COD frequently exceeded 5000 mg/L, the threshold where wastewater may not be used for irrigation, or any other land application (Department of Water Affairs, 2013). Annually, the wastewater COD tended to peak during the harvest period (Fig. 2D). This confirmed that the crushing and wine making processes generated wastewater containing high levels of COD.
Iron: The fluctuation in levels of Fe could not be related to a specific seasonal activity in the winery (Fig. 3). The Fe levels were below the maximum acceptable water quality norm of 5 mg/L for continuous irrigation of grapevines most of the time (Howell & Myburgh, 2013 and references therein).
TDS: The fluctuation in levels of total dissolved solids (TDS) could not be related to a specific seasonal activity in the winery (Fig 4). However, almost throughout the study period the TDS was higher than 450 mg/L, i.e. the upper threshold for unrestricted use for irrigation (Ayers & Westcot, 1994).
Rainfall and volumes of wastewater applied
Mean monthly rainfall was typical for a Mediterranean climate (Fig. 5). However, it must be noted that the July rainfall was abnormally low in all the winters. Winter rainfall, from April to September, amounted to 380 mm, 420 mm and 685 mm in 2011, 2012 and 2013, respectively. As expected, wastewater irrigations were substantially higher in the harvest period, i.e. from February until April (Fig. 6). During the peak period, in March, c. 23 mm irrigation was applied per day. In December, the soil received only c. 3 mm wastewater per day. The irrigation volumes also increased from mid"winter to reach a second peak in August. Total irrigation applied during winter, i.e. from April to September, amounted to 1475 mm, 2600 mm and 3285 mm in 2011, 2012 and 2013, respectively. Based on the foregoing, the soil received the highest irrigation plus rainfall in the winter of 2013, followed by 2012 and then 2011.
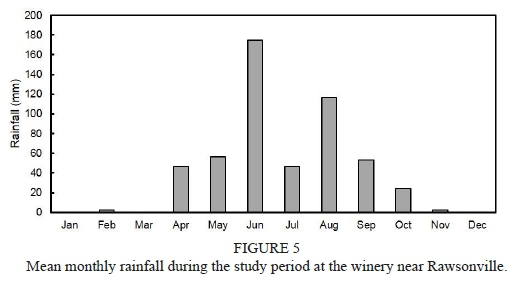
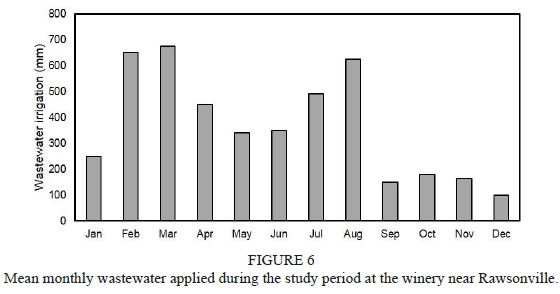
Pre-trial soil chemical status
At the start of the trial, the paddock had been irrigated for 15 years with winery wastewater. Thus the starting composition is not of a pristine soil, but that of an already affected soil (Table 1). The pre-trial composition serves as time zero for the three seasons of irrigation water applied and the chemical parameters measured. The topsoil has an extremely low clay content (3.3% ; Table 2), which will fav our a high hydraulic conductivity and rapid leaching. After continuous irrigation with winery wastewater for 15 years, the soil was acidic throughout the profile, i.e. the pH was less than 4.5 (Table 1). Soil Bray II P was high in all soil layers, i.e. more than 20 mg/kg which is considered to be the norm for sandy soils (Conradie, 1994). The basic cations declined with depth. By far the highest concentration of all cations occurred in the 0-10 cm layer (Table 1). These levels were relatively high for sandy soils (Conradie, 1994). The Ca2+extr was the dominant cation, whereas Na+extr was the lowest throughout the profile. The EPP' was relatively high in the deepest soil layers. In contrast, the ESP' was highest near the soil surface (Table 1).
Soil chemical status during the study period Organic carbon: Soil organic C in the 0-10 and 10-20 cm layers was substantially higher than 2% (Fig. 7), which is relatively high for soils of the Western Cape wine regions (Conradie, 1994). This indicated that organic matter applied via the winery wastewater had accumulated in the layers near the soil surface. Except for May 2012, when the organic C in the 0-10 cm layer showed a peak, it tended to remain constant over the two-and-a-half-year period. The sludge observed at the surface probably contributed to the exceptionally high organic carbon in the 0-10 cm layer. Furthermore, it must be noted that the organic carbon at the end of the study was comparable to the initial level at the beginning of the study in March 2011. The organic carbon in the 10-20 cm layer showed an increase until May 2012. This suggested that some of the organic matter had leached into the soil due to the high irrigation volume. The organic carbon in the 10-20 cm layer tended to remain constant from May 2012 until the end of the study period. The organic carbon in the 20-30 cm layer tended to decline following November 2011. At this stage, there is no explanation for this trend. Since the organic carbon in the deeper layers remained almost unchanged, it is unlikely that organic carbon could have leached from the 20-30 cm layer into these layers.
Potassium: The application of winery wastewater increased the K+extrlevels in the 0-10 cm layer, and to some extent in the 10-20 cm layer, at the end of the harvest periods (Fig. 8A). Despite the seasonal fluctuations, K+extr steadily increased over the three years in the first two soil layers compared to the levels at the beginning of the study. After three years of wastewater application there was no significant increase in K+extr levels deeper than 20 cm depth (Fig. 8A). Since there was little change in K+ levels with depth throughout the profile, it suggested that most of the applied K+ was leached beyond 90 cm. Due to the low clay content of the soil, the exchange complex could not retain large amounts of K+. Therefore, leaching of K+ beyond 90 cm was not inhibited. Although leaching of K+ from sandy or coarse textured soils during winter rainfall reduces the risk of accumulation and clay dispersion, it increases environmental risks such as groundwater recharge and/or lateral flow into other fresh water resources.
Sodium: Similar to K+extr, irrigation with winery wastewater increased the Na+extr levels in the 0-10 cm and in the 10-20 cm layers, at the end of the harvest periods (Fig. 8B). In May 2012, the Na+extr was also slightly higher in the 20-30 cm layer compared to the rest of the study period. Despite the seasonal fluctuations, Na+extr tended to increase slightly over the two-and-a-half-year study period in the first two soil layers compared to the levels at the beginning of the study. At the end of the study period, there was no increase in Na+extr deeper than 20 cm depth (Fig. 8B). Since there was little change in Na+extr levels with depth throughout the profile, it suggested that most of the applied Na+ was leached beyond 90 cm. Similar to K+, the low clay content of the soil could probably not retain large amounts of Na+. Therefore, leaching of Na+ beyond 90 cm was also not inhibited. Although leaching of Na+ from sandy or coarse textured soils during winter rainfall also reduces the risk of accumulation and dispersion, it poses the same environmental risks as the large amounts of K+ that were leached from the soil. High concentrations of Na+ in soil due to winery wastewater application can reduce soil aggregate stability (Laurenson & Houlbrooke, 2012). When Na+ is the predominant adsorbed cation, the clay disperses. When the soil is wet, puddling reduces permeability, and when it is dry, a hard impermeable crust forms.
Calcium: The Ca2+ _ in the 0-10 cm and 10-20 cm layers, and to a lesser extent in the 20-30 cm layer, tended to increase at the end of the harvest period (Fig. 8C). This was followed by a decline during winter. It is interesting to note that the seasonal variation in Ca2+extroccurred in the 30-60 cm layer, although the concentrations were considerably lower compared to the topsoil. A previous study showed that continuous application of winery wastewater high in K+ and Na+ could cause the soil exchange sites to be dominated by monovalent ions, thereby pushing bivalent ions such as Ca2+ and Mg2+ out of the exchange complex (Mosse et al., 2011). Consequently, the bivalent cations could be leached from the soil. However, the Ca2+extr in the deeper layers remained constant throughout the study period under the prevailing conditions. Although Ca2+ levels were generally low in the winery wastewater, it seemed that higher applications during the harvest period reflected in the Ca2+extr. Since the applied Ca2+ was substantially lower than amounts of K+ and Na+, it is unlikely that the Ca2+ would affect the EPP' or ESP' significantly. Therefore, the bivalent cations will probably not counter structural problems caused by high amounts of K+ and Na+ from the wastewater when applied to the soil.
Magnesium: The Mg2+extr in the 0-10 cm, and to a lesser extent in the 10-20 cm layer, showed the same seasonal fluctuation as the Ca2+extr (Fig. 8D). The Mg2+extr in the deeper layers remained more or less constant throughout the study period. Although Mg+ levels were generally low in the winery wastewater, it seemed that higher applications during the harvest period also reflected in the Mg2+extr. Similar to Ca2+, the low levels of Mg2+ are unlikely to counter the negative effects of high K+ and Na+ applications on EPP' or ESP', and consequently on soil physical conditions.
EPP': With the exception of the 0-10 cm layer, the EPP' tended to be lower at the end of the harvest period, followed by an increase during winter (Fig. 9A). This result is somewhat unexpected, since the higher EPP' did not correspond with the higher K+ applications which caused higher K+extr in the soil (Fig.8A). Although substantially more K+ than Ca2+ was applied via the wastewater, Ca2+ was the dominant cation in all the soil layers, except in November 2013 when the Ca2+extr levels were comparable to the other extractable cations in the deeper layers (Fig. 10). The source of the Ca2+ was probably lime that was added to the wastewater in order to increase the pH as part of the wastewater treatment carried out by the winery. Routine use of Ca2+ amendments including, yet not restricted to lime, gypsum and calcium nitrate, either added directly to wastewater or to soils will enable Ca2+ exchange and displacement of Na+ and K+. Winter application of Ca2+ amendments will ensure its percolation down the soil profile, thereby ensuring good distribution of Ca2+ (Laurenson & Houlbrooke, 2012). Quantification of this practice was beyond the scope of the study. In November 2013, the winery probably reduced, or stopped the lime application, which caused the low soil Ca2+extr. Based on the foregoing, it seemed that high levels of Ca2+extr at the end of the harvest dominated the exchange complex to such an extent that the EPP' was reduced compared to the winter when the Ca2+extr was lower. The high EPP' in November 2013 was due to the low Ca2+extr. These results also suggested that the large amounts of applied K+via the winery wastewater were not preferentially absorbed onto the exchange sites.
ESP': Although the Na+extrrshowed some seasonal fluctuations, it did not reflect in the ESP' (Fig. 9B). The lack of seasonal fluctuations in ESP' was probably due to the dominance of Ca2+extr, and to some extent K+extr. It was previously reported that the adsorption of Na+ on soils similar to the Longlands soil was reduced by the presence of high levels of K+ after winery wastewater irrigation (Mulidzi et al., 2016).
High soil ESP' increases the risk of soil physical properties to deteriorate through clay dispersion which will lead to structural breakdown and blockage of soil pores and reduced soil permeability (Bond, 1998). However, since the ESP' was relatively low, it would probably not have caused serious soil physical deterioration.
ECe: The salt content remained constant to a depth of 60 cm until May 2012, during which time the ECe in the 60-90 cm layer tended to incline steadily (Fig. 9C). Following the winter of 2012, ECe in the deepest two soil layers declined. A similar trend also occurred in the winter of 2013. This could also have been a result of groundwater movement in the bottom of the profile. In fact, ECe in all layers tended to be lower following May 2013. These results indicated that the high irrigation plus rainfall must have leached some of the salts applied via the winery wastewater irrigation beyond 90 cm depth, particularly in the last two winters.
pH(KCl): Irrigation with winery wastewater slightly increased the soil pH(KCl) until May 2012 (Fig. 9D). In November 2012, the soil pH(KCl) showed a decrease and tended to remain constant until November 2013. Variation in soil pH(KCl) was not related to variation in monovalent cations (data not shown). However, addition of organic acids from winery wastewater could be associated with the decrease of soil pH due to H+ dissociation from carboxyl functional groups (Rukshana et al., 2012). While the soil pH increase could be associated with high concentration of total alkalinity in wastewater that contains bicarbonate ions, as well as deprotonated organic acids, the charge of these ions are countered by cations. When applied to soils, it increases the pH due to anion hydrolysis reactions and decarboxylation (Li et al., 2008). It is important to note that the soil was too acidic for viticulture, i.e. pH less than 5.5 (Conradie, 1994).
Phosphorus: The soil P fluctuations appeared to be erratic (Fig. 11). At certain times, the P in the topsoil tended to increase, whereas the subsoil P tended to decline and vice versa. Therefore, it seemed that leaching of P into the subsoil occurred, which coincided with P losses from the topsoil. This was illustrated more clearly when the means for the topsoil (0-30 cm depth) and subsoil (30-90 cm depth) were plotted over time (Fig. 12). It seemed that the increase in subsoil P lagged behind P increases in the topsoil up till November 2012. Following this, top and subsoil fluctuations coincided until November 2013. The high rainfall and irrigation before May 2013 probably caused leaching of P throughout the soil profile. However, this does not rule out the possibility that the low pH reduced the solubility of the P.
The soil P content was substantially higher than the minimum requirement recommended by Conradie (1994) for vineyards (Fig. 11). It must be noted that leaching of high levels of P into groundwater, as well as other fresh water sources close to the winery, could cause serious environmental problems, e.g. eutrophication. Due to the sandy nature of the soil, i.e. 3.3% clay, and low Fe content, it does not have adequate P adsorbing capacity (Samadi, 2006). This would increase the risk of excessive P leaching from the soil.
CONCLUSIONS
It is important to note that the study represented the worst-case scenario, i.e. the winery wastewater disposal was carried out in a small paddock. Due to the high volumes of wastewater irrigation plus rainfall, the inevitable over-irrigation leached large amounts of cations, particular K+ and Na+, beyond 90 cm depth in the Longlands soil. These leached elements are bound to end up in natural water resources in the long run.
Irrigation with the winery wastewater did not have a pronounced effect on soil pH(KCl). The study confirmed that injudicious irrigation with untreated winery wastewater poses a serious environmental hazard, particularly where crops in sandy soils are irrigated. Due to the risks involved as discussed above, disposal of winery wastewater by means of over-irrigation is definitely not the ultimate solution to the problem. Land disposal can only be recommended where the wastewater application does not exceed the water requirement of the grazing crop, or any other agricultural crop. Wastewater application according to the K+ requirement of the crop is also crucial. This means that the wastewater needs to be distributed on an area of land that is big enough so that the daily applications do not cause overirrigation. Therefore, sound wastewater management can only be achieved by means of irrigation scheduling based on frequent soil water content measurements. Care should be taken that the irrigation water does not leach beyond the root zone. The soil chemical status should be monitored at least annually. Depending on the type of soil and quality of wastewater, each winery will need to determine the size of land needed for irrigation with their winery wastewater. The effects of K:Na ratio in diluted or undiluted winery wastewater on soil structure stability, K+ availability and leaching of elements also need to be addressed by continued research. Since the climate, particularly rainfall, will affect the accumulation and/or leaching of elements, it is important that research regarding the effect of wastewater irrigation on soil properties is carried out in field studies in different climatic zones.
LITERATURE CITED
Arienzo, M., Christen, E.W., Jayawardane, N.S. & Quayle W.C. 2012. The relative effects of sodium and potassium on soil hydraulic conductivity and implications for winery wastewater management. Geoderma 173, 303-310. [ Links ]
Arienzo, M., Christen, E.W., Quayle, W. & Kumar, A. 2009. A review of the fate of potassium in the soil-plant system after land application of wastewaters. J. Hazard. Mater. 164, 415-422. [ Links ]
Ayers, R.S. & Westcot, D.W. 1994. Water quality for agriculture. FAO irrigation and drainage paper no 29. FAO, Rome. [ Links ]
Bond, W.J. 1998. Effluent irrigation - an environmental challenge for soil science. Aus. J.Soil Res. 36, 543-555. [ Links ]
Christen, E.W., Quayle, W.C., Marcoux, M.A., Arienzo, M. & Jayawardane, N.S. 2010. Winery wastewater treatment using the land filter technique. J. Environ. Manage. 91, 1665-1673. [ Links ]
Conradie, W.J. 1994. Vineyard fertilisation. Proceedings of workshop on vineyard fertilization. Nietvoorbij, 30 September 1994. ARC Infruitec-Nietvoorbij, Private Bag X5026, 7599 Stellenbosch, South Africa. [ Links ]
Department of Water Affairs. 2013. Revision of general authorizations in terms of Section 38 & 39 of the National Water Act, 1998 (Act No. 36 of 1998), No. 665. Government Gazette No. 36820, Dept. Water Affairs, Pretoria, South Africa. pp. 3-31. [ Links ]
Hirzel, D.R., Steenwerth, K., Parikh, S.J. & Oberholster, A. 2017. Impact of winery wastewater irrigation on soil, grape and wine composition. Agr. Water Manage. 180, 178-189. [ Links ]
Howell, C.L. & Myburgh, P.A. 2013. Permissible element concentrations in water used for grapevine irrigation (Part 2). Anions, trace elements and heavy metals. Wynboer Technical Yearbook. 2013, 59-61. [ Links ]
Howell, C.L. & Myburgh, P.A. 2018. Management of winery wastewater by re-using it for crop irrigation - A review. S. Afr. J. Enol. Vitic. 36, 116-131. [ Links ]
IUSS Working Group WRB. 2014. World Reference Base for Soil Resources. International classification system for naming soils and creating legends for soil maps. World Soil Resources Reports No.106. FAO, Rome. [ Links ]
Kodur, S. 2011. Effects ofjuice pH and potassium on juice and wine quality, and regulation of potassium in grapevines through rootstocks: A short review. Vitis 1, 1-6. [ Links ]
Kumar, A., Saison, C., Grocke, S., Doan, H., Correl, R. & Kookana, R., 2006. Impact of winery wastewater on ecosystem health-an introductory assessment. Report CSL02/03. Grape and Wine Research Development Corporation/CSIRO Land and Water Science, Adelaide, Australia. [ Links ]
Laker, M.C. 2004. Advances in soil erosion, soil conservation, land suitability evaluation and land use planning research in South Africa. S. Afr. J. Plant Soil 21, 345-368. [ Links ]
Laurenson, S., Bolan, N.S., Smith, E. & McCarthy, M. 2012. Review: Use of recycled wastewater for irrigating grapevines. Aust. J. Grape Wine Res. 18, 1-10. [ Links ]
Laurenson, S. & Houlbrooke, D. 2012. Review of guidelines for the management of winery wastewater and grape marc. Report prepared for Marlborough District Council. Agresearch, 1-26. [ Links ]
Li, Z.A., Zou, B., Xia, H.P., Ding, Y.Z., Tan, W.N. & Fu, S.L. 2008. Role of low-molecule-weight organic acids and their salts in regulating soil pH. Pedosphere 18, 137-148. [ Links ]
Mosse, K.P.M., Patti, A.F., Christen, E.W. & Cavagnaro, T.R. 2011. Review: Winery wastewater quality and treatment options in Australia. Aus. J. Grape Wine Res. 17, 111-122. [ Links ]
Mulidzi, A.R. 2016. The effect of winery wastewater irrigation on the properties of selected soils from the South African wine region. Dissertation, Stellenbosch University, Private Bag X1, 7602 Matieland (Stellenbosch), South Africa. [ Links ]
Mulidzi, A.R., Clarke, C.E. & Myburgh, P.A. 2016. Design of a pot experiment to study the effect of irrigation with diluted winery wastewater on four differently textured soils. Water SA 42, 20-25. [ Links ]
Mulidzi, A.R., Clarke, C.E. & Myburgh, P.A. 2018. Annual dynamics of winery wastewater volumes and quality and the impact of disposal on poorly drained duplex soils. S. Afr. J. Enol Vitic. 39, 305-314. [ Links ]
Mulidzi, R., Laker, G., Wooldridge, J. 2009. Composition of effluents from wineries in the Western and Northern Cape provinces (Part 2): Impacts on soil and the environment. Wynboer Technical Year book. 62-68. [ Links ]
Ott, R.L. 1998. An Introduction to Statistical methods and data analysis. Belmont, California, Duxbury Press, 807-837. [ Links ]
Quirck, J.P., Schofield, R.K. 1955. The effect of electrolyte concentration on soil permeability. J. Soil Sci. 6, 163-178. [ Links ]
Raath, P.J. 2012. Effect of varying levels of nitrogen, potassium and calcium nutrition on table grape vine physiology and berry quality. Dissertation, Stellenbosch University, Private Bag X1, 7602 Matieland, South Africa. [ Links ]
Rukshana, F., Butterly, C.R., Baldock, J.A. & Xu, J.M., Tang, C. 2012. Model organic compounds differ in priming effects on alkalinity release in soils through carbon and nitrogen mineralisation. Soil Biol. Biochem. 51, 35-43. [ Links ]
Samadi, A. 2006. Temporal changes in available phosphorus in some calcareous soils. J. Agr. Sci. Technol. 8, 343-349. [ Links ]
Shapiro, S.S., Wilk, M.B. 1965. An analysis of variance test for normality (complete samples), Biometrika 52, 591-611. [ Links ]
Smiles, D.E. & Smith, C.J. 2004. A survey of the cation content of piggery effluents and some consequences of their use to irrigate soils. Aus. J. Soil Res. 42, 231-246. [ Links ]
Snedecor, G.W. & Cochran, W.G. 1980. Statistical Methods, 7th Edition, The Iowa State University Press, Ames. [ Links ]
Soil Classification Working Group, 1991. Soil classification - A taxonomic system for South Africa. Memoirs on the Agricultural Natural Resources of South Africa no. 15. Department of Agricultural Development, Pretoria, South Africa. [ Links ]
The Non-Affiliated Soil Analyses Work Committee. 1990. Handbook of standard soil testing methods for advisory purposes. Soil Sci. Soc. S.A., P.O. Box 30030, Sunnyside, Pretoria. [ Links ]
Walkley, A., Black, I.A. 1934. An examination of Degtjareff method for determining soil organic matter and a proposed modification of the chromic acid titration method. Soil Sci. 37, 29-37. [ Links ]
Yan, F., Schubert, S. & Mengel, K. 1996. Soil pH increase due to biological decarboxylation of organic anions. Soil Biol. Biochem. 28, 617-624. [ Links ]
Submitted for publication: March 2019
Accepted for publication: June 2019
* Corresponding author: E-mail address: mulidzir@arc.agric.za
Acknowledgements: The Water Research Commission for initiating and funding the project. Winetech, THRIP (TP1208066038) and Agricultural Research Council for co-funding. Staff of Soil and Water Science at ARC Infruitec-Nietvoorbij for technical support, and in particular Mr Francois Baron for his dedicated effort. Any opinions, findings and conclusions or recommendations expressed in any publication generated through THRIP-supported research, are those of the authors and therefore the NRF/THRIP will not accept any liability in that regard
ARTICLES
doi:http://dx.doi.org/io.2i548/40-2-2770
Effects of Different Harvest Times on the Maturity of Polyphenols in Two Red Wine Grape Cultivars (Vitis vinifera L.) in Qingtongxia (China)
Y. ZhouI; P. SuI; H. YinI; Z.dongI; L YangI; C. YuanI, II
ICollege of Enology, Northwest A&F University, No. 22 Xinong Rd., Yangling 712100, Shaanxi, China
IIShaanxi Engineering Research Center for Viti-Viniculture, Yangling 712100, China
ABSTRACT
Due to the special climate conditions in the Qingtongxia region, grapes are high in sugar and low in titratable acidity from the stages of ripening. Therefore, the common methods used for determining the maturity of grapes, which depend on the ratio of sugar and titratable acidity in other regions, are inappropriate in Qingtongxia. This research was done in order to seek for a simple and convenient method of determining the optimal harvest time of grapes, further providing some theoretical basis for improving the quality of wine in Qingtongxia. Phenolic contents and some basic physico-chemical parameters of Merlot and Pinot Noir were evaluated during different ripening stages. The results showed that a different harvest time significantly affects the phenolic contents and physico-chemical parameters of Merlot and Pinot Noir. The total contents of anthocyanins in skins and total contents of phenolic in seeds was screen out as two important indexes to evaluate the maturity of polyphenols, in order to better improve the quality of grape and wine.
Key words: Phenolic, ripening, monomer anthocyanins, wines, harvest time
INTRODUCTION
Grapes are cultivated globally, and the quality of the grape is a key factor for the quality of the wines, and the grape maturity significantly affects the quality of grape, thus it is vital to determine appropriate grape maturity during ripening (Kontoudakis et αl, 2011; Myunghee et αl, 2014; Magarino and José, 2006; Magarino and José, 2013). However, the optimal harvest time is controlled by endogenous numbers and environmental factors including varieties, viticultural technologies, soil, climatic characteristics as well as maturity of grapes (Chira et αl, 2009; Condurso et αl, 2016; Cook and Wolkovich, 2016; Myunghee et αϊ, 2014).
Total soluble solids (°Brix) and titratable acidity, apart from phenolic content, are the best parameters to use in in the evaluation of grape quality (Conde et αl, 2006; Kontoudakis et αϊ, 2011; Ribera-Fonseca et αl, 2016; Urraca et αϊ, 2015). However, the content of reduced sugar could not guarantee the best quality of grapes and wines (Conde et αϊ, 2006). The maturity of phenolic, namely 'phenolic maturity' in grapes at harvest time is one of the main factors that affect the quality of the wine (Kontoudakis et αl, 2011; Magarino and José, 2006; Rajha et αl, 2017). Phenolic compounds are large and complex compounds, which are mainly present in skins and seeds (Obreque-Slier et αl, 2010). According to the chemical structure, phenolic compounds can be divided into two groups: flavonoids (flavonols, anthocyanins, flavan-3-ols) and non-flavonoids (cinnamic acid, stilbenes). Therefore, the content of phenolic compounds are the most important quality parameters of grapes and wines (Gil et αl, 2012; Lasanta et αl, 2014). There was also significant evidence of phenolic compounds affecting the quality of wines and the organoleptic properties, such as the skeleton, structure, colour, the character and quality of wines (Chira et αl, 2009; Conde et αl, 2006; Garrido and Borges, 2011; Hufnagel and Hofmann, 2008; Marti et αl, 2015). However, factors including climate, soil, variety, growth condition, the winemaking process and stages of ripeness affect the content of phenolic compounds (Canals et αϊ, 2005; Cook and Wolkovich, 2016; Intrieri et αl, 2010; Jin et αl, 2009; Mattivi et αϊ, 2009; Obreque-Slier et αl, 2010; Obreque-Slier et αϊ, 2013; Romerocascales et αl, 2005; Vilanova et αϊ, 2010). O-Marques et al. (2005) found that ripeness strongly influences the phenolic composition of grape and wines. Previous research reported that insufficiently ripened grapes have a lower extractability of anthocyanins and proanthocyanidins from skins and a higher extractability of proanthocyanidins from seeds, which may produce more astringent and bitter wines (Canals et αl, 2005; Peyrot and Kennedy, 2003). However, there is little information available regarding the relationship between the local climatic conditions and phenolic maturity (Sadras and Moran, 2012), especially in Northwest China.
Currently, the Northwest wine region of China is popular, and the Qingtongxia wine region is a very important part of it.lt is located in arid and semi-arid areas with ideal weather conditions for the growth of grapes, with reasonable light and moderate temperature throughout the year. The soil is mainly sand gravel and grey calcareous clay. Moreover, it belongs to the Yellow River irrigation area, which also makes a big difference. A lot of famous red wine grape varieties including Cabernet Sauvignon, Merlot, and Pinot Noir are cultivated in Qingtongxia. Research has found that the harvest time is strongly related to the kind of wine to be made. In the Qingtongxia region, most of the grapes are used to make aged red wines. Series of studies have reported the relationship between the harvest time of grapes and the quality of wines, which provided a united method to judge the optimal harvest time. However, for the special climatic conditions in Northwest China (Li. et al., 2011), the grapes are affected by several special factors in the process of maturation, with high reducing sugar and low acidity. Few studies have focused on a standard for ensuring the appropriate maturity of grapes in China. The confirmation of the relationship among these factors provided insight into production in this locality. The aim of this study was to find a new way to guide the production practice in the Qingtongxia region. Furthermore, we studied the changes of phenolic compounds in the two red wine grapes during maturation in the years of 2014 and 2015, to determine the optimal harvest time of Pinot Noir and Merlot in Qingtongxia.
MATERIALS AND METHODS
Experimental design and sample collection
Pinot Noir and Merlot (Vitis vinifera L. cv.) grape berries were sampled from the experimental vineyard belonging to Yuma in Qingtongxia, Ningxia, China (38.02' N, 106.07' E), at different ripeness stages during 2014 and 2015 vintages. In 2014 and 2015, the highest temperature in Qingtongxia was 35.8°C and 35.7°C, with an average annual temperature of 10.3°C and 10.1°C (lower than the national average of 14.4°C and 14.6°C). An annual total precipitation of 178.5 mm and 184.6 mm was found (lower than the national average of 913.6 mm and 1011.6 mm), an annual total sunshine duration of 3086.1 h and 3181.7 h (higher than national average of 1991.9 h and 2408.2 h), and lastly, an annual average wind speed of 1.9 m/s and 2 m/s, respectively (data from Ningxia statistical yearbook of 2014 and 2015). Pinot Noir and Merlot were planted in 2002. The vines were spaced 1.0 m in row and 3.0 m between the rows, which were oriented in the North-South direction.
The grapes were harvested at five levels of ripeness, and the first harvest was one week after veraison. The second to fifth harvests were carried out every week form two to five weeks after veraison. The experimental design used the 'Z' method to gather samples. Each sample consisted of 300 berries randomly collected in terms of sun exposure and backlight, the inside and the outside of the cluster, the top, the bottom, and the middle of the cluster. Moreover, it was done one day a week from the beginning of ripeness until harvest. In the last three sampling times, we have harvested another sample of grapes (20 kg) used for making wines.
These samples were stored at -20°C before use.
Phenolic compounds of grapes in skins and seeds were extracted according to the methods proposed by Di et al. (1991), with minor modifications. They were comprised three independent replicates and each replicate consisted of 30 berries, of which grape skins and seeds were carefully removed using razor blades. Then water and residue on the surface of the grapes were removed and weighed. It was added to 30 mL of buffer solution (12% (v/v) ethanol + 600 mg/L sodium metabisulfite + 5 g/L tartaric acid, 1 Μ NaOH to adjust pH to 3.20), and put in a swing bed (100 r/min, 25°C). Extraction took place for three days, finally collecting the supernatant, which was also placed in -20°C stored away from light before use.
Determination of the physicochemical indexes of grape berry
Grape juice was collected and used for assaying reducing sugar and titratable acids, which were analysed according to the methods proposed by OIV (2012).
The tests for total phenolic content (TPC) and total tannin content (TTC) were performed as described by Harbertson et al. (2003) with minor modifications. All buffer solutions were prepared before the experiment. Buffer A was the washing buffer of 200 mM acetic acid and 170 mM sodium chloride, pH adjusted to 4.9 with sodium hydroxide. Buffer Β was a model wine (5.0 g/L potassium bitartrate and 12% (v/v) ethanol, pH adjusted to 3.3 with HCl). Buffer C was a resuspension buffer consisting of 5% (v/v) triethanolamine and 5% (w/v) sodium dodecyl sulfate, pH adjusted to 9.4 with HCl. The ferric chloride reagent was 0.01 Μ HCl and 10 mM ferric chloride.
For TTC determination, a protein solution for tannin precipitation was prepared by dissolving Bovine serum albumin (BSA) into buffer A, in order to give a final protein concentration of 1.0 mg/mL. The skin extract was diluted with buffer B, 1.0 mL of the protein solution and 500 liL diluted extract of sample A in a 1.5 mL microfuge tube. After being incubated for 15 minutes with slow agitation at room temperature, the mixture was centrifuged at 14,000 g for 5 minutes at 4°C. After the supernatant was poured out, the residue was washed with buffer A three times and then resolubilised in 875 μLof buffer C. The absorbance of the ferric chloride reagent was added and shaken for 10 minutes. The absorbance of the solution was read at 510 nm for tannin background 04J10). Then, 125 μL of the ferric chloride reagent was added and shook for 10 minutes. The solution was read at 510 nm for tannin final (A510). Buffer C was used as ablank and read at 510 nm for tannin initial 04J10). After the incubation period, the absorbance at 510 nm was determined in Shimadzu 640 spectrophotometer using the TEA buffer as a blank. TTC values are reported in catechin equivalents (C.E.) as described here (Harbertson et al., 2003).
For TPC, 20.0 μL of wine sample and 855 μL of buffer C were mixed. After incubated for 10 minutes, the mixture was read at 510 nm (total phenolic background A510). Then, 855 μL of ferric chloride reagent was added into the reaction system. The absorbance was read at 510 nm (total phenolic final Λ510). TPC values are reported in catechin equivalents (CE.) as described bewlow.
The absorbance for TTC = [(tannin final. A510)-(tannin initial A510)\ - (tannin background A ) χ 0.875. The absorbance for TPC = [(total phenolic final A510)-(tannin initial A510)] - (total phenolic background. 1 ) x 0.875.
Total flavonoid content (TFC) was determined according to the method of Peinado et al. (2009) with minor modification. In a centrifuge tube, 0.2 mL of grape extract was added, then, methyl alcohol up until 1.0 mL, then. 2.7 mL 30% methyl alcohol, 0.3 mL of NaNO, (0.5 M) and 0.3 mL of A1C1, (0.3 M) in this sequence. After 5 minutes, 1.0 mL of NaOH (1.0 M) was added to the reaction system. The absorbance was measured against the blank at 510 nm. Results were expressed as rutin equivalents (RE).
Total anthocyanin content (TAC) was estimated using the pH differential method with minor modification (Lee et al.. 2005). Each grape and wine extract was diluted 40 times with buffers at pH 1.0 and 4.5 to attain the same dilution. The absorbance was measured at 520 and 700 nm in both pH 1.0 and 4.5 buffers. The TAC (expressed in terms of cyanidin-3-glucoside) was calculated using the following formula:
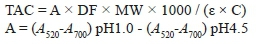
where MW is the molecular weight of cyanidin-3-glucoside (449 g/mol), DF is the dilution factor, ε is the molar extinction coefficient of cyanidin-3-O-glucoside (29,600), and C is the concentration of extracted volume.
Total flavanol content was determined according to the method of Li et al. (1996) with minor modification. The grape extract of skins and seeds, including the skin grape extract undiluted and the seed grape extract diluted 5 times, was added with 0.2 mL of grape extract to the centrifuge tube respectively. Then, mixed with 3 mLp-DMACA solution, after 10 minutes, the absorbance was measured at 640 nm. Results were expressed as catechin equivalents (CE).
Determination the content of monomer anthocyanins
The chromatographic analyses of anthocyanins were performed using LC-20AT HPLC system (Shimadzu Corporation) equipped with a reversed phase column (Synergi Hydro-RP C18, 250 χ 4.6 mm, 4 μm). The mobile phase was ultrapure water, acetonitrile and methanoic acid (800:100:25) as solvent A; and ultrapure water, acetonitrile and methanoic acid (400:500:25) as solvent B. The elution profile had the following proportions (v/v) of solvent B: 0.00-15 min, 0%-10%; 15-30 min, 10%-20%; 30-45 min, 20-35%; 45-46 min, 35%-100%; 46.00-50.00 min, 100%. The column was held at 35°C and was flushed at a flow rate of 1 mL/min. The injection volume was 20 μί and analyses were detected at 520 nm.
All phenolic compounds were identified by comparison of their order of elution and retention time with those of standards and the weight of molecular ion, and the fragment ion compared to standards and references. Quantitative determinations were made by using the external standard method compared to the commercial standards. The calibration curves were obtained by injection of standard solutions under the same conditions of the samples analysed. Anthocyanins and flavan-3-ols were expressed respectively as micrograms of malvidin-3-O-glucoside (ME) and catechin equivalence (CE)/L of grape skins.
Sensory analysis of wines
The last three samples were used for making wines. A sensory tasting team was created, made up of 12 people who were trained wine panelists from the College of Enology. Northwest A & F University (7 females and 5 males, 23-28 years of age). Appearance, aroma, flavor and the overall balance were evaluated according to the tasting table. Finally, statistical analysis was based on the tasting table.
Statistics analysis
Data were reported as mean ± standard deviation (SD) values of the triplicate experiments and were analysed using SPSS 24.0 software (IBM Corporation, Armonk, NY, USA). Oneway analysis of variance (ANOVA) and Duncan's multiple range tests (MRT) were used to determine the significance of differences among the means at each sampling time at the significance level of 0.05. The figures were drawn using the Microsoft Excel 2010.
RESULTS AND DISCUSSION
The basic indexes of grapes
Indexes such as 100 berries' weight, pH and soluble solids content (SSC) are defined as the technological ripeness of grapes. Table 1 and Table 2 shows the basic indexes of Merlot and Pinot Noir respectively. As expected, most of these indexes presented a rising trend during ripening and showed significant differences between one another (p<0.05). The two tables also showed that the 100 berries' weight presented rising trends at first, and then turned into a downtrend (p<0.05). The SSC, reducing sugar, TA (titratable acidity) and sugar/TA ratio increased regularly during ripening and there was a significant difference among them (p<0.05). These changes kept in line with what Nedomová et al. (2017) previously reported. However, a special phenomenon was that the content of sugar was higher than the standard level, while the content of TA was lower than the standard level during grape ripening, which was different from other reports. It has been found that the climatic characteristics have an innate impact on the harvest time and the quality of the grape, and it can also determine the particular style of the wines in local areas (Cook and Wolkovich, 2016). We inferred that this special phenomenon is caused by the local climate.
The content of reducing sugar varied from 154.62±2.76 g/L, 182.17±0.76 g/L to 235.15±2.73 g/L, 238.87±1.13 g/L; the sugar/TA varied from 16.94±0.51, 19.82±0.31 to 40.30±1.36, 42.67±0.99; the content of SSC varied from 16.27±0.15°Brix, 19.07±0.12 °Brix to 22.20±0.001 °Brix. 24.03±0.05 °Brix, and pH varied from 3.14±0.01.3.24±0.01 to 3.42±0.01. 3.73±0.01 in the grapes of Merlot, both in 2014 and 2015 respectively.
The content of reducing sugar varied from 143.65±3.10 g/L, 179.57±0.74 g/L to 232.0±0.01 g/L, 240.38±0.66 g/L; the sugar/TA varied from 13.48±0.18, 17.94±0.15 to 28.89±0.01, 33.47±0.42; the content of SSC varied from 15.67±0.42 °Brix, 18.45±0.38 °Brix to 22.13±0.06 °Brix. 24.35±0.26 °Brix, and pH varied from 3.13±0.01.3.11±0.02 to 3.42±0.01. 3.61±0.01 in the grapes of Pinot Noir in 2014 and 2015 respectively. The reducing sugars were slightly higher than that of other wine regions and the TA was seriously under the normal standard level. This phenomenon is common in Northwest China, while it is detrimental to the grape production. Furthermore, the phenomenon influences the quality of wines to some extent (Mota et al, 2011). Therefore, increasing the content of TA becomes a crucial technology during vinification. However, there is very little research available about the factors influenced by the harvest time in Northwest China.
According to the OIV, grapes are considered to be ripened when SSC reached the content of 220.00 g/L. However, as can be seen in Table 1 and Table 2, between three and four weeks after veraison, the SSC content did not show significant difference and reached above of 220.00 g/L both for Merlot and Pinot Noir. Therefore, it was difficult to determine the certain harvest time in Northwest China. Meanwhile, due to more sunlight (262.9 h and 316.2 h in August of 2014 and 2015, respectively) and less rainfall (45.9 mm and 19.9 mm in August of 2014 and 2015. respectively) during the early ripening in 2015 compared with 2014, higher levels of the basic indexes was found in 2015 than in 2014. However, the relationship between the maturity of polyphenols and the harvest time has not been fully elucidated in Northwest China. Therefore, we concluded that not only the basic indexes should be considered (SSC. reducing sugar and sugar/TA), but also other factors, such as phenolic compounds that affect the quality of wines (Ribera-Fonseca et al, 2016), when determining the most appropriate harvest time.
Notes: SSC: soluble solids content, TA: titratable acidity. Each value represents mean of three replicates ± SD (standard deviation). Different letters (a, b, c, d) within the same row for each sampling time indicate significant difference at P<0.05 by Duncan's multiple range test.
Phenolic compounds of grape berries
Total contents of polyphenols in the skins and seeds of grapes were determined in Merlot and Pinot Noir at different ripening degrees. As can be seen from Tables 3,4 and Figures 1, 2, 3 and 4, the different stages of maturity significantly influenced the content of phenolic compounds from different parts.
As shown in Table 3,4 and Figure 1,2,3 and 4, the content of phenolic compounds reached the maximum five weeks after veraison in 2014. However, the content of phenolic compounds attained the maximum three weeks after veraison in 2015. Generally, the content of phenolic compounds in the skins of grapes showed a rising trend during ripening, while these showed a downtrend in the seeds of grapes. However, the content of phenolic compounds showed a similar trend both in skins and seeds of grapes during ripening (Table 3 and 4) five weeks after veraison in 2014. In 2015, three weeks after veraison the content of phenolic compounds were higher compared to before or after this stage. The content of total phenolic compounds, the anthocyanin and the flavonoids in the skins were significantly higher during ripening (Allegro et al., 2016; Fournand et al., 2006). The content of phenolic compounds in the skins of grapes were significantly influenced by the sampling time. Similarity, the total phenolic contents, the anthocyanin and the flavonoids in the seeds showed a downtrend in the continuous two years, entirely. In 2015, the content of total phenolic compounds reached the highest value (69.34Ü.43 mg/g). the content of anthocyanin reached 7.80±0.14 mg/g on August 28 in the skins of Pinot Noir. In Merlot, the content of total phenolic compounds reached the highest value (32.52±0.76 mg/g) in the skins and in the seeds (77.95±2.30 mg/g) after three and five weeks of veraison, respectively. Furthermore, these indexes showed a higher level in 2015 than in 2014. This might be related to the local climate characterised by more rainfall during ripening in 2014, which would result in the decreased biosynthesis of phenolic compounds. Our results relate well to this trend (Gil et al., 2012; Li et al., 2014; Lorrain et al., 1991).
According to the content of phenolic compounds, including the phenolic compounds in the skins and in the seeds, optimal harvest time could be performed five weeks after veraison in 2014 and three weeks after veraison in 2015. Tt this time the quality of grapes and wines was best, and parts of the sensory analysis of the wines also confirmed the conclusion. A series of literature reported that the content of phenolic compounds and the maturity of the grape have a significant correlation (Bordiga et al, 2011; Obreque-Slier et al, 2013).
Table 3 and 4 showed the content of phenolic compounds, which were medium compared to other wine grape cultivars from different regions (Li. et al., 2011). Principal component analysis (PCA) and correlation analysis displayed that when reducing sugar-acid ratio in order to reach the requirements of harvest, the contents of anthocyanins in skins and the total content of phenolic compounds in seeds were vital for the quality of grapes and wines (Chira et al., 2009; Hernándezhierro et al., 2014).
Determination of the content of monomer anthocyanins in wines
The anthocyanins in wine are mainly macerated from the peel of grapes, which is crucial for the colour of wines (Bindon et al, 2013; Gil et al, 2012; Magarino and José. 2006; Magarino and José, 2013; Romerocascales et al. 2005). Table 5 and 6 showed the kinds and contents of monomer anthocyanins at different sampling times in Pinot Noir and Merlot. Five kinds of non-acylated anthocyanins were detected in Pinot Noir at different harvest times, and five kinds of non-acylated anthocyanins and four kinds of acylation anthocyanins were detected in Merlot. The anthocyanin content was 63.99%~71.41% in wines. During ripening, there was a variation of monomer anthocyanins in the skins of Pinot Noir and Merlot, which was a significant difference (p<().05). In 2014, the content of monomer anthocyanins reached a maximum in the wines of Pinot Noir and Merlot five weeks after veraison, however, these kinds of phenomenon appeared after three weeks of the veraison in 2015. Nine kinds of monomer anthocyanins were detected, in which the content of malvidin-3-O-glucoside are most abundant in PW-1. PW-2. and PW-3. indicating that the malvidin-3-O-glucoside was the main substance contribution for colour. Therefore, the colour of wine for the production of premium red wine is very important (Magarino and José. 2006).
Table 5 and 6 showed the content of monomeric anthocyanins in wines at different harvest times. As can be seen, the class of monomeric anthocyanins was the same as that of the berries of grapes in the wines. At the same time, the tables showed malvidin-3-O-glucoside enriched wines; the content reached more than 50 percent of total anthocyanins (Fanzone et αι. 2011; Giuffrè, 2013).
The content of monomeric anthocyanins in wines decreased markedly during ripening in 2015, contrary to 2014. The anthocyanin synthesis and content of monomeric anthocyanins were affected by the temperatures, for example, in the cold year (2014), levels were significantly higher than in the hot and dry year (Liang et al., 2012). As indicated in Table 5, the contents of malvidin-3-O-glucoside were highest in MW-3. MW-3 and PW-3 was 122.98 mg/g, 114.86 mg/g respectively, and content of malvidin-3-O-glucoside was relatively low in MW-1 and PW-1, as it was 69.72 mg/g and 86.22 mg/g respectively in 2014.
Contents of malvidin-3-O-glucoside varied from 69.72 mg/L~122.98 mg/L in Merlot, which accounted for 57.3%~62.3% of the total anthocyanins. The contents of total anthocyanins ranged from 121.61 to 197.41 mg/L, in which non-acylated anthocyanins accounted for 76.9 % of total anthocyanins. In MW-3, acylated anthocyanins accounted for 20% of the wines. In Pinot Noir, the monomeric anthocyanins were non-acylated anthocyanins, and the contents of malvidin-3-O-glucoside were also the maximum, accounting for 90% of total anthocyanins. As can be seen from Table 5 and 6, the malvidin-3-O-glucoside was the most abundant monomelic anthocyanin, reaching more than 52%, followed by malvidin-3-0-(6-0-Acetyl)-glucoside, of which the content accounted for 79.47%~82.26% and 82.49%~85.49% of the total content of monomer anthocyanins, respectively. This indicated that both malvidin-3-O-glucoside and malvidin-3-0-(6-0-Acetyl)-glucoside play pivotal roles in the anthocyanin, which makes the colour of the wine (Bindon et al, 2014; Magarirto and José, 2013). Furthermore, it was crucially important to control the maturity of the phenolic compounds for the quality of grapes and wines according to the results (Bindon et al., 2013; Bindonef al., 2014; Magaririo and José, 2006). Also, the monomer composition and content of anthocyanins were related to the grape varieties (Liang et al, 2008; Segade et al., 2009).
Sensory analysis of wine
After homogenisation of the tasting data, the data were conducted with Quantitative descriptive analysis (QDA). The results demonstrated that the wines from grapes on the third harvesting times (PW-3) are the best in the continuous two years (Fig. 5, 6).
The organoleptic properties of PW-3 wines, including the clarity, flavour preferences and overall balance were the best, followed by PW-2 and PW-1. However, the colour and aroma intensity of wines from PW-2 were the best, 0.94 and 0.90 respectively, followed by PW-3 and PW-1 in 2015. Previous studies have shown that the compounds related to colour and aroma are very important for determining the optimal harvest time (Cadot et al., 2012; Chang et al., 2014). The colour and aroma intensity of the wines from PW-2 was lowest, followed by PW-3 and PW-1. Due to the climate changes in 2014, the result was opposite in 2015. The aroma compounds in the grapes are affected by the degree of maturity, climate, variety and other factors (Coelho et al.. 2007; Magarino and José, 2006). Only when the grapes reached high-level maturity, we could evaluate the quality of aroma (Coelho et al., 2007; Vilanova et al., 2010). According to the scored points of wines, PW-3 was the best, followed byPW-2andPW-l.
As for the quality of Merlot, the quality of wines from MW-3 was the best, therefore, the optimal harvest time for Merlot is five weeks after veraison. However, the taste scores of MW-2 were the highest followed by MW-3 and MW-1. while, in addition to the taste, the other sensory indicators of MW-3 wines were the highest, followed by MW-1 and MW-2.
CONCLUSIONS
By studying the grapes and wines from different sampling times, a significant relationship was observed between the harvest time and the content of phenolic compounds. Also, at difference sampling times, the basic indexes and the content of phenolic compounds of grapes had significant differences. Hence, our data provide support for ensuring the best harvest time. Three and five weeks after veraison of 2014 and 2015. respectively, could be the optimal harvest time from looking at the content of phenolic compounds and from the sensory analysis of wines. Further studies about the relationship between the harvest time and the content of monomer anthocyanins in wines, as well as more sensory analysis of wines will be of greater benefit to determine the optimal harvest time, further to obtain the best quality of wines. On the basis of our findings from this study, we proposed two indexes in order to simplify the practice of winery. The content of anthocyanins in skins and total content of phenolic compounds in seeds are seen as the principal index when the reducing sugar-acid ratio reaches the requirements of harvest. This was done in order to illustrate the optimal harvest time and to ensure the best quality of grapes and wines in the locality. For the special climatic conditions in Northwest China, our conclusion would be a benefit to the quality of wines produced in the locality.
LITERATURE CITED
Allegro, G., Pastore, C, Valentini, G., Muzzi, E. & Filippetti, I., 2016. Influence of berry ripeness on accumulation, composition and extractability of skin and seed flavonoids in cv. Sangiovese (V. vinifera L.). J. Sei. Food Agric. 96, 4553-4559. [ Links ]
Bindon, K., Varela, C, Kennedy, I, Holt, H. & Herderich, M., 2013. Relationships between harvest time and wine composition in Vitis vinifera L. cv. Cabernet Sauvignon 1. Grape and wine chemistry. Food Chem. 138, 1696. [ Links ]
Bindon, K., Holt, H, Williamson, P.O., Varela, C, Herderich, M. & Francis, I.L., 2014. Relationships between harvest time and wine composition in Vitis vinifera L. cv. Cabernet Sauvignon 2. Wine sensory properties and consumer preference. Food Chem. 154: 90-101 [ Links ]
Bordiga, M., Travaglia, F., Locatelli, M., Coïsson, J.D. & Arlorio, M., 2011 Characterisation of polymeric skin and seed proanthocyanidins during ripening in six Vitis vinifera L. cv. Food Chem. 127, 180-187. [ Links ]
Cadot, Y., Caillé, S., Samson, Α., Barbeau, G. & Cheynier, V, 2012. Sensory representation of typicality of Cabernet franc wines related to phenolic composition: impact of ripening stage and maceration time. Analytica Chi-micaActa. 732, 91. [ Links ]
Canals, R., Llaudy, M.C., Vails, J., Canals, J.M. & Zamora, R, 2005. Influence of ethanol concentration on the extraction of color and phenolic compounds from the skin and seeds of Tempranillo grapes at different stages of ripening. J. Agric. Food Chem. 53, 4019-4025. [ Links ]
Chang, E.H., Jung, S.M. & Hur, Y.Y., 2014. Changes in the aromatic composition of grape cv. Cheongsoo wine depending on the degree of grape ripening. Food Sei. Biotechnol. 23, 1761-1771. [ Links ]
Chira, K., Schmauch, G., Saucier, C, Fabre, S. & Teissedre, P.L., 2009. Grape variety effect on proanthocyanidin composition and sensory perception of skin and seed tannin extracts from Bordeaux wine grapes (Cabernet Sauvignon and Merlot) for two consecutive vintages (2006 and 2007). J. Agric. Food Chem. 57, 545-553. [ Links ]
Coelho, Ε., Rocha, S.M., Barros, A.S., Delgadillo, I. & Coimbra, M.A., 2007. Screening of variety- and pre-fermentation-related volatile compounds during ripening of white grapes to define their evolution profile. Analytica Chimica Acta. 597, 257-264. [ Links ]
Conde, C, Silva, P., Fontes, Ν, Dias, A.C.P., Rui, M.T., Sousa, M.J., Agasse, Α., Delrot, S. & Geros, Η., 2006. Biochemical changes throughout grape berry development and fruit and wine quality. Food. 1, 1-22. [ Links ]
Condurso, C, Cincotta, F., Tripodi, G., Sparacio, Α., Giglio, D.M.L., Sparla, S. & Verzera Α., 2016. Effects of cluster thinning on wine quality of Syrah cultivar (Vitis vinifera L.). Eur. Food Res. Technol. 242, 1-8. [ Links ]
Cook, B.I. & Wolkovich, E.M., 2016. Climate change decouples drought from early wine grape harvests in France. Nature Climate Change. 6, pages. [ Links ]
Di, S.R., Carla, CM. & Di, S.R., 1991. Rivista Di Viticoltura Ε Di Enologia. xliv. vol, 37-45. [ Links ]
Fanzone, M., Zamora, F, Jofré, V., Assof, M. & Pena-Neira, Á., 2011. Phenolic composition of Malbec grape skins and seeds from Valle de Uco (Mendoza, Argentina) during ripening. Effect of cluster thinning. J. Agric. Food Chem. 59,6120-6136. [ Links ]
Fournand, D., Vicens, Α., Sidhoum, L., Souquet, J.M., Moutounet, M. & Cheynier, V., 2006. Accumulation and extractability of grape skin tannins and anthocyanins at different advanced physiological stages. J. Agric. Food Chem. 54, 7331. [ Links ]
Garrido, J. & Borges, F., 2011. Wine and grape polyphenols-A chemical perspective. Food Research International. 44, 3134-3148. [ Links ]
Gil, M., Kontoudakis, N, Gonzalez, E., Esteruelas, M., Fort, F., Canals, J.M. & Zamora, F., 2012. Influence of grape maturity and maceration length on color, polyphenolic composition, and polysaccharide content of Cabernet Sauvignon and Tempranillo wines. J. Agric. Food Chem. 60, 7988-8001. [ Links ]
Giuffrè, A.M., 2013. HPLC-DAD detection of changes in phenol content of red berry skins during grape ripening. Eur. Food Res. Technol. 237, 555564. [ Links ]
Harbertson, J.F., Picciotto, E.A. & Adams, D.O., 2003. Measurement of polymeric pigments in grape berry extracts and wines using a protein precipitation assay combined with bisulfite bleaching. Am. J. Enol. Vitic. 54, 301-306. [ Links ]
Hernándezhierro, J.M., Quijadamorín, Ν, Martínezlapuente, L., Guadalupe, Ζ., Ayestarán, Β., Rivasgonzalo, J.C. & Escribanobailón, M.T, 2014. Relationship between skin cell wall composition and anthocyanin extract-ability of Vitis vinifera L. cv. Tempranillo at different grape ripeness degree. Food Chem. 146, 41. [ Links ]
Hufnagel, J.C. & Hofmann, T, 2008. Orosensory-directed identification of astringent mouthfeel and bitter-tasting compounds in red wine. J. Agric. Food Chem. 56, 1376-1386. [ Links ]
Intrieri, C, Filippetti, I., Allegro, G., Centinari, M. & Poni, S., 2010. Early defoliation (hand vs mechanical) for improved crop control and grape composition in Sangiovese (Vitis vinifera L.). Aust. J. Grape Wine Res. 14, 2532. [ Links ]
Jin, Z.M., He, J.J., Bi, H.Q., Cui, X.Y. & Duan, C.Q., 2009. Phenolic compound profiles in berry skins from nine red wine grape cultivars in northwest China. Molecules. 14, 4922. [ Links ]
Kontoudakis, N, Esteruelas, M., Fort, F, Canals, J.M., De, FV. & Zamora, F., 2011. Influence of the heterogeneity of grape phenolic maturity on wine composition and quality. Food Chem. 124, 767-774. [ Links ]
Lasanta, C, Caro, 1., Gómez, J., Pérez, L., 2014. The influence of ripeness grade on the composition of musts and wines from Vitis vinifera cv. Tempranillo grown in a warm climate. Food Res. Int. 64, 432-438. [ Links ]
Lee, J., Durst, R.W. & Wrolstad, R.E., 2005. Determination of total monomeric anthocyanin pigment content of fruit juices, beverages, natural colorants, and wines by the pH differential method: collaborative study. J. AOACInt. 88, 1269-1278. [ Links ]
Li, X.X., He, F., Wang, J., Li, Z. & Pan, Q.H., 2014. Simple rain-shelter cultivation prolongs accumulation period of anthocyanins in wine grape berries. Molecules. 19, 14843-14861. [ Links ]
Li, Y.G., Tanner, G. & Larkin, P., 1996. The DMACA-HC1 Protocol and the threshold proanthocyanidin content for bloat safety in forage legumes. J. Sei. Food Agric. 70, 89-101. [ Links ]
Liang, N.N., He, F, Bi, H.Q., Duan, C.Q., Reeves, M.J. & Wang, J., 2012. Evolution of flavonols in berry skins of different grape cultivars during ripening and a comparison of two vintages. Eur. Food Res. Technol. 235, 1187-1197. [ Links ]
Liang, Z., Wu, B., Fan, P., Yang, C, Wei, D., Zheng, X., Liu, C. & Li, S., 2008. Anthocyanin composition and content in grape berry skin in Vitis germplasm. Food Chem. Ill, 837-844. [ Links ]
Lorrain, B., Chira, K. & Teissedre, PL., 1991. Phenolic composition of Merlot and Cabernet-Sauvignon grapes from Bordeaux vineyard for the 2009-vintage: Comparison to 2006, 2007 and 2008 vintages. Food Chem. 126, 1991. [ Links ]
Marti, N, Lizama, V., Verdú, J.A., Munoz, N, Aleixandre, J.L. & Saura, D., 2015. Prediction of phenolic composition of Monastrell and Tempranillo wines: correlation between phenolic content and traditional variables of fruit maturity. Int. J. Food Prop. 18, 465-479. [ Links ]
Mattivi, F., Vrhovsek, U., Masuero, D. & Trainotti, D., 2009. Differences in the amount and structure of extractable skin and seed tannins amongst red grape varieties. Aust. J. Grape Wine Res. 15, 27-35. [ Links ]
Mota, R.V.D., Favero, A.C., Silva, C.P.C., Purgatto, E., Shiga, T.M. & Regina, Μ.D. Α., 2011. Wine grape quality of grapevines grown in the Cerrado Ecoregion of Brazil. Int. J. Vine Wine Sei. 45, 101-109. [ Links ]
Myunghee, J., Yonghee, K, Byulhana, L., Yosup, P. & Heeseung, P., 2014. Fruit quality and harvest time of 'Heukboseok' grape by fruit load. Korean J. Hort. Sei. Technol. 32, 289-295. [ Links ]
Nedomová, S., Kumbar, V, Pavlousek, P., Pytel, R., Lampír, L. & Buchar, J., 2017. Effect of harvest date on composition and geometry of grape berries. Eur. J. Hort. Sei. 82, 21-30. [ Links ]
Obreque-Slier, Ε., Pena-Neira, Α. & Lopez-Sous, R., 2010. Comparative study of the phenolic composition of seeds and skins from Carmenere and Cabernet Sauvignon grape varieties (Vitis vinifera L.) during ripening. J. Agric. Food Chem. 58, 3591-3599. [ Links ]
Obreque-Slier, E., Pefia-Neira, Α., López-Solís, R., Cáceres-Mella, Α., To-ledo-Araya, Η. & López-Rivera, Α., 2013. Phenolic composition of skins from four Carmenet grape varieties (Vitis vinifera L.) during ripening. Food Sei. Technol. 54, 404-413. [ Links ]
O-Marques, J., Reguinga, R., Laureano, O. & Ricardo-Da-Silva, J.M., 2005. Changes in grape seed, skin and pulp condensed tannins during berry ripening: effect of fruit pruning. Ciência Ε Técnica Vitivinícola. 20, 35-52. [ Links ]
Peinado, J., Lerma, N.L.D., Moreno, J. & Peinado, R.A., 2009. Antioxidant activity of different phenolics fractions isolated in must from Pedro Ximenez grapes at different stages of the off-vine drying process. Food Chem. 114, 1050-1055. [ Links ]
Peyrot, D.G.C. & Kennedy, J. Α., 2003. Direct method for determining seed and skin proanthocyanidin extraction into red wine. J. Agric. Food Chem. 51, 5877-5881. [ Links ]
Rajha, H.N., Darra, N.E., Kantar, S.E., Hobaika, Z., Louka, N. & Maroun R.G., 2017. A comparative study of the phenolic and technological maturities of red grapes grown in Lebanon. Antioxidants. [ Links ]
Rlbera-Fonseca, Α., Noferini, M., Jorquera-Fontena, E. & Rombolà, A.D.. 2016. Assessment of technological maturity parameters and anthocyanins in berries of cv. Sangiovese (Vitis vinifera L.) by a portable vis/NIR device. Scientia Horticulturae. Vol no.229-235. [ Links ]
Romerocascales, I., Ortegaregules, Α., Lopezroca, J.M., Fernandezfernan-dez, J.I. & Gomezplaza, E., 2005. Differences in anthocyanin extractability from grapes to wines according to variety. Am. J. Enol. Vitic. 56, 212-219. [ Links ]
Sadras, V.O. & Moran, M.A., 2012. Elevated temperature decouples anthocyanins and sugars in berries of Shiraz and Cabernet Franc. Aust. J. Grape Wine Res. 18, 115-122. [ Links ]
Segade, S.R., Vazquez, E.S. & Losada, E.D., 2009. Influence of ripeness grade on accumulation and extractability of grape skin anthocyanins in different cultivars. J. Food Comp. Anal. 21, 599-607. [ Links ]
Urraca, R., Sanz-Garcia, Α., Tardaguila, J. & Diago, M.P., 2015. Estimation of total soluble solids in grape berries using a hand-held NIR spectrometer under field conditions. J. Sei. Food Agric. 96, 3007-3016. [ Links ]
Vilanova, M., Zamuz, S., Vilariflo, F. & Sieiro, C, 2010. Effect of terroir on the volatiles of Vitis vinifera cv. Albariflo. J. Sei. Food Agric. 87, 12521256. [ Links ]
Z, L., Q, P., Z, J., L, M. & C, D., 2011. Comparison on phenolic compounds in Vitis vinifera cv. Cabernet Sauvignon wines from five wine-growing regions in China. Food Chem. 125, 77-83. [ Links ]
Submitted for publication: December 2017
Accepted for publication: September 2018
* Corresponding author: E-mail address: yuanchl69@nwsuaf.edu.cn
Acknowledgements: This work was supported by the Agricultural science and technology innovation and technological project of Shaanxi Province (2015NY131)
ARTICLES
doi: https://doi.org/10.21548/40-2-3235
UV Light Acclimation Capacity of Leaf Photosynthetic and Photochemical Behaviour in Near-isohydric and Anisohydric Grapevines in Hot and Dry Environments
A. Fernandes de Oliveira*; F. Rais; I. Dettori; M. Azzena; G. Nieddu
Department of Agriculture, University of Sassari, Viale Italia 39, 07100 Sassari, Italy
ABSTRACT
The photosynthetic and photochemical adaptation of grapevine leaves to high UV radiation, under hot and dry summer conditions, was investigated in near-isohydric Cannonau (syn. Grenache) and near-anisohydric Bovale grande (syn. Carignan). From pea-size stage until harvest, vines with mild to moderate water deficit were subjected to UV-blocking treatment (-UV) and compared to a control exposed to sunlight (C). Canopy light and thermal microclimate, growth and density, maximum leaf gas exchange, primary photochemistry (PSII) and phenols were monitored. Average increments in canopy temperature under -UV tunnels during day-time and night-time were 3.3°C and 0.8°C in Bovale grande and 2.6°C and 1.1°C in Cannonau. Cultivars reached similar leaf area, intrinsic water-use efficiency and stem water potential under C and -UV. Cannonau showed lower stomatal conductance, maximum net assimilation and transpiration rates, but also faster recovery of PSII under heat and moderate water stress. UV radiation induced a stronger and longer impact on leaf assimilation, but the duration of elevated temperatures under -UV induced higher photoinhibition and lower photochemical efficiency. A similar degree of correlation between leaf temperature and gas exchange was found among cultivars and treatments. In Cannonau, leaf anthocyanin decreased due to heat-induced long-lasting PSII photoinactivation under C. Conversely, Bovale grande showed higher phenolic content stability, thus higher photoprotection and recovery of PSII functional units. Agronomical practices affecting leaf phenolic accumulation influence canopy acclimation to heat and high sunlight. Vineyard management must avoid excessive canopy sun exposure and duration of elevated temperatures to favour high assimilation, while reducing photoinactivation and heat damage.
Keywords: UV radiation, heat stress, growth, net assimilation, PSII photoinhibition and recovery, anthocyanin, flavonols
INTRODUCTION
In Mediterranean climate regions, plants are naturally exposed to elevated solar irradiance during their life cycle and, in many grapevine-growing areas, the frequency of extreme events, such as heat waves, has increased in the last decades. In such environments, high temperatures and elevated ultraviolet (UV) and photosynthetically active radiation (PAR) are frequently combined with drought (EEA, 2009). The latest global warming report predicts an average increase in ambient temperature of at least 1.5°C for the low and 2.6°C to 4.8°C for the high greenhouse gas emission scenarios by the end of the 21st century (IPCC, 2018). Although recent projections suggest an ozone recovery by 2100 (Bais et al., 2015), recent studies have indicated that the decreasing trend in cloud cover over the Mediterranean Basin observed since 1970 will continue during the 21st century, together with decreased precipitation (Sanchez-Lorenzo et al., 2017) and increased surface downward solar radiation (Wild et al., 2015). UV radiation (280 to 400 nm) reaching the Earth's surface is effective in regulating several physiological processes and metabolic pathways of plant development (Morales et al., 2013). The absorption of high UV levels, especially UV-B (280 to 315 nm), can damage biological systems more than the simple heat or sunburn effect of solar radiation by degrading cellular DNA, and reducing plant photosynthesis, chloroplast thylakoid integrity and biomass production (Caldwell et al., 2003; Zlatev et al., 2012).
The biological impacts of UV-B radiation are effective even at low radiation intensities, leading to increased reactive oxygen species production and oxidative stress. Plant sensitivity to UV radiation seems to vary considerably among species and varieties. Some crops show high sensitivity to current natural UV-B levels, while others express great tolerance to enhanced doses (Teramura & Sullivan, 1991). For these reasons, and due to the great diversity of physiological and biochemical characteristics among varieties (Zarrouk et al., 2016), as well as the high plasticity and adaptive capacity found under different growing conditions (Lovisolo et al., 2016; Palliotti & Poni, 2016), it is worthwhile to investigate grapevine responses to multiple environmental stresses influencing crop performances under natural conditions.
Several morphogenic mechanisms allow plants to cope with high temperature and sunlight levels during the different phenological stages (Cramer, 2010; Potters et al., 2006) in order to reduce negative impacts on growth and production. Among the plant mechanisms to tolerate abiotic constrains, a decrease in leaf gas exchange can be observed before a reduction in vegetative growth. In effect, photosynthesis is highly sensitive to heat and light stresses, and can be reduced either by the inhibition of photosystem II (PSII) activity and/ or by Rubisco inactivation during the primary carbon fixation steps of the Calvin cycle (Wahid et al, 2007; Luo et al, 2011; Feller, 2016). The inhibition of PSII activity leads to a reduction of chlorophyll fluorescence yield of PSII, which means that in vivo measurements of the rapid fluorescence kinetic curve (OJIP test) after leaf dark-adaptation (Strasser et al, 2004), together with leaf gas-exchange monitoring, may allow for a better understanding of the photoinhibition processes, as well as for evaluating abiotic stress tolerance, acclimation to high radiation stress, and the recovery capacity of different species and varieties (Luo et al., 2011; Xu et al, 2014). Reductions in grape net leaf CO2 assimilation by UV-B radiation occur in environments with naturally high sunlight, despite a rapid recovery of photochemical activity from UV photoinhibition induced by UV-screening phenolic substances (Kolb et al, 2001).
As in other important crops, varietal differences in grape physiological behaviour to avoid sunlight and high atmospheric water demand or drought-induced damage in leaves have been revealed in recent decades (Cramer, 2010; Rogiers et al, 2009; Sade et al, 2012). Grapevine varieties are considered drought-tolerant plants (Chaves et al., 2010) and are able to develop different strategies to respond to environmental constraints (Poni et al, 2018). The stomatal control over transpiration is particularly sensitive to abiotic stresses (Düring, 1998; Soar, 2006; Fernandes de Oliveira & Nieddu, 2016b). Due to the combination of varietal differences in hydraulic properties and cellwall elasticity with hormonal signals, leaf gas exchange performance may vary greatly among cultivars, depending upon the growing conditions of the site (Hugalde & Vila, 2018; Lovisolo et al, 2016). Nevertheless, the differences in stomatal regulation under drought conditions among the varieties studied to date make it possible to classify them as near-isohydric (pessimistic) or near-anisohydric (optimistic) (Schultz, 2003; Dal Santo et al, 2016; Zarrouk et al, 2016). Optimistic performance has been reported in Carignan under Mediterranean climate conditions, in comparison with the pessimistic response of varieties from the Grenache family (Chaves et al, 2010; Lovisolo et al., 2010; Keller, 2016; Fernandes de Oliveira & Nieddu 2016b).
Overall, under high evaporative demand and conditions of water scarcity, near-isohydric varieties show tight stomatal control in order to maintain a constant leaf water potential (Schultz, 2003; Chaves et al., 2010). In near-anisohydric varieties, in contrast, the water potential drops faster until the leaf reaches the turgor-loss point and stomatal closure. Until this point, the leaves present higher stomatal conductance and thus higher CO2 assimilation (Lovisolo, 2010), but tend to show lower photosynthetic efficiency and photorespiration rate. Furthermore, although being less water-balance conservative, some near-anisohydric varieties may recover rapidly after drought due to higher resistance to cavitation under severe stress conditions, and hence may display higher photosynthetic productivity under mild to moderate water stress (Alsina et al., 2007; Lovisolo et al., 2010; Sade et al., 2012). Many varieties have shown photosynthetic and metabolic tolerance and high acclimation capacity to high insolation and temperature conditions (Young et al., 2016; Castagna et al., 2017). However, decreases in the intensity of leaf gas exchange and distinct behaviours among varieties have been reported in response to UV light, heat and drought conditions (Schultz, 2003; Alsina et al., 2007; Berli et al., 2010), and reductions in net assimilation and water losses during long stress periods are frequently combined with alterations in pigment balance, namely in UV-absorbing pigments (Kolb et al., 2001; Martínez-Lüscher et al., 2013; Del-Castillo-Alonso et al., 2016). By decreasing light absorption, this adjustment mechanism allows plants to protect the photosynthetic apparatus against reactive oxygen species, and thus to tolerate high irradiation levels, avoiding photoinhibition and photooxidation (Liakopoulos et al., 2007, Martínez-Lüscher et al., 2013).
Recent studies have suggested that changes in the photoinhibition dynamics and photoprotection capacity may also depend upon the plant's ability to rapidly synthesise phenolic compounds (Barnes et al., 2015). Besides, diurnal and seasonal variations in the accumulation of phenolics may be linked to changes in environmental irradiance levels (Sebela et al., 2017). We hypothesise that varietal differences in grapevine acclimation responses to UV radiation and heat stresses, so far as leaf photosynthesis and photochemistry performance are concerned, also depend on differences in leaf pigment-accumulation dynamics according to genetic differences in phenolic profiles (Xu et al., 2014; Fernandes de Oliveira et al., 2015). To investigate these relationships, two grapevine varieties that are widespread in Mediterranean viticultural areas (Anderson & Aryal, 2013) were chosen for their different leaf gas exchange performance under water stress and high temperatures (Fernandes de Oliveira & Nieddu, 2016b). During vegetative growth, the effects of UV radiation on grape leaf gas exchange, primary photochemistry and the non-invasive rapid evaluation of leaf pigment balance (Goulas et al., 2004) were analysed to detect alterations in assimilation capacity, photoinhibition and recovery capacity, and to investigate correlations with the accumulation of leaf pigment photoprotection mechanisms.
MATERIALS AND METHODS
Plant material and experimental site
The study was carried out in Oristano, Sardinia, Italy, on the red grape variety collection vineyard of the University of Sassari (39°54'12"N, 8°37'19"E). The climate of the study area is classified as Mediterranean Pluviseasonal-Oceanic, with upper thermo-Mediterranean, lower dry, euoceanic weak horizons, according to the worldwide bioclimatic classification system (Canu et al., 2015). The altitude of the experimental farm is about 13 m above sea level, and the coastal plain that characterises the Oristano Gulf area gives rise to limited climate variability. Annual precipitation is about 540 mm. The mean, maximum and minimum temperatures are 16.7°C, 21.3°C and 12.1°C respectively (Fick & Hijmans, 2017). Mean, maximum and minimum daily solar exposure is about 15.7 MJ/m2, 26.1 MJ/m2 (in July) and 6.8 MJ/m2 (in January) respectively.
The study was conducted on ten-year-old Bovale grande (syn. Carignan) and Cannonau (syn. Grenache) vines grafted onto 779 P rootstock and spaced 2.5 m x 1.0 m, spur-pruned to a unilateral cordon, of 1 m height and a maximum leaf wall height of 1.2 m. The vineyard has a north-south row orientation and a single drip-line irrigation system (4 L/h). In the collection field, grapevine varieties are arranged in three randomised blocks of 20 plants per variety. In each block, the two varieties studied are planted in two contiguous rows. During the 2016 season, two treatments were compared from pea size until harvest: 1) the UV-blocking treatment (-UV), in which the entire canopy of 10 plants of each variety per block was covered with an ultraviolet radiation-blocking filter - polycarbonate panels (Suntuf Plus Clear Embossed, Omega 76/16 profile and 0.8 thickness, Palram Europe Ltd., UK) - with elevated, visible solar radiation transmission (> 80%); 2) the control (C), in which ten consecutive vines of each variety were kept directly exposed to ambient solar radiation. The UV-screening panels were mounted in a tunnel structure of 2.5 m in height, 5 m in width and 12 m in length. The north and south sides of the tunnel were left open, while the east and west sides of the vines were completely covered, leaving only 20 cm above the soil surface uncovered to promote natural ventilation. Inside the tunnels, the air temperature increased by about 2°C compared to the outside air temperature inside vine canopy, and reached on average maximum temperatures 5°C higher. Plants were deficit irrigated from pea size until the beginning of ripening, and weekly watering supplies were defined based on stem water potential, imposing a -0.8 MPa lower threshold in order to maintain a mild to moderate water deficit conditions (Myburgh, 2011). The total re-watering amount during the season was 130 mm.
Weather and microclimate data collection
In order to describe the weather conditions during the trial, meteorological data were collected from the closest weather station (about 20 km from the study site) for which a long-term (30-year) series of data was available (Capo Frasca, 39°44'23.59"N, 8°27'34.15"E).
Canopy thermo-hygrometric conditions were monitored continuously using small dataloggers (WatchDog A-Series Loggers, Spectrum Technologies Inc., UK) inside a radiation shield. Single light sensors of global solar radiation (Rg), PAR, Red:Far red, UV-A and UV-B intensity, simultaneously coupled to a portable datalogger (Skye Instruments, Llandrindod Wells, Wales), were used to measure the incident radiation at the vineyard site, as well as the radiation transmission inside the tunnels. Light microclimate throughout the canopy layers, in PAR wavelengths (400 to 700 nm), was monitored at the fruit zone and in an upper canopy layer (60 cm from the shoot base), as indicated in Fernandes de Oliveira and Nieddu (2016b), using a ceptometer connected to a total and diffuse PAR sunshine sensor (Sunscan SS1 and BF3; Delta T Devices, UK).
Vegetative growth and canopy density
Grape vegetative growth was evaluated during berry growth and ripening stages based on leaf area (LA) estimation models (Lopes & Pinto, 2005) previously calibrated for Cannonau and Carignano. Shoot length, and the LA of the main and lateral shoot and vine, were determined in 12 shoot replicates per variety and treatment. In order to estimate grape leaf area development, the empirical models take into account a few variables that correlate well with the LA of the main and lateral shoot: number of primary and lateral leaves per shoot, and area of the largest and the smallest primary and lateral leaves, which allow for a good estimation of the mean leaf area. Single leaf area was estimated based on the length of the two lateral main veins. Canopy density was analysed using point quadrat analysis (Smart & Robinson, 1991). Average leaf layer number (LLN) and the percentage of internal leaves (PIL) were determined taking into consideration the measurements taken during ripening at six height layers from the vegetative wall base (at 0, 20, 40, 60, 80 and 100 cm from the shoot base) and replicated horizontally along 1 m of vine row at intervals of 20 cm.
Plant physiological status
Plant water status was evaluated using midday stem water potential, with a pump-up pressure chamber (PMS Instruments, USA). Weekly measurements were taken at solar midday (13:00) in intact adult leaves, covered with aluminium foil-coated plastic bags one hour prior to the measurement to allow for the equilibration of the leaf with the stem water status. Leaf gas exchange and direct chlorophyll fluorescence of PSII were monitored at midmorning (from 10.00 to 11.00 h) on days with clear skies. This was done in vivo on well-exposed adult leaves chosen from the base and the apical parts of the main shoot (leaf position 4 to 6 and 10 to 12 respectively), at three phenological stages (cluster closure, véraison and ripening). Net assimilation (Pn, μmol/m2s CO2), stomatal conductance (gs, mmol/m2s) and transpiration (T, mmol/m2s H2O) rates and leaf temperature (Tleaf, °C) data were collected at ambient reference CO2 concentration (370 μmol/mol), and under the actual PAR, temperature and relative humidity conditions, using a portable infrared gas analyser (Ciras 2, PP systems, UK). Intrinsic water-use efficiency (WUEi, μmol/mol) was calculated as the ratio of net photosynthesis to stomatal conductance. After a 30-minute dark-adaptation period, the fluorescence transients (OJIP curve) were recorded using a HandyPEA fluorimeter (Hansatech Instruments Ltd., UK) during the application of actinic saturating red light (650 nm wavelength) of 3 000 μmol/m2/s single flash, with the signal gain at 1.0 and 30 seconds duration of each replicate. The rapid fluorescence kinetic from minimum (Fo) to maximum (Fm) fluorescence of the dark-adapted leaves was collected. The fluorescence signals were recorded at a 10 μs time step, which allowed for determining the OJIP transient and calculating the main fluorescence variables and a range of derived variables for evaluating PSII activity during the photochemical and thermal phases of the fluorescence transient (Strasser, 2004). The maximum yield of primary photochemistry of PSII, (pPo, the maximum water-splitting efficiency, Fv/Fo, the quantum yield for electron transport, ( Eo, the quantum yield for energy dissipation, ( DIo, and the density of the reaction centres, RCQA, were determined using the equations reported in Table S1. Finally, another chlorophyll fluorescence-derived variable, 1/Fo - 1/Fm, suggested by Flexas et al. (2001) to be a more linear indicator of functional PSII units, was calculated.
Leaf pigment estimation
Leaf chlorophyll, anthocyanin, flavonol and nitrogen balance indexes were estimated in replicates of the basal and apical main shoot leaves during mid-morning on days with clear skies (at the cluster closure, beginning of and full véraison phenological stages), using an optical device, Dualex Scientific+ (FORCE-A, FR) (Cerovic et al., 2012). This portable device is equipped with a leaf clip sensor with a 6 mm diameter measuring surface, and allows for in situ and in vivo estimation of leaf epidermal phenolics (flavonols and anthocyanins), based on the chlorophyll fluorescence-screening method (Goulas et al., 2004) and leaf chlorophyll contents determined by differential transmittance (Cerovic et al., 2012). Four indexes were derived (Table S2): the chlorophyll index (CHL), the flavonol index (FLA), the anthocyanin index (ANT) and the nitrogen balance index (NBI). The latter is the ratio of leaf CHL to FLA epidermal content (Cartelat et al., 2005) and may give a good estimate of the leaf nitrogen content. In each leaf replicate, five measurements were taken at the adaxial and abaxial leaf sides, avoiding the main veins.
Statistical analysis
Analysis of variance (ANOVA) and the least significant difference (LSD) test were performed to compare means and to investigate significant differences at the 95% confidence level, using the software package SPSS statistics 20 (SPSS, Chicago, USA). Two-way ANOVA was performed in order to evaluate the main influences of cultivar, treatment and leaf level, as well as to detect interaction effects among factors. After scaling and normalising the data of each variable for which significant differences were detected, multi-factor analysis (MFA), followed by a Fisher's least-significant difference (LSD) test (p < 0.05), was carried out on leaf gas exchange, stem water potential, direct chlorophyll fluorescence variables, and leaf pigment and nitrogen balance indexes. The resulting loading and score plots highlighted common variations and made it possible to summarise the relationships among the variables, and to identify the main factors influencing the physiological patterns in the two cultivars and in the two treatments. Finally, orthogonal partial least squares discriminant analysis (OPLS-DA) was performed to discriminate treatment-cultivar groups as functions of the analysed variables and to identify which variables were the most distinctive in separating the four cultivar x treatment groups.
RESULTS
Weather conditions
The 2016 season was characterised by hot and dry conditions for most of the duration of the trial (Fig. S1). Monthly air temperatures were higher than the average values of the last 30 years in June, July and September, but remained under the average of the 30-year series in August. The environmental conditions of the growth season were aggravated by the limited precipitation during the entire spring/summer period in the study area, which also led to higher potential evapotranspiration throughout the season, especially in June and July. Rain events were practically absent in June and remained lower than the last 30-year average values in July and August.
Light and thermal microclimatic conditions
The daily pattern of Rg, PAR, UV-A and UV-B incident solar radiation at the experimental site, and the average values transmitted by the plastic filter, measured at BBCH stage 74 on a day with clear sky, are presented in Fig. 1. The Rg and PAR intensity at 09:00 averaged 1 937 W/m2 and 933 μmol/m2s respectively, and midday maximum values were about 3 750 W/m2 and 1 800 μmol/m2 s respectively. Under the UV-screening filter, incident Rg and PAR were reduced to 1 540 W/m2 and 742 μmol/m2 s respectively at 09:00, and similar values were recorded by the end of the afternoon. In the -UV treatment, mid-morning Rg and PAR intensity at the top of the canopy reached 2 200 W/m2 and 1 050 μmol/m2 s. The UV filter blocked 99% of UV-B and 87% of UV-A solar radiation, while the Red:Far red varied close to the values of the environmental control treatment. No significant differences within varieties were observed in light transmission inside the canopy at this stage, and only slight differences were detected between -UV Bovale grande and -UV Cannonau plants during ripening (BBCH stage 85) (Fig. S2).
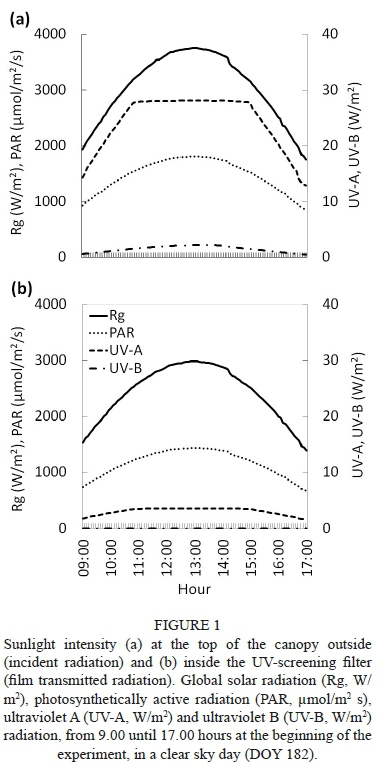
As far as the air temperature inside the canopy is concerned, the UV-screening filter induced an average increase of about 0.8°C and 1.1°C in Bovale grande and Cannonau respectively at night, while the daytime increases averaged 3.3°C and 2.6°C in the Bovale grande and Cannonau respectively (Fig. 2). The differences in canopy temperature were not significant among cultivars, while the higher temperatures recorded under the ultraviolet-blocking filter in the daytime were observed during the entire season of the trial (Fig. S3). Although the percentage duration of temperatures higher than 25°C showed no statistical differences among varieties and treatments, temperatures over 35°C were recorded inside the -UV canopies for 16% and 20% of the trial duration in Cannonau and Bovale grande respectively, compared to the low 2% duration in the Control (Fig. 3). The canopy temperature exceeded 40°C only in the -UV treatments, but this occurred for only 2% of the duration of the trial (ca. 25 hours overall). Nevertheless, on extremely hot days, the canopy temperature experienced the 40°C threshold for as many as two to five consecutive hours (Fig. S3).
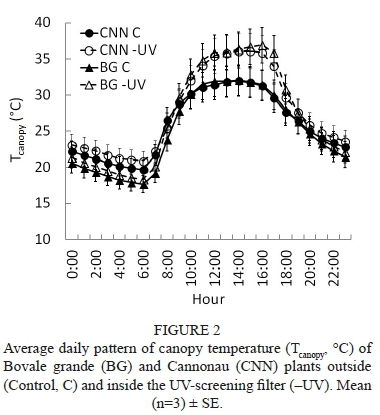
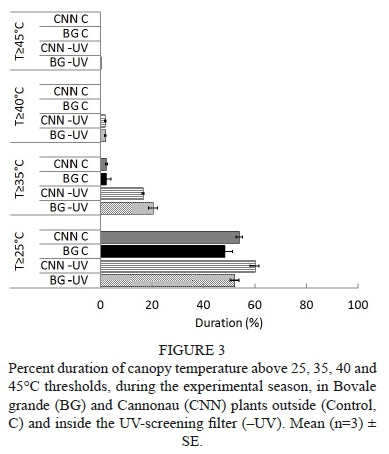
Vegetative growth
Leaf area development was evaluated at flowering (stage 65), cluster closure (stage 75) and two weeks after véraison (stage 85) (Fig. 4a). The main single LA of Bovale grande was significantly greater than that of Cannonau, averaging about 200 cm2 at the maximum development stage (BBCH 75) against the 100 cm2 of Cannonau. Also, the lateral leaves were bigger in Bovale grande compared to Cannonau, and the highest average values were measured after véraison, averaging 64 cm2 and 43 cm2 respectively. No significant effect of the UV-screening treatment was observed in single LA, nor in the main and lateral LA per plant (Table S3). Varietal differences were detected in leaf area development, with Cannonau presenting much lower main LA compared to Bovale grande. During the three stages monitored (flowering, pea-sized berries and ripening), the main leaves represented about 70%, 46% and 40% of total LA in Cannonau, and 91%, 86% and 75% in Bovale grande. The difference in main LA development was counterbalanced by a significantly higher production of lateral shoots in Cannonau plants (Fig. 4a), allowing the plants to keep a similar vegetative surface as the season proceeded. Only at the first measuring date did Bovale grande present a higher total LA compared to Cannonau. The latter presented slightly but not statistically higher total LA during ripening (stage 85), but also a higher canopy density, with average LLN and PIL values of 2.7% and 30% respectively, against the 1.7% and 15% of Bovale grande (Fig. 4b).
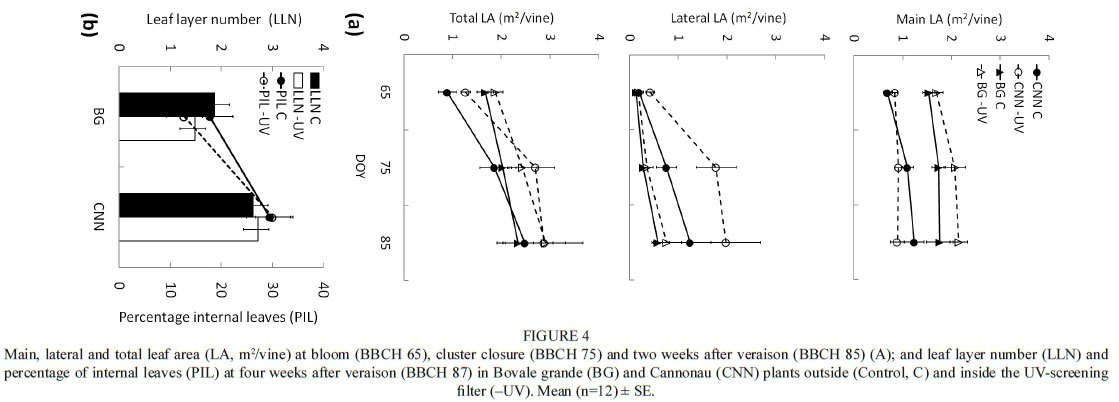
Plant water status
Plant water status ranged from mild to moderate water stress over the entire season of the trial (Table 1). Two re-watering supplies (of about 150 m3/ha each) were applied from fruit set to cluster closure. The lowest values (ca. -1.2 MPa) were observed at cluster closure stage (BBCH 75) after two weeks of constant increments in maximum and minimum air temperature and a prolonged dry period (60 days without precipitation and only one day of effective rainfall, with 7.9 mm of total rainfall). As the atmospheric evaporative demand increased, a similar decrease in ψ Stem was observed among varieties and treatments. Thereafter, irrigation was applied weekly (210 m3/ha), allowing for the plants to recover to a mild water stress status (about -0.95 MPa and -0.85 MPa at stages 80 and 83 respectively). The irrigation volume was reduced by the end of véraison (105 m3/ha/week), and the last irrigation supply was applied two weeks after véraison, totalling about 1 300 m3/ha for the whole season.

Leaf gas exchange and photosynthetic performance
Leaf gas exchange rates were similar in the basal and apical main leaves until véraison (Table 1). Higher rates in young apical leaves were only observed by ripening stage 85 (with average values of Pn, gs and T of about 7.5 μmol/m2 s, 39 mmol/m2 s and 1.7 mmol/m2 s in the basal leaves respectively, against 10.8 μmol/m2 s, 56 mmol/m2 s and 2.4 mmol/m2 s in the apical leaves). Nevertheless, at this stage the basal leaves were still able to reach maximum values of Pn, g and T similar to those of the previous measurements (Table 1). During the first weeks of the trial (stage 75), the treatments did not induce significant differences in mid-morning leaf gas exchange intensity (reaching average Pn, gs and T values of 5.9 μmol/m2 s, 71 mmol/m2s and 2.4 mmol/m2 s respectively in the -UV leaves and 7.2 μmol/m2 s, 74 mmol/m2 s and 1.8 mmol/m2 s in the control). However, highly significant differences in stomatal behaviour were observed among varieties, with the Cannonau gs averaging 20 mmol/m2/s less than that of Bovale grande. In the following measurements, significant differences in net assimilation and transpiration rates were observed, firstly among varieties (BBCH stage 80), with higher Pn, gs and T values in Bovale grande (Table 1). A tighter stomatal closure in Cannonau leaves was observed over the whole experiment, and the pattern of the differences among varieties concerning leaf gas exchange rates was maintained across the season. At stage 80, when plant water status decreased to about -1.2 MPa and the air temperature reached the highest values, stomatal closure was much stronger in the Cannonau leaves, leading to Pn values lower than zero and almost zero transpiration. In Bovale grande, Pn was reduced to values close to zero, yet the higher stomatal aperture in this cultivar led to higher T compared to that of Cannonau. In addition, the apical Bovale grande leaves under the -UV treatment presented higher T, while in Cannonau those leaves had the lowest average T values.
Also, the leaf temperature was different between cultivars along the season. When lower plant water potential values were reached, Bovale grande evidenced the highest Tleaf, while under mild water deficit (first and third measurements), a higher Tleaf was recorded in Cannonau. At véraison and ripening (stages 80 and 83), the maximum air temperature remained under 30°C, and Pn and T reached values similar to those recorded at the beginning of the experiment (Table 1). Also, gs recovered, although the values remained lower than that on the first measurement date. At this stage, highly significant differences were observed among varieties and treatments, with higher leaf gas exchange rates being observed in the -UV leaves (Table 1). Despite the significantly higher temperature of the -UV canopies (Fig. S3), these plants were able to keep a lower Tleaf at mid-morning compared to the control plants directly exposed to solar radiation until véraison. During the last measurement, the Tleaf in the two treatments was similar.
No significant differences in intrinsic water-use efficiency were observed among cultivars, varieties and leaf levels (Table 1). However, Cannonau exhibited higher stomatal control over a range of VPD from 1 to 2 kPa, and a curvilinear relationship was observed between WUEi and gs, with lower WUEi from 0 to 100 mmol/m2 s of gs in the two varieties (Fig. 5). For the environmental conditions of the season, higher values of WUEi were achieved with lower gs in Cannonau, but at the expense of significantly lower An compared to Bovale grande, which showed higher increments in assimilation rate.
Primary photochemistry and energy dissipation of PSII
As far as PSII activity is concerned, no significant changes in most of the direct chlorophyll fluorescence variables were observed during the first days of the trial (BBCH 75), except for a decrease in the quantum yield for electron transport (cpEo) in -UV plants (Fig. 6; Table S3). After 20 days of UV-blocking treatment (stage 80), the differences in PSII activity among treatments became highly significant. In the -UV leaves, the heat and water stress conditions (Tleaf of 39°C to 40°C, -1.2 MPa of ΨStem) induced a lower maximum 'quantum yield for primary photochemistry ((φPo), and for electron transport ((φEo), water-splitting efficiency (Fv/Fo) and density of the reaction centres (RC), which are indicative of photoinhibition. Meanwhile, the control plants did not show increased energy dissipation (φDIo), and the quantum yield of PSII remained at high values. Nevertheless, when calculating the differences, 1/Fo - 1/Fm, an opposite pattern was observed among varieties from the second measurement in Fig. 7, in both the basal and apical leaves: Cannonau presented a decreasing trend, in contrast with the increasing trend of Bovale grande.
The PSII in younger adult leaves on the apical part of the shoot was able to perform better than in the basal leaves only at the cluster closure stage, when water deficit and heat stress became stronger (showing higher (pPo, Fv/Fo, and RCQA and lower average (φDIovalues). However, in the following stages, the differences in the effects of main leaf level became not significant. Despite the tight stomatal closure of Cannonau leaves, a cultivar effect on PSII activity was not statistically evident. In contrast, the effect of treatment remained highly significant and a recovery of (pPo, Fv/Fo, (pEo and RCQA was observed in the average values of the -UV leaves at véraison (BBCH 83). The recovery of (pEo and RCQA was slower in the -UV Bovale grande apical leaves, and was observed only at ripening (Fig. 6). At this stage, no significant differences in the primary photochemistry and energy dissipation parameters of PSII were observed among the varieties, treatments or leaf levels, but an interactive cultivar-treatment effect on (pEo was observed, with higher values in Bovale grande -UV and lower levels in the Cannonau Control (Table S3). A similar trend was observed in RCQA, but it was not statistically significant (Fig. 6).
Leaf chlorophyll, anthocyanin, flavonol and nitrogen balance
Initially, the estimation of leaf pigments at BBCH stage 75 measured with Dualex scientific+ indicated a higher anthocyanin content in Cannonau leaves compared to Bovale grande, while significant differences were observed only among treatments in the following measurements (Table 1; Fig. 7). The control plant presented significantly higher values for the anthocyanin index in both varieties. At véraison (stage 83), a higher anthocyanin index was still observed in the Bovale grande control leaves, but the differences among treatments in Cannonau were reduced (Fig. 7). Regarding the flavonol index, the main differences were detected at stage 80, with lower values being observed in -UV and in the basal leaves of the two cultivars. By véraison, the flavonol index had already increased in -UV to the values measured in the control leaves. As far as the chlorophyll index is concerned, the two varieties presented slightly different trends before véraison, with higher values in the leaves at the basal part of the shoot compared to those at the apex in Cannonau; the opposite behaviour was observed in Bovale grande. At véraison, the -UV leaves presented a higher, yet not statistically significant, chlorophyll index. The treatment effect led to a lower nitrogen balance index in the control plants. This was observed from the first estimation and became increasingly significant as the experiment continued.
Variation of primary leaf photochemistry and gas exchange activity
To determine possible correlations among leaf gas exchange performance, PSII activity, plant water status and the observed variations in the level of key leaf pigments, multi-factor analysis (MFA) and orthogonal partial least squares discriminant analysis (OPLS-DA) were carried out (Fig. 8; Table S5). The focus was on the variables for which significant main effects of treatment and cultivar were detected across the season (Tables 1 and S3). Overall, 64% of the variation in leaf gas exchange, primary photochemistry and pigment level variables were explained by two main factors. The variables derived from chlorophyll fluorescence were highly correlated with the first factor, which can be identified by light conditions and which primarily governs the light-dependent photosynthesis step. In contrast , leaf gas exchange and leaf temperature varied according to the second factor, which is associated with temperature, specifically with the well known temperature-dependent regulation of maximum leaf gas exchange performance. Furthermore, leaf pigment levels were influenced, to a lesser extent, by the two factors extracted. The OPLS-DA separated the four treatment x cultivar groups according to two significant functions. The independent variable that firstly fitted to parsimoniously classify the four groups was ψ Stem The second function subsequently discriminated the groups according to the following variables: PSII functional units, CHL, NBI, gs, T and Tleaf. A third discriminant function included Pn, ANT and FLA and other PSII photochemistry variables, adding even further distinction among groups when compared to the first two functions (Fig. 8, Table S4). When MFA was applied exclusively to control the leaves, both the photochemical variables and leaf gas exchange parameters were correlated the most with factor 1 (Fig. 9). The ANT, NBI and CHL indexes and Ψ„ correlated the most with factor 2, and φΕo and T also correlated with factor 2 to a significant degree. Under the -UV treatment, gas exchange in the leaf and plant water status showed a strong correlation with factor 2, along with Tleaf (in the opposite direction), while the primary photochemistry of the leaf, NBI and ANT were mainly related to factor 1. In this case, FLA correlated similarly with the two main factors. When MFA was performed considering the two varieties separately, the variance in primary photochemistry of the leaf again was explained by factor 1, and the performance of gas exchange in the leaf and the temperature were related to factor 2. In Bovale grande, the influence of factor 1 was higher and related more closely to ANT, while FLA correlated with factor 2. In Cannonau, the influence of factor 2 on the gas exchange performance and Tleaf was slightly higher; a lower correlation of factor 1 was found with ANT and Overall, as expected, the quantum yield for energy dissipation varied in the opposite direction of the maximum quantum yield for primary photochemistry, the density of the reaction centres in PSII, electron transport and water-splitting efficiency, while the maximum gas exchange in the leaf correlated negatively with leaf temperature (Fig. 9; Table S5).
DISCUSSION
Treatment-dependent responses
During the study season, air and canopy temperature reached very high values (> 35°C) from midmorning until afternoon on several days. Under such conditions, photosynthetic assimilation is reduced or even shut down and, consequently, vegetative growth is limited (Kadir et al., 2007). Some studies have also reported decreases in canopy growth caused by high UV-B radiation levels (Berli et al., 2010; Doupis et al., 2011). In our study, light treatment did not induce significant differences in the development of total leaf area, and mild to moderate water stress imposed by deficit irrigation allowed the leaf area to keep growing, also in the -UV plants, although subjected to higher heat stress.
The main differences between the two treatments were found in maximum leaf gas exchange and PSII performance. Despite the higher temperature inside the tunnels, the UV-blocking treatment resulted in a higher maximum photosynthetic rate but lower primary photochemical efficiency. These plants invested in efficient heat dissipation, avoiding further increases in temperature. Though photoinhibition, the limitations of PSII were evident under -UV, and the plants were able to restore high Pn, T and gs rates (Lovisolo et al., 2010). Although the -UV plants were subjected to significantly higher heat stress compared to the control, sufficient PAR light (> 1 000 μmol/m2 s) conditions and the moderate water status imposed on both varieties enabled a complete recovery of the PSII apparatus, and even higher PSII activity and maximum net assimilation by the end of the season. In contrast, gas exchange rates in the leaves of plants exposed directly to solar UV radiation became more limited as the season advanced, also showing a higher correlation with the light conditions (factor 1 in Fig. 9a) and with the primary photochemical variables compared to the -UV plants. The high ( Po in the control leaves during the first stages of the trial is in agreement with a lower photoinactivation of PSII grapevines acclimated to environments with high levels of light. Nevertheless, the decreases in F /F , φΕ and RCQA from véraison to harvest suggest photoinhibition and a reduced recovery capacity of PSII in UV-exposed plants. In fact, previous works by Flexas et al. (2001) indicates that, in grapevines grown in Mediterranean areas that are acclimated to high levels of light, the values of (pPo may give the impression of a high quantum yield when in fact a large portion of the functional PSII units may be inactivated.
Moreover, the fact that the -UV plants were able to recover PSII activity, and reach even higher midmorning leaf gas exchange rates during ripening compared to the control plants, is consistent with a higher acclimation capacity to heat than to UV light stress. High recovery capacity under heat stress was also demonstrated by the sharp increase in the maximum quantum yield for electron transport (φEo) and the density of the reaction centres (RCQA) observed in the -UV leaves at véraison, when temperature decreased and mild plant water status was restored by an increase in re-watering supply.
Martínez-Lüscher et al. (2013) reported a high acclimation to UV-B radiation in Tempranillo grapevines under optimal thermal conditions (25°C/15°C day/night temperatures). These authors did not observe a significant reduction in maximum PSII efficiency, despite the reduction in gas exchange rates in the leaves. In fact, small reductions in photosynthesis may be counterbalanced by the accumulation of phenolic compounds in the leaves (Del-Castillo-Alonso et al., 2016). The multi-factor analysis applied to the whole data separated variations in leaf gas exchange from direct primary photochemistry; however, under the high direct solar radiation conditions of the control plants, gas exchange performance in the leaves was affected the most by sunlight and was linked to the performance of the light-dependent photosynthesis step. Generally, leaf temperature of the -UV plants was highly correlated with chlorophyll fluorescence parameters, namely PSII activity, photoinhibition and recovery, as well as with the chlorophyll index. In the control plants, the weak relationship among the temperature, net assimilation and primary photochemistry variables and chlorophyll can be ascribed to the interposition of the UV-screening photoprotection effect of leaf phenolics.
Higher values of the two phenolic compounds in the UV-exposed leaves were statistically significant at the beginning of véraison, while chlorophyll and nitrogen balance indexes became higher under the UV-blocking filter. Grifoni et al. (2016), using a similar optical instrument in grapevine leaves, also observed decreases in the accumulation of flavonols in the absence of UV radiation, along with increased accumulation when the leaves were re-exposed to direct solar radiation. In our experiment, we found a reduction in the UV-screening photoprotection capacity due to the decrease in anthocyanin content in the leaf epidermis, which is consistent with the decrease in PSII activity in the control plants during the season and helps to explain the loss of PSII functional units under conditions of high insolation. This was particularly evident in the cultivar Cannonau, in which the total anthocyanin contents are known to be highly sensitive to elevated temperature (Fernandes de Oliveira et al., 2017).
Variety-dependent responses
Although Bovale grande and Cannonau showed different balances in primary and lateral leaf area growth, the two varieties reached similar total leaf area under the control and -UV treatments. The differences in canopy density did not induce significant differences between varieties in light transmission into the canopy, probably because the higher lateral leaf area of Cannonau was composed of small leaves that allowed sun-flecks to penetrate into the inner canopy layers.
Bovale grande and Cannonau plants exhibited differences in maximum leaf gas exchange rates, but similar primary photochemistry efficiency, as atmospheric demand and water deficit increased. As expected, the Cannonau plants exhibited typical isohydric behaviour (Fernandes de Oliveira et al. 2013), characterised by tighter stomatal control over transpiration (gs remaining about 20 mmol/m2 s lower, ranging from 63 mmol/m2 s in the first measurement to 5 mmol/m2 s when the lowest was recorded) compared to that of Bovale grande (with an average gs of 82 mmol/m2 s on the first date and 21 mmol/m2 s when the vines reached a lower ψStem). However, the leaves of both varieties balanced the daily maximum gas exchange in the leaves according to the environmental conditions, being able to display similar intrinsic water-use efficiency and stem water content. They also adjusted their maximum photosynthetic performance to the environmental stresses (high UV light, heat and moderate water deficit), following the same pattern and recovering similarly during the season. In Cannonau, this was achieved at the expense of a lower maximum assimilation rate (about 2 to 3 μmol/m2 s less under mild water and heat stress to 1.3 μmol/m2/s less with moderate water and heat stress compared to Bovale grande), indicating that, under mild to moderate water deficit and elevated temperatures, the near-anisohydric behaviour of Bovale grande can result in a more efficient strategy from a crop-productivity perspective, as also suggested by other authors (Sade et al., 2012).
The long duration of heat stress, combined with moderate water deficit, led to a substantial decrease of the maximum leaf photosynthetic and transpiration rates in both varieties. Whenever the temperature reached 40°C, the assimilation rate was promptly reduced, and further transpiration losses and damage to the photosynthetic apparatus were avoided by stricter stomatal control, a coordinated reduction in PSII activity and an increase in energy dissipation. Luo et al. (2011), who studied heat stress effects on the primary photochemistry of young potted Zuoyouhong grapevines (Vitis amurensis L.) grown under controlled day/night temperature cycles and about 1 000 μηκ)! m-2 s-1 maximum PAR, observed a significant inhibition in net assimilation rate and stomatal conductance only when the temperature reached 40°C and 45°C.
Regardless of the light treatment, the reduction of stomatal aperture under tougher temperature and water stress conditions in our experiment (Tleaf of 40°C and moderate water deficit) differed in the two varieties. The lower gs of Cannonau led to lower evaporative cooling (from 0.4 to 0.9 mmol/m2/s lower T). However, this was not followed by a significantly different level of primary photochemistry quantum yield and energy dissipation efficiency among the varieties. Nevertheless, a higher water-splitting efficiency of PSII and a faster recovery of the PSII reaction centre was observed in Cannonau when thermal and water stress increased, which led to stomatal closure. Kadir et al. (2007), on the other hand, when studying the effect of sudden versus gradual heat stress on the primary photochemistry of photosynthesis in the leaf in two varieties, namely Vignoles and Cynthiana, observed that a different grade of damage to PSII, expressed by the percentage decrease in φPo, was caused by heat stress, regardless of the duration of the heat shock. These authors also reported greater recovery of PSII in one of the two varieties. Such varietal difference was not observed in our study, only a slower increase in the φEo and RCQA values in the Bovale grande -UV apical leaves by véraison, and this had already recovered at the beginning of ripening.
When there was a higher intensity of solar radiation and evaporative demand, the two varieties were exposed to high natural and gradual heat, light and water stresses. The accumulated exposure of the canopy to temperatures over 35°C was about 10 days in -UV, and did not exceed one day in the control plants. Furthermore, the Tcanopy reached 40°C only in the -UV-treated plants and for a maximum duration of one day. Taking into consideration previous work on photosynthetic regulation in grapevines subjected to increasing water stress and high evaporative demand (Flexas & Medrano, 2002; Bertamini & Nedunchezhian, 2003; Luo et al., 2011), we can affirm that both Cannonau and Bovale grande were able to respond efficiently to heat stress and water deficit.
The results also show that the high leaf gas exchange performance was closely related to leaf temperature, while the photochemical performance was related less to the temperature condition of the leaves in both the near-isohydric and the near-anisohydric varieties. Also, the relationship between plant water status and the light-dependent photosynthetic step was much weaker in the Cannonau leaves than in Bovale grande (Fig. 9c and 9d). These findings are in accordance with the tighter stomatal control and the higher efficiency of hydraulic regulation mechanisms governing leaf conductance and water losses in Cannonau, namely leaf architecture and anatomy, hydraulic conductance and cell wall elasticity (Chouzouri & Schultz, 2005; Hugalde & Vila, 2018). Nevertheless, the two varieties were able to maintain similar intrinsic water-use efficiency and plant water status under both UV and heat stress conditions. The estimation of leaf metabolites showed evidence of seasonal differences among the varieties in the accumulation of UV-screening pigments during growth, firstly in anthocyanins and then in flavonols. Nevertheless, these differences did not induce changes in the nitrogen balance index. This result also suggests an important plasticity of the two cultivars in adapting to conditions of thermal and light stress without suffering a significant alteration in leaf nitrogen metabolism or without it affecting the integrity of the photosynthetic apparatus. The variation in both indexes of phenolics closely and positively followed the photochemical performance in Bovale grande, while in Cannonau the anthocyanin content in the leaves was somewhat related to primary photochemistry efficiency. Moreover, the contrasting trends between the varieties, both in PSII functional units and the anthocyanin index of the basal and apical Cannonau control leaves (Fig. 7), together with the increasing photoinhibition trend over the season, indicate that UV light exposure induced long-lasting photoinactivation of PSII in this variety. This result suggests that phenolic accumulation in the leaf epidermis may have functioned efficiently as a photoprotection mechanism in both varieties before véraison, but the higher sensitivity to anthocyanin degradation under elevated temperatures, previously observed in Cannonau berry skin (Fernandes de Oliveira & Nieddu, 2016a), led to a loss in leaf photoprotection and photochemical reaction capacity under high solar UV light conditions. This finding was also supported by the multifactor analysis of variety effects (Fig. 9c and 9d), which showed that, in Bovale grande, the leaf primary photochemical performance varied positively with the anthocyanin index, while the variation in gas exchange was weakly related to this index. Besides, a weaker correlation between the anthocyanin index and leaf primary photochemistry and leaf gas exchange-related variables was observed in Cannonau. The flavonol index was affected less by temperature, showed lower variation between treatments and correlated with both photosynthetic and photochemical performance in Bovale grande, but only with the variation in leaf gas exchange in Cannonau. This result is consistent with the higher stability of flavonols under high sunlight and heat compared to anthocyanin. Such differences between the two phenols can also be associated with the predominant role of anthocyanins in red grape metabolism, since in white grape varieties flavol contents have been reported to increase under moderate water deficit and high sunlight conditions compared to well watered vines (Deluc et al., 2009; Fernandes de Oliveira et al., 2019).
CONCLUSIONS
The near-isohydric and near-anisohydric grapevines differed significantly in their acclimation responses to UV radiation under high evaporative demand, and mild to moderate water stress. Both varieties showed good leaf physiological performance and photochemical efficiency, together with a high recovery capacity of the photosynthetic apparatus upon intense solar radiation. Thus, no significant reductions in vegetative growth were observed, although Cannonau invested in lateral shoots, while Bovale grande was able to enhance its main shoot leaf area during the fruit-development stages. Natural UV radiation induced a stronger and longer negative impact on leaf physiological performance in both varieties. In fact, other than being distinguished by their water loss regulation mechanisms, the two varieties on trial were also separated according to the effects that UV exposure and heat stress induced in the regulation of photosynthetic and photochemical performance, as well as in leaf phenolics and the chlorophyll balance (Fig. 10). Besides for lower transpiration rates, lower net assimilation and recovery capacity after high heat stress were also detected in the near-isohydric Cannonau exposed to high natural UV levels. Among the photoprotective mechanisms underlying the high acclimation capacity, the accumulation of phenolic compounds plays a crucial role in grapevines. Varietal differences in the seasonal dynamics of pigment accumulation were evident in the main leaves of both the basal and apical shoots. In addition, Cannonau showed higher sensitivity to the thermal degradation of anthocyanins, which are major UV-screening phenolic compounds in red grapes. Despite these differences, both varieties were able to efficiently balance leaf water use and plant water status.
It is for these reasons that we can conclude that, when mild to moderate water stress thresholds are maintained, both Bovale grande and Cannonau show high acclimation to heat and UV light stresses. Furthermore, the impact of high UV radiation and elevated temperatures on photosynthetic capacity and photochemical performance of near-isohydric and anisohydric varieties depends on the perception and regulation mechanisms of each variety, including differences in leaf hydraulic properties and anatomic characteristics. However, it can also be affected by differences in phenolic accumulation dynamics and phenolic profiles. In this sense, agronomical practices that affect the synthesis and accumulation of leaf pigments can influence canopy acclimation to heat and conditions of high sunlight. Under Mediterranean conditions, the decisions concerning vineyard management, like the pruning system, the timing, frequency and intensity of canopy management operations, as well as the best irrigation system and scheduling, must take into consideration the need to avoid excessive sunlight exposure and long duration of elevated temperatures during the hot and dry season. Moreover, in such conditions, monitoring the canopy temperature may give an accurate indication of plant physiological status and water requirements for both near-isohydric and near-anisohydric varieties, since it is closely related to plant water status and, on the whole, to photo-assimilation performance during the growing season. Finally, using the new optical tools that allow for rapid and non-destructive estimation of leaf pigments, further research could be conducted, both in situ and in vivo, to provide new information on how and how fast grapevines can balance these key metabolites in their leaves in order to recover their photosynthetic and photochemical functionality. Such new knowledge will allow for a deeper understanding of short- and long-term response mechanisms, as well as of the degree of plasticity that different varieties may achieve under multiple stress conditions.
APPENDIX A. SUPPLEMENTARY DATA
Supplementary data associated with this article can be found in the online version.
LITERATURE CITED
Aeronautica Militare, 2017. Servizio Meteorologico Aeronautica Militare. Dati meteo. Online: http://clima.meteoam.it/_ [accessed 14 March 2017]. [ Links ]
Alsina, M.M., Herralde, F., Aranda, X., Savé, R. & Biel, C., 2007. Water relations and vulnerability to embolism are not related: Experiments with eight grapevine cultivars. Vitis 46, 1-6. [ Links ]
Anderson, K. & Aryal, N.R., 2013. Which winegrape varieties are grown where? A global empirical picture. The University of Adelaide Press, Adelaide. [ Links ]
Bais, A.F., McKenzie, R.L., Bernhard, G., Aucamp, P.J., Ilyas, M., Madronich, S. & Tourpali, K., 2015. Ozone depletion and climate change: Impacts on UV radiation. Photochem. Photobiol. Sci. 14, 19-52. [ Links ]
Barnes, P.W., Flint, S.D., Rye, R.J., Tobler, M.A., Barkley, A.E. & Wargent, J.J., 2015. Rediscovering leaf optical properties: new insights into plant acclimation to solar UV radiation. Plant Physiol. Biochem. 93, 94-100. [ Links ]
Berli, F.J., Moreno, D., Piccoli, P., Hespanhol-Viana, L., Silva, M.F., Bressan-Smith, R., Cavagnaro, J.B. & Bottini, R. (2010) Abscisic acid is involved in the response of grape (Vitis vinifera L.) cv. Malbec leaf tissues to ultraviolet-B radiation by enhancing ultraviolet-absorbing compounds, antioxidant enzymes and membrane sterols. Plant Cell Environ. 33, 1-10. [ Links ]
Bertamini, M. & Nedunchezhian, N., 2003. Photosynthetic functioning of individual grapevine leaves (Vitis vinifera L. cv. Pinot noir) during ontogeny in the field. Vitis 42, 13-17. [ Links ]
Caldwell, M.M., Ballaré, C.L., Bornman, J.F., Flint, S.D., Björn, L.O., Teramura, A.H., Kulandaivelu, G. & Tevini, M., 2003. Terrestrial ecosystems, increased solar ultraviolet radiation and interactions with other climatic change factors. Photochem. Photobiol. Sci. 2, 29-38. [ Links ]
Canu, S., Rosati, L. Fiori, M., Motroni, A., Filigheddu, R. & Farris, E. 2014. Bioclimate map of Sardinia (Italy). J MAPS 11, 711-718. [ Links ]
Cartelat, A., Cerovic, Z.G., Goulas, Y., Meyer, S., Lelarge, C., Prioul, J.-L., Barbottin, A., Jeuffroy, M.-H., Gate, P., Agati, G. & Moya. I., 2005. Optically assessed contents of leaf polyphenolics and chlorophyll as indicators of nitrogen deficiency in wheat (Triticum aestivum L.). Field Crops Res. 9, 35-49. [ Links ]
Castagna, A., Csepregi, K., Neugart, S. Zipoli, G., Vecefová, Jakab G., Jug, T. Llorens L.,Martínez-Abaigar, Martínez-Lüscher, Núnez-Olivera, E., Ranieri A., Schoedl-Hummel, Schreiner, M., Teszlák, P., Tittmann S., Urban, O., Verdaguer, D., Jansen, M. & Hideg, E., 2017. Environmental plasticity of Pinot noir grapevine leaves: A trans-European study of morphological and biochemical changes along a 1,500-km latitudinal climatic gradient. Plant Cell Environm. 40, 2790-2805. [ Links ]
Cerovic, Z.G., Masdoumier, G., Ben Ghozlen, N. & Latouche, G., 2012. A new optical leaf-clip meter for simultaneous non-destructive assessment of leaf chlorophyll and epidermal flavonoids. Physiol. Plant. 146, 251-260. [ Links ]
Chaves, M.M, Zarrouk, O., Francisco, R., Costa, J.M., Santos, T., Regalado, A.P., Rodrigues, M.L. & Lopes, C.M., 2010. Grapevine under deficit irrigation: hints from physiological and molecular data. Ann. Bot. 105, 661676. [ Links ]
Chouzouri, A. & Schultz, H.R., 2005. Hydraulic anatomy, cavitation susceptibility and gas-exchange of several grapevine cultivars of different geographic origin. Acta Hort. 689, 325-331. [ Links ]
Cramer, G.R, 2010. Abiotic stress and plant responses from the whole vine to the genes. Aust. J. Grape Wine Res. 16, 86-93. [ Links ]
Dal Santo, S., Palliotti, A., Zenoni, S., Tornielli, G.B., Fasoli, M., Paci, P., Tombesi, S., Frioni, T., Silvestroni, O., Bellincontro, A., d'Onofrio, C., Matarese, F. Gatti, M., Poni, S. & Pezzotti, M. 2016. Distinct transcriptome responses to water limitation in isohydric and anisohydric grapevine cultivars. BMC Genomics 17: 815. [ Links ]
Del-Castillo-Alonso, M.Á., Diago, M.P., Tomás-Las-Heras, R., Monforte, L., Soriano, G., Martínez-Abaigar, J. & Núnez-Olivera, E., 2016. Effects of ambient solar UV radiation on grapevine leaf physiology and berry phenolic composition along one entire season under Mediterranean field conditions. Plant Physiol. Biochem. 109, 374-386. [ Links ]
Deluc, L.G., Quilici, D.R., Decendit, A., Grimplet, J., Wheatley, M.D., Schlauch, K.A., Merillon, J.M, Cushman, J.C. & Cramer, G.R., 2009. Water deficit alters differentially metabolic pathways affecting important flavor and quality traits in grape berries of Cabernet Sauvignon and Chardonnay. BMC Genom. 10, 212 [ Links ]
Doupis, G., Chartzoulakis, K., Beis, A. & Patakas, A., 2011. Allometric and biochemical responses of grapevines subjected to drought and enhanced ultraviolet-B radiation. Aust. J. Grape Wine Res. 17, 36-42. [ Links ]
Düring, H., 1998. Photochemical and non-photochemical responses of glasshouse-grown grape to combined light and water stress. Vitis 37, 1-4. [ Links ]
EEA, 2009. Water resources across Europe - Confronting water scarcity and drought. European Environment Agency, Copenhagen, Denmark. [ Links ]
Feller, U., 2016. Drought stress and carbon assimilation in a warming climate: Reversible and irreversible impacts. J. Plant Physiol. 203, 84-94. [ Links ]
Fernandes de Oliveira, A. & Nieddu, G., 2016a. Accumulation and partitioning of anthocyanins in two red grape cultivars under natural and reduced UV solar radiation. Aust. J. Grape Wine Res. 22, 96-104. [ Links ]
Fernandes de Oliveira, A. & Nieddu, G., 2016b. Vine growth and physiological performance of two red grape cultivars under natural and reduced UV solar radiation. Aust. J. Grape Wine Res. 22, 105-113. [ Links ]
Fernandes de Oliveira, A., Mameli, M.G., De Pau, L., Satta, D. & Nieddu, G., 2013. Deficit irrigation strategies in Vitis vinifera L. cv. Cannonau under Mediterranean climate. Part I - Physiological responses, growth-yield balance and berry composition. S. Afr. J. Enol. Vitic. 34, 170-183. [ Links ]
Fernandes de Oliveira, A., Mercenaro, L. Azzena, M. & Nieddu, G. 2019. Effects of pre and post-veraison water deficit on Vermentino cluster microclimate and berry composition. BIO Web Conf. 13, 04015. [ Links ]
Fernandes de Oliveira, A., Mercenaro, L. & Nieddu, G., 2017. Assessing thermal efficiency for berry anthocyanin accumulation in four different sites and field-growing conditions. Acta Hortic. 1188, 181-188. [ Links ]
Fernandes de Oliveira, A., Mercenaro, L., Del Caro, A., Pretti, L. & Nieddu, G., 2015. Distinctive anthocyanin accumulation responses to temperature and natural UV radiation of two field-grown Vitis vinifera L. cultivars. Molecules 20, 2061-2080. [ Links ]
Flexas, J. & Medrano, H., 2002. Drought-inhibition of photosynthesis in C3 plants: Stomatal and non-stomatal limitations revisited. Ann. Bot. 89, 183-189. [ Links ]
Flexas, J., Hendrickson, L. & Chow, W.S., 2001. Photoinactivation of photosystem II in high light-acclimated grapevines. Aust. J. Plant Physiol. 28, 755-764. [ Links ]
Flick, S.E. & Hijmans R.J. 2017. WorldClim 2: new 1-km spatial resolution climate surfaces for global land areas. Int. J. Climatol. 37, 4302-4315. [ Links ]
Goulas, Y., Cerovic, Z.G., Cartelat, A. & Moya, I., 2004. Dualex: A new instrument for field measurements of epidermal ultraviolet absorbance by chlorophyll fluorescence. Appl. Opt. 43, 4488-4496. [ Links ]
Grifoni, D., Agati, G., Bussotti, F., Michelozzi M., Pollastrini, M. & Zipoli, G., 2016. Different responses of Arbutus unedo and Vitis vinifera leaves to UV filtration and subsequent exposure to solar radiation. Environ. Exp. Bot. 128, 1-10. [ Links ]
Hugalde, I.P. & Vila, H., 2018. Isohydric or anisohydric behaviour in grapevine ... a never-ending controversy? Rev. Investig. Agropecu. 39(1), 7 pp. [ Links ]
IPCC, 2018. Global warming of 1.5°C. An IPCC Special Report on the impacts of global warming of 1.5°C above pre-industrial levels and related global greenhouse gas emission pathways, in the context of strengthening the global response to the threat of climate change, sustainable development, and efforts to eradicate poverty [Masson-Delmotte, V., Zhai, P., Pörtner, H.O., Roberts, D., Skea, J., Shukla, P.R., Pirani, A., Moufouma-Okia, W., Péan, C., Pidcock, R., Connors, S., Matthews, J.B.R., Chen, Y., Zhou, X., Gomis, M.I., Lonnoy, E., Maycock, T., Tignor M. and Waterfield, T. (eds.)]. In Press. [ Links ]
Kadir, S., Von Weihe, M. & Al-Khatib, K., 2007. Photochemical efficiency and recovery of photosystem ii in grapes after exposure to sudden and gradual heat stress. J. Amer. Soc. Hort. Sci. 132, 764-769. [ Links ]
Keller, M., Romero, P., Gohil H., Smithyman, R.P., Riley, W.R., Casassa, L.F & Harbertson, J. 2016. Deficit irrigation alters grapevine growth, physiology and fruit microclimate. Am. J. Enol. Vitic. 67, 426-435. [ Links ]
Kolb, C.A., Käser, M.A., Kopecký, J., Zotz, G., Riederer, M. & Pfündel, E.E., 2001. Effects of natural intensities of visible and ultraviolet radiation on epidermal ultraviolet screening and photosynthesis in grape leaves. Plant Physiol. 127, 863-875. [ Links ]
Liakopoulos, G., Nikolopoulos, D. & Karabourniotis, G., 2007. The first step from light to wine: Photosynthetic performance and photoprotection of grapevine (Vitis vinifera L.) leaves. Funct. Plant Sci. Biotechnol. 1, 112-119. [ Links ]
Lopes, C.M. & Pinto, P.A., 2005. Easy and accurate estimation of grapevine leaf area with simple mathematical models. Vitis 44, 55-61. [ Links ]
Lovisolo, C., Lavoie-Lamoureux, A., Tramontini S. & Ferrandino, A., 2016. Grapevine adaptations to water stress: New perspectives about soil/plant interactions. Theor. Exp. Plant Physiol. 28, 53-66. [ Links ]
Lovisolo, C., Perrone, I. Carra A., Ferrandino A., Flexas, J., Medrano H. & Schubert, A., 2010. Drought-induced changes in development and function of grapevine (Vitis spp.) organs and in their hydraulic and non-hydraulic interactions at the whole-plant level: A physiological and molecular update. Funct. Plant Biol. 37, 98-116. [ Links ]
Luo, H.-B., Ma, L., Xi, H.-F., Duan, W., Li, S.-H., Loescher, W., Wang, J.-F. & Wang, L.-J., 2011. Photosynthetic responses to heat treatments at different temperatures and following recovery in grapevine (Vitis amurensis L.) leaves. PLoS ONE 6: e23033. [ Links ]
Martínez-Lüscher, J., Morales, F., Delrot, S., Sánchez-Díaz, M., Goméa, E., Aguirreolea, J. & Pascual, I., 2013. Short- and long-term physiological responses of grapevine leaves to UV-B radiation. Plant Sci. 213, 114-122. [ Links ]
Morales, L.O., Brosché, M., Vainonen, J., Jenkins, G.I., Wargent, J.J., Sipari, N., Strid, Α., Lindfors, A.V., Tegelberg, R. & Aphalo, P.J., 2013. Multiple roles for UV RESISTANCE LOCUS8 in regulating gene expression and metabolite accumulation in Arabidopsis under solar ultraviolet radiation. Plant Physiol. 161, 744-759. [ Links ]
Myburgh, P.A., 2011. Responses of Vitis vinifera L. cv. Merlot to low frequency deficit irrigation and partial root zone drying in western Cape Coast region - Part I. Soil and plant water status. S. Afr. J. Enol. Vitic. 32, 89-103. [ Links ]
Palliotti, A. & Poni, S., 2016. Grapevine under light and heat stresses. In: Gerós, H., Chaves, M.M., Medrano, H.G. & Delrot, S. (eds). Grapevine in a changing environment: A molecular and ecophysiological perspective. John Wiley & Sons, Ltd, Chichester, UK. pp. 148 - 178. [ Links ]
Poni, S., Gatti, M., Palliotti, A., Dai, Z., Duchêne, E., Truong, T-T., Ferrara, G., Matarrese, A.M.S., Gallotta, A., Bellincontro, A., Mencarelli, F. & Tombesi, S., 2018. Grapevine quality: A multiple choice issue. Sci. Hortic. 234, 445-462. [ Links ]
Potters, G., Jansen, M.A.K., Guisez, Y. & Pasternak, T., 2006. Stress drives plant cells to take the road towards embryogenesis. In: Teixeira da Silva, J.A. (ed). Floriculture, ornamental and plant biotechnology, advances and topical issues, vol. 2. Global Science Books Ltd., London. pp. 289 - 294. [ Links ]
Rogiers, S.Y., Greer, D.H., Hutton, R.J. & Landsberg, J.J., 2009. Does night-time transpiration contribute to anisohydric behaviour in a Vitis vinifera cultivar? J. Exp. Bot. 60, 3751-3763. [ Links ]
Sade, N., Gebremedhin, A. & Moshelion, M., 2012. Risk-taking plants. Plant Signal Behav, 7, 767-770. [ Links ]
Sanchez-Lorenzo, A., Enriquez-Alonso, A., Calbó, J., Gonzalez, J.-A., Wild, M., Folini, D., Norris, J.R. & Vicente-Serrano, S.M., 2017. Fewer clouds in the Mediterranean: Consistency of observations and climate simulations. Sci. Rep. 7, Art. No. 41475. [ Links ]
Schultz, H.R., 2003. Differences in hydraulic architecture account for nearisohydric and anisohydric behaviour of two field-grown Vitis vinifera L. cultivars during drought. Plant, Cell Environ. 26, 1393-1405 [ Links ]
Sebela, D., Turóczy, Z., Olejnícková, J., Kumsta, M. & Sotoláf R., 2017. Effect of ambient sunlight intensity on the temporal phenolic profiles of Vitis vinifera L. cv. Chardonnay during the ripening season - A field study. S. Afr. J. Enol. Vitic. 38(1), 94-102. [ Links ]
Smart, R.E. & Robinson, M., 1991. Sunlight into wine. A handbook for winegrape canopy management. Winetitles, Adelaide, SA, Australia. [ Links ]
Soar, C.J., Speirs, J., Maffei, S.M., Penrose, A.B., McCarthy, M.G. & Loveys, B.R., 2006. Grapevine varieties Shiraz and Grenache differ in their stomatal response to VPD: Apparent links with ABA physiology and gene expression in leaf tissue. Aust. J. Grape Wine Res. 12, 2-12. [ Links ]
Strasser, R.J., Tsimilli-Michael, M. & Srivastava, A., 2004. Analysis of the fluorescence transient. In: Papageorgiou G.C. & Govindjee (eds). Advances in photosynthesis and respiration series. Chlorophyll fluorescence: A signature of photosynthesis. Springer, Dordrecht, The Netherlands. p. 321 - 362. [ Links ]
Teramura, A.H. & Sullivan J.H. 1991. Potential impacts of increased solar UV-B on global plant productivity. Photobiology, 625-634. [ Links ]
Wahid, A., Gelani, S., Ashraf, M. & Foolad, M.R., 2007. Heat tolerance in plants: An overview. Environ. Exp. Bot. 61, 199-223. [ Links ]
Wild, M., Folini, D., Henschel, F., Fischer, N. & Müller, B., 2015. Projections of long-term changes in solar radiation based on CMIP5 climate models and their influence on energy yields of photovoltaic systems. Sol. Energy 116, 12-24. [ Links ]
Xu, H., Liu, G., Liu, G., Yan, B., Duan, W., Wang, L. & Li, S., 2014. Comparison of investigation methods of heat injury in grapevine (Vitis) and assessment to heat tolerance in different cultivars and species. BMC Plant Biol., 14:156. [ Links ]
Young, P.R., Eyeghe-Bickong, H. A., Du Plessis, K., Alexandersson, E., Jacobson, D.A., Coetzee, Z., Deloire, A. & Vivier, M.A., 2016. Grapevine plasticity in response to an altered microclimate: Sauvignon blanc modulates specific metabolites in response to increased berry exposure. Plant Physiol. 170, 1235-1254. [ Links ]
Zarrouk, O., Costa, J.M., Francisco, R., Lopes C. & Chaves, M.M., 2016. Drought and water management in Mediterranean vineyards. In: Gerós, H., Chaves, M.M., Medrano, H.G. & Delrot, S. (eds). Grapevine in a changing environment: A molecular and ecophysiological perspective. John Wiley & Sons, Ltd, Chichester, UK. pp. 38 - 67. [ Links ]
Zlatev, S.Z., Lidon F.J.C. & Kaimakanova, M., 2012. Plant physiological responses to UV-B radiation. Emir. J. Food Agric. 24, 481-501. [ Links ]
Submitted for publication: September 2018
Accepted for publication: March 2019
* Corresponding author: E-mail address: acortez@uniss.it
Acknowledgements: The authors thank Dr Mario Santona, for technical support on vineyard management, and Mr Vincenzo Pani, Ms Marietta Leri and Mr Giuseppe Ginesu, for experimental tunnel installation and help with the vineyard management practices. In addition, the authors thank GMR Strumenti, Florence, Italy, for technical support
ARTICLES
doi:https://doi.org/10.21548/40-2-3420
Potential of South African entomopathogenic nematodes to control the leaf miner, Holocacista capensis (Lepidoptera: Heliozelidae)
L.A.I. Steyn; P. Addison; A.P. Malan*
Department of Conservation Ecology and Entomology, Faculty of AgriSciences, Stellenbosch University, Private Bag X1, Matieland 7602, Stellenbosch, South Africa
ABSTRACT
The Cape grapevine leafminer, Holocacista capensis, a sporadic pest of economic importance, is found in South African table and wine grape vineyards. The cocoon casings, constructed by the final instar larvae, can be found attached to grape bunches, posing a phytosanitary risk for table grape export markets. The current study aimed to determine the susceptibility of leaf-mining H. capensis larvae to seven entomopathogenic nematode (EPN) species belonging to Steinernematidae and Heterorhabditidae. To determine nematode virulence occupied leaf-mining galleries were extracted from infested leaves and inoculated with 200 infective juveniles (IJs) in 50 μ! of distilled water, for each of the EPNs screened. Concentration assays were conducted and and lethal dose was determined for the three most virulent species (Heterorhabditis baujardi, H. indica and H. noenieputensis), using concentrations of 0, 25, 50, 100, 200, and 400 IJs/leaf-mining larva. High mortality of leaf-mining larvae was obtained with H. baujardi (92%), H. noenieputensis (85%) and H. indica (83%). Almost double the number of H. noenieputensis (34 nematodes/insect) penetrated the insect larvae, in comparison with the other two EPNs. However, the relative potency of H. baujardi was 3.56 times higher than for H. indica, whilst that of H. indica was 2.57 times higher than it was for H. noenieputensis. The results obtained in the laboratory were found to be encouraging, especially with regard to the nematodes' ability to penetrate the leaf-mining galleries, and to infect the larvae successfully.
Key words: biological control, cocoon casing, EPN, Heterorhabditis, integrated pest management, leaf miner, Steinernema
INTRODUCTION
Holocacista capensis Van Nieukerken & Geertsema (Lepidoptera: Heliozelidae) is a sporadic, multivoltine pest that occurs on most ornamental and commercial varieties of Vitis vinifera L. in South Africa. The leaf-mining larvae were first reported in 2012 in a table grape vineyard close to Paarl in the Western Cape province(Van Nieukerken & Geertsema, 2015; Torrance, 2016). To date, no insecticide has been registered against the pest. This is attributed to the fact that an effective monitoring method for use in field trials is absent, as the male attractant is not commercially available.
To avoid control strategies relying solely on harmful insecticides, a variety of biological control strategies should be studied. Hagler (2000) describes biological control as "the deliberate exploitation of a natural enemy for pest control". A wide range of economically important insect pest populations have been suppressed through the deliberate application of insect-parasitic organisms known as entomopathogens, which include entomopathogenic nematodes (EPNs) of the genera Heterorhabditis (Rhabditida: Heterorhabditidae) and Steinernema (Rhabditida: Steinernematidae) (Stock & Hunt, 2005). In South Africa, a total of 17 Steinernema and seven Heterorhabditis species have been isolated from soil surveys conducted throughout the country (Malan & Hatting, 2015; Malan & Ferreira, 2017).
The ability of an EPN and its associated symbiotic bacteria to succeed as a control agent essentially depends on four factors: moisture requirements (or desiccation tolerance, with ± 85% relative humidity being required for optimum control); optimal temperature range; susceptibility of the targeted insect; and foraging strategy (Lacey & Georgis, 2012). EPNs, which occur naturally in soils throughout the world, are able to control foliar, soil-borne, cryptic, and subterranean pests from a variety of diverse habitats (Lacey & Georgis, 2012). They are suitable for including in an integrated pest management (IPM) programme, as no secondary effects of EPNs on non-target organisms are known to exist (Wright et al., 2005). The method of cover and placement of EPNs on open surfaces (like foliar habitats) is critical, as humidity, exposure to ultraviolet light and temperature are not buffered, in contrast to those that are experienced in soil environments (Wright et al., 2005; Dito et al., 2016). The use of EPNs has been successfully implemented as a control strategy for two leaf-mining lepidopteran pests, namely the tomato leaf miner, Tuta absoluta (Meyrick) (Gelechiidae) (Batalla-Carrera et al., 2010; Gözel & Kasap, 2015; Van Damme et al., 2015; Kamali et al., 2017; Mutegi et al., 2017) and the citrus leaf miner, Phyllocnistis citrella Stainton (Gracillariidae) (Beattie et al., 1995).
Most of the studies undertaken so far on leaf-mining Lepidoptera have focused on the use of steinernematids. These studies have identified Steinernema affine Wouts, Mrácek, Gerdin & Bedding (Gözel & Kasap, 2015), Steinernema carpocapsae Wouts, Mrácek, Gerdin & Bedding (Beattie et al., 1995; Batalla-Carrera et al., 2010; Gözel & Kasap, 2015; Van Damme et al., 2015; Kamali et al., 2017), Steinernema feltiae (Filipjev) Wouts, Mrácek, Gerdin & Bedding (Batalla-Carrera et al., 2010; Gözel & Kasap, 2015; Van Damme et al., 2015), and Steinernema karii Waturu, Hunt & Reid (Mutegi et al., 2017) as successful biological control agents against a variety of leaf-mining insects. Heterorhabditis bacteriophora Poinar has been used in an attempt to control T. absoluta pest populations, although success has only been achieved under greenhouse conditions (Batalla-Carrera et al., 2010; Gözel & Kasap, 2015; Kamali et al., 2017).
The use of EPNs to control leaf-mining insects through foliar applications using adjuvants seems promising, regardless of the concerns expressed regarding humidity and temperature requirements. It is hypothesized that the protection provided by the blotch mine created by the pest insect could potentially reduce the desiccation of infective juveniles (IJs) and the extent of exposure of the individuals to ultraviolet light (Gözel & Kasap, 2015). With the exception of those conducted by Beattie et al. (1995), using S. carpocapsae against P. citrella, EPNs have not yet been successful in adequately controlling T. absoluta, another major lepidopteran leaf-mining pest, in field trials. Gözel & Kasap (2015) speculated that the requirements of the sensitive relationships existing between the selected EPN and the target pest (in terms of virulence, host-seeking strategy, and ecological factors) must be satisfied, before considering field applications. Thereafter, additional knowledge of the appropriate application strategy (i.e. field dosage, volume, irrigation, and appropriate application methods) must be considered.
The preliminary evidence, based on findings associated with other leaf-mining foliar pests, indicates that EPNs could potentially be used to control H. capensis larvae in an IPM strategy. The aim of the current study was to determine whether H. capensis larvae are susceptible to EPNs. The main objective was, therefore, to screen different local EPN species, and to test their respective virulence against H. capensis larvae under laboratory conditions.
MATERIALS AND METHODS
Source of insects
Grapevine leaves infested with H. capensis larvae were collected from farms on the outskirts of Halfmanshof (33°08'48.7"S 18°59'18.0"E), Robertson (33°50'19.6"S 19°54'52.7"E), Klapmuts (33°49'30.3"S 18°55'36.8"E), and Paarl (33°40'20.4"S 18°56'25.0"E). Field-collected larvae were stored at 10 °C before being counted and used in EPN screening trials within 24 h after collection (pilot trials indicated high levels of mortality when the experiments were not carried out on the same day that collection took place).
Once collected from the field, each leaf was examined, with the aid of a stereomicroscope, for the presence of active/ feeding H. capensis larvae. Occupied mines (each containing a single larva) were carefully cut out from the collected leaves, so as to avoid any cuts or tears of the epidermal layers of the leaf surrounding the larva. A margin of 2 to 5 mm of unmined leaf tissue was maintained around the entire leaf-mining gallery. Approximately 2 340 feeding larvae were manually processed in this manner for the experiments conducted in this study (excluding mines that were damaged in the cutting process and leaves examined that contained deceased larvae). Larvae collected for the screening tests were of different ages, as it was not possible to determine the age or instar without damaging the larvae or their galleries.
Source of EPNs
The seven EPN species that were tested for virulence against H. capensis larvae were obtained from the collection housed in the Department of Conservation Ecology and Entomology, Stellenbosch University (Table 1). Prior to screening, modified White's traps were used to collect the IJs cultured from EPN-inoculated larvae of Galleria mellonella L. (Lepidoptera: Pyralidae), otherwise known as greater wax moth (Kaya & Stock, 1997). More specifically, 10 G. mellonella larvae were placed in a Petri dish (90 mm diameter) lined with filter paper, and inoculated with 800 μl solution of an EPN suspension. The Petri dish was stored in a growth chamber at 25 °C. Transferral of the G. mellonella cadavers to clean Petri dishes, lined with moist filter paper, occurred 48 hours later. After 7 to 10 days, the Petri dish containing the dead larvae was placed on a modified White's trap to facilitate the collection of the emerging IJs (White, 1927). The IJ suspensions were harvested and transferred to vented culture flasks. The flasks were stored at 14 °C in a dark growth chamber, before being used in the screening tests.
Virulence assays for Holocacista capensis larvae
The virulence of each EPN species (Table 1) to H. capensis larvae was tested at a concentration of 200 IJs/50 μl of distilled water per larva, while the controls were inoculated with 50 μl of distilled water only, using 24-well bioassay plates (Flat-bottom, Nunc™, Cat. no. 144530) as the test arena. Ten wells within each bioassay plate were lined with a circular piece of filter paper (13 mm diameter), placed in alternate wells, to obtain an even distribution throughout the plate. Each of the selected wells was inoculated with 200 IJs/50 μl of distilled water, using a separate Eppendorf® micropipette (www.eppendorf.com) for each EPN species. An occupied leaf mine (containing a single live/feeding H. capensis larva) was added to each inoculated well. The lid of the bioassay plate was secured in place with a rubber band. Three replicate plates were used for each of the EPN species tested (n = 30 occupied leaf mines/treatment). The plates were stored in 2 L plastic containers lined with moistened tissue paper (to maintain high humidity levels) and placed in a growth chamber at 25 °C for 48 h. Thereafter, the H. capensis larvae were removed from the leaf mines and larval mortality was determined. The experiment was repeated, using a fresh batch of cultured IJs and leaf-mining larvae, on a subsequent date.
Penetration analysis
Dead larvae from the virulence assays were placed in a clean Petri dish (90 mm diameter) lined with filter paper. The Petri dishes were placed in moistened 2 L plastic containers, and transferred back to the 25 °C growth chamber for a further 24 h. Thereafter, the number of IJs that had penetrated each larva was recorded by means of dissection with the aid of a stereomicroscope.
Lethal dose
The three most virulent EPN species from the previous experiments, namely Heterorhabditis baujardi Phan, Subbotin, Nguyen & Moens, Heterorhabditis indica Poinar, Karunakar & David, and Heterorhabditis noenieputensis Malan, Knoetze & Tiedt were used to determine their respective lethal concentrations. EPN concentrations of 0, 25, 50, 100, 200, and 400 IJs/larva were tested against H. capensis. Again, 24-well plates were used as the test arena, with each containing 10 alternately placed leaf mines enclosing a single live/feeding H. capensis larva. Three 24-well plates (n = 30) were used for each EPN concentration of each treatment.
Similar to the experimental procedure that was previously adopted (as described for the virulence assays), pieces of filter paper (13 mm diameter) were placed in 10 alternate wells, to which the occupied leaf mines were added. Thereafter, the leaf mines were inoculated with the various concentrations of IJs in 50 μ! of distilled water. Distilled water only was used for the untreated control treatments. The plates for each treatment were placed in a 2 L plastic container lined with moist tissue paper, and kept in a growth chamber at 25 °C. After 48 h, the larvae were removed from the mines and the percentage mortality of infected H. capensis larvae was determined visually, by dissection, and recorded.
Data analysis
All analyses were performed using STATISTICA 13.0 (Dell Inc., Headquarters in Round Rock, Texas, USA). If no significant difference in test date versus treatment interactions was recorded as the main effects in a two-way ANOVA, the data from the various test dates were pooled and analysed using a one-way ANOVA to identify the most virulent EPN species. A Fisher LSD post-hoc test was performed to determine significant differences between means. To confirm the differences in mortality between IJ doses within each species a one-way ANOVA and a Fisher LSD post-hoc test, by group (nematode species), was conducted. The recorded penetration data of IJs found within the H. capensis larvae 72 h after inoculation were analysed with a one-way ANOVA and a Fisher LSD post-hoc test. Correlation analyses, a factorial ANOVA, and a Fisher LSD post-hoc test were conducted to compare the effect of dose among the different EPNs tested. To determine the lethal doses of the three most virulent EPN species, a probit analysis (Finney, 1952) was carried out on mortality data, using Polo PC (LeOra Software, 1987).
RESULTS
Virulence assays for Holocacista capensis larvae
Screening trials showed that the IJs were capable of penetrating occupied, undamaged leaf-mining galleries and of infesting the leaf-mining H. capensis larvae within 48 h after inoculation (Fig. 1). Analysis of the pooled data, and the subsequent multiple comparisons test, showed that all of the screened EPN species caused significantly higher mortality of the H. capensis larvae than the untreated control (F743 = 56.099; P < 0.001). The mortality (infection) associated with H. bacteriophora (26.67% ± 4.94%) and Steinernema jeffreyense Malan, Knoetze & Tiedt (28.33% ± 4.77%) was the lowest and did not differ significantly (P = 0.804). The natural mortality of the control treatment was close to zero (Fig. 1). Heterorhabditis baujardi (91.67% ± 3.07%), H. indica (83.33% ± 7.60%) and H. noenieputensis (85.00% ± 4.28%) caused the highest H. capensis larval mortality. The three treatments did not differ significantly from each other (P > 0.2). The virulence of Heterorhabditis zealandica Poinar (38.33% ± 7.03%) did not differ significantly from that of H. bacteriophora (P = 0.088), S. jeffreyense (P = 0.142), or Steinernema yirgalemense Nguyen, Tesfamariam, Gozel, Gaugler & Adams (50.00% ± 2.58%) (P = 0.088).
Penetration analysis
The mean number of IJs that penetrated H. capensis larvae differed significantly between the screened EPN species (F635 = 13.157; P < 0.001) (Fig. 2). The highest mean penetration was achieved by H. noenieputensis (34.27 ± 6.94), which differed significantly from that of H. baujardi (18.23 ± 2.90) (P = 0.002) and H. indica (17.02 ± 3.98) (P = 0.001). The lowest mean penetration of 1.45 (± 0.33) was achieved by S. jeffreyense, which did not differ significantly from H. bacteriophora (2.72 ± 0.82) (P = 0.789), H. zealandica (4.13 ± 1.61) (P = 0.571), and S. yirgalemense (4.97 ± 1.10) (P = 0.458).
Lethal dose
A positive correlation between the dosage and lethal capacity of the EPN species was recorded (r = 0.783) (Fig. 3). As the natural mortality in the untreated control (< 6.67%) was significantly different from all other doses (P < 0.01), the control treatment was removed from the analysis to appropriately gauge differences in infection between the treatments and the respective doses. The mortality recorded for the 25, 50 and 400 IJ/larva treatments did not differ significantly between the EPN species tested (P > 0.05). The 100 IJ and 200 IJ treatments, however, differed between H. baujardi and H. noenieputensis (P = 0.016 and P = 0.0375, respectively) (Fig. 3). No significant effect of dose was recorded for the H. indica treatments (P > 0.05).
For all of the EPN species tested, the highest insecticidal activity was reached at 400 IJs/larva, although mortality did not differ significantly between the 100, 200 and 400 IJ/larva treatments (P > 0.5) for each respective species.
The probit analysis indicated that the slopes and the intercepts of the regression lines for the three EPN species, H. baujardi, H. indica and H. noenieputensis, differed significantly (χ2= 36.835, P < 0.01, df = 4). Their slopes were, however, constrained (i.e. parallel) (χ2 = 4.451; P = 0.108, df = 2). Trends in lethal capacity differed slightly for each of the EPN species, as indicated by the probit regression lines for the three heterorhabditids (y = 1.6957x + 2.7918, y = 0.8126x + 3.8453, and y = 0.8269x + 3.4043, respectively) (Fig. 4).
Heterorhabditis baujardi exhibited the lowest LD50 and LD90 values (9.69 and 94.37 IJs/larva, respectively), whereas H. noenieputensis had the highest LD50 and LD90 values C88.51 and 1517.60 IJs/larva, respectively) (Table 2). The relative potency of H. baujardi was 3.56 times higher than that of H. indica, whereas H. indica was 2.57 times more potent than H. noenieputensis (Table 3).
DISCUSSION
EPNs regulate insect populations by using an insect as a host for reproduction and breeding purposes (Griffin et al., 2005). The application of different obligate, parasitic EPN species in conjunction with other chemical, cultural and physical control strategies, can be used to control leaf-mining insects. The current study aimed to determine whether local EPNs could potentially be used as biological control agents to aid in the control of H. capensis, a foliar pest of commercial table grapes in South Africa. High virulence would allow for the inclusion of EPN applications (after the necessary field trials) in an integrated approach for the control of this phytosanitary pest. The present study is the first to consider the use of biological control strategies against H. capensis, using locally isolated EPNs.
All of the local EPN species tested caused a significant increase in the larval mortality of H. capensis, compared to the untreated control. Three of the EPN species, namely H. indica, H. noenieputensis and H. baujardi, yielded excellent results (83%, 85% and 91% larval mortality, respectively) in relation to virulence and the ability to penetrate leaf-mining galleries. Assessing these isolates in field trials to confirm virulence under field conditions is, therefore, highly recommended. The other EPN species tested caused between 26% and 50% larval mortality. Virulence did not differ significantly between the EPN species tested at lower doses, with differences only becoming apparent at doses of 100 IJs/larva and more. In a similar study by Van Damme et al. (2015), S. feltiae and S. carpocapsae caused the highest mortality of T. absoluta for all larval stadia pooled (79% and 80%, respectively), whereas H. bacteriophora (60%) did not perform as well.
Bastidas et al. (2014) identified the importance of the size of the target insect, as well as that of the EPN species used against it. They found that although all the steinernematids screened were able to invade small insect hosts, the invasion potential decreased as the target insect's size decreased and the EPN species' size increased. This was confirmed in a study by Katumanyane et al. (2018), where large South African EPN species (> 1000 μm), like Steinernema khoisanae Nguyen, Malan & Gozel, S. jeffreyense and Steinernema litchii Steyn, Knoetze, Tiedt & Malan caused almost zero control of another micro-insect, Bradysia impatiens Johannsen (Diptera: Sciaridae). The effect of the size of the nematodes compared to that of the host was confirmed in Dlamini's (2018) study on Frankliniella occidentalis (Thysanoptera: Thripidae). The high virulence and relatively high penetration potential recorded for H. indica, H. noenieputensis, and H. baujardi in the present study might be attributed to their relatively small body size. Comparatively small hosts are speculated to limit the development of the invading nematodes, while the presence of relatively large hosts is necessary for the long-term persistence ofthe nematodes (Bastidas et al., 2014). This raises concerns regarding adequate and persistent control of H. capensis under field conditions. As the three most virulent species in the current study were heterorhabditids, the possession of a dorsal tooth (which is generally absent in steinernematids) might possibly also have facilitated the penetration of the leaf-mining larvae (Griffin et al., 2005).
The probit analysis indicated a positive relationship between total larval mortality and IJ concentration/dose for all EPN species tested (i.e. the larval mortality increased with the increase in dose). When considering H. baujardi, H. indica, and H. noenieputensis as potential biological control agents, it is important to note that H. baujardi proved to be just over three times more potent than H. indica, with a lower number of IJs required to attain a lethal dose of 90% of larvae than for H. indica. In turn, H. indica was just more than twice as potent as H. noenieputensis. Based on the results of this study, these three species should be tested under field conditions for the control of H. capensis. In addition, they should also be tested against other economically important leaf-mining insects, like T. absoluta and P. citrella.
To enable as many IJs as possible to locate the mine entrance of a leaf-mining insect, Wright et al. (2005) emphasised the need to maximise the density and distribution of EPNs on the leaf surfaces. As a nematode's residual infectivity generally lasts only a few hours, appropriate cover and placement is critical in foliar applications of EPNs that are targeted at controlling leaf-mining insects (Wright et al., 2005). The importance of sufficient cover and placement is further underscored by the fact that limited migration opportunities exist to compensate for suboptimal placement, which is made even more acute in the dry summer conditions of the Western Cape province. The need to apply foliar and aerial EPN treatments for a variety of pests that persist above the soil surface has necessitated the study of various adjuvants for maintaining suitable conditions, to ensure the longevity of the IJs on field-treated crops. The addition of adjuvants to various EPN species solutions proved to be positive against codling moth (De Waal et al., 2013), citrus mealybug (Van Niekerk & Malan, 2015), wheat stem sawfly (Portman et al., 2016), and vine mealybug (Platt et al., 2018; 2019).
Several other South African table grape pests (Allsopp et al., 2015) have been shown to be susceptible to EPNs, including Planococcus ficus (Signoret) (Hemiptera: Pseudococcidae) (Le Vieux & Malan, 2013), Phlyctinus callosus (Schönherr) (Coleoptera: Curculionidae) (Ferreira & Malan, 2014), and Thaumatotibia leucotreta (Meyrick) (Lepidoptera: Tortricidae) (Malan & Moore, 2016; Steyn, 2019). It would be ideal if the same EPN species could be used against all of these pests. Alternatively, a combination of EPNs could be developed for foliar application to target the leaf-miner and these other pests simultaneously.
Appropriate mass-rearing techniques and formulations with suitable adjuvants still need to be developed for the area-wide use of local EPNs in commercial vineyards. Advances in improving the method of mass-rearing heterorhabditid colonies (by means of improving solid-state and liquid cultures) should facilitate the future use of the successful candidates identified in the present study on a commercial scale (Ehlers et al., 2000; Ferreira & Malan, 2014).
CONCLUSIONS
This study identified three locally sourced EPNs, namely H. baujardi, H. indica, and H. noenieputensis, as potential biological control agents for the Cape grapevine leafminer, H. capensis, in South Africa. It provides a baseline for further research regarding the targeted control of H. capensis larvae with EPNs. Field trials should aim to determine the frequency of EPN applications required under field conditions, as well as optimal EPN concentrations and appropriate application techniques. The adoption of biological control measures for the integrated control of H. capensis would serve not only to minimise the risk of developing insecticide resistance in pest populations, but it would also pose less of a risk to human well-being and longevity.
LITERATURE CITED
Abate, B.A., Slippers, B., Wingfield, M.J., Malan, A.P. & Hurley, B.P., 2018. Diversity of entomopathogenic nematodes and their symbiotic bacteria in South African plantations and indigenous forests. Nematology 20, 355 -371. doi:10.1163/15685411-00003144 [ Links ]
Allsopp, E., Barnes, B.N., Blomefield, T.L. & Pringle, K.L., 2015. Grapevine. In: Prinsloo, G.L. & Uys, V.M. (eds). Insects of Cultivated Plants and Natural Pastures in Southern Africa, Entomological Society of Southern Africa, Pretoria. pp. 420 - 437. [ Links ]
Bastidas, B., Portillo, E. & San-Blas, E., 2014. Size does matter: the life cycle of Steinernema spp. in micro-insect hosts. J. Invertebr. Pathol. 121, 46 - 55. doi:10.1016/j.jip.2014.06.010 [ Links ]
Batalla-Carrera, L., Morton, A. & García-Del-Pino, F., 2010. Efficacy of entomopathogenic nematodes against the tomato leafminer Tuta absoluta in laboratory and greenhouse conditions. BioControl 55, 523 - 530. doi:10.1007/s10526-010-9284-z [ Links ]
Beattie, G.A.C., Somsook, V., Watson, D.M., Clift, A.D. & Jiang, L., 1995. Field evaluation of Steinernema carpocapsae (Weiser) (Rhabditida: Steinernematidae) and selected pesticides and enhancers for control of Phyllocnistis citrella Stainton (Lepidoptera: Gracillariidae). Aust. J. Entomol. 34, 335 - 342. doi:10.1111/j.1440-6055.1995.tb01351.x [ Links ]
De Waal, J.Y., Malan, A.P. & Addison, M.F., 2013. Effect of humidity and a superabsorbent polymer formulation on the efficacy of Heterorhabditis zealandica (Rhabditida: Heterorhabditidae) to control codling moth, Cydia pomonella (L.) (Lepidoptera: Tortricidae). Biocontrol Sci. Techn. 23, 62 -78. doi:10.1080/09583157.2012.736472 [ Links ]
Dito, D.F., Shapiro-Ilan, D.I., Dunlap, C.A., Behle, R.W. & Lewis, E.E., 2016. Enhanced biological control potential of the entomopathogenic nematode, Steinernema carpocapsae, applied with a protective gel formulation. Biocontrol Sci. Techn. 26: 835 - 848. doi: 10.1080/09583157.2016.1159659 [ Links ]
Dlamini, T.M., 2018. Prospects for using entomopathogenic nematodes as a biocontrol agent against western flower thrips Frankliniella occidentalis (Thysanoptera: Thripidae). MSc thesis, Stellenbosch University, Private Bag X1, 7602 Matieland (Stellenbosch), South Africa. [ Links ]
Ehlers, R.U., Niemann, I., Hollmer, S., Strauch, O., Jende, D., Shanmugasundaram, M., Mehta, U.K., Easwaramoorthy, S.K. & Burnell, A., 2000. Mass production potential of the bacto-helminthic biocontrol complex Heterorhabditis indica - Photorhabdus luminescens. Biocontrol Sci. Techn. 10: 607 - 616. doi:10.1080/095831500750016406 [ Links ]
Ferreira, T. & Malan, A.P., 2014. Potential of entomopathogenic nematodes for the control of the banded fruit weevil, Phlyctinus callosus (Schönherr) (Coleoptera: Curculionidae). J. Helminthol. 88, 293 - 301. doi:10.1017/ S0022149X13000175 [ Links ]
Finney D.J., 1952. Probit Analysis. Cambridge University Press, London. [ Links ] Gözel, Ç. & Kasap, 1., 2015. Efficacy of entomopathogenic nematodes against the tomato leafminer, Tuta absoluta (Meyrick) (Lepidoptera: Gelechiidae) in tomato field. Turk. Entomol. Derg. 39, 229 - 237. doi:10.16970/ted.84972 [ Links ]
Griffin, C.T., Boemare, N.E. & Lewis, E.E., 2005. Biology and behaviour. In: Grewal, P.S., Ehlers, R.-U. & Shapiro-Ilan, D.I. (eds). Nematodes as Biocontrol Agents, CABI Publishing, Wallingford. pp. 47 - 64. [ Links ]
Hagler, J.R., 2000. Biological control of insects. In: Rechcigl, J.E. & Rechcigl, N.A. (eds). Insect Pest Management: Techniques for Environmental Protection, CRC Press LLC, Florida. pp. 207 - 242. [ Links ]
James, M., Addison, P. & Malan, A.P., 2018. Surveying and screening South African entomopathogenic nematodes for the control of the Mediterranean fruit fly, Ceratitis capitata (Wiedemann). Crop Prot. 105, 41 - 48. doi:10.1016/j.cropro.2017.11.008 [ Links ]
Kamali, S., Karimi, J. & Koppenhöfer, A.M., 2017. New insight into the management of the tomato leaf miner, Tuta absoluta (Lepidoptera: Gelechiidae) with entomopathogenic nematodes. J. Econ. Entomol. 111, 112 - 119. doi:10.1093/jee/tox332 [ Links ]
Katumanyane, A., Ferreira, T. & Malan, A.P., 2018. Potential use of local entomopathogenic nematodes to control Bradysia impatiens (Diptera: Sciaridae) under laboratory conditions. Afr. Entomol. 26, 337 - 349. doi:10.4001/003.026.0337 [ Links ]
Kaya, H.K. & Stock, S.P., 1997. Techniques in insect nematology. In: Lacey, L.A. (ed.). Manual of Techniques in Invertebrate Pathology, Academic Press, San Diego, California. pp. 281 - 324. [ Links ]
Lacey, L.A. & Georgis, R., 2012. Entomopathogenic nematodes for control of insect pests above and below ground with comments on commercial production. J. Nematol. 44, 218 - 225. [ Links ]
LeOra Software. 1987. POLO-PC: A user's guide to probit or logit analysis. LeOra Software. Berkeley, CA. [ Links ]
Le Vieux, P.D. & Malan, A.P., 2013. An overview of the vine mealybug (Planococcus ficus) in South African vineyards and the use of entomopathogenic nematodes as potential biocontrol agent. S. Afr. J. Enol. Vitic. 34, 108 - 118. [ Links ]
Malan, A.P. & Ferreira, T., 2017. Entomopathogenic nematodes. In: Fourie, H., Spaull, V.W., Jones, R.K., Daneel, M.S. & De Wale, D. (eds). Nematology in South Africa: a view from the 21st Century, Springer International, Berlin. pp. 459 - 480. [ Links ]
Malan, A.P. & Hatting, J.L., 2015. Entomopathogenic nematode exploitation: case studies in laboratory and field applications from South Africa. In: Campos-Herrera, R. (ed.). Nematode Pathogenesis of Insects and Other Pests, Springer International Publishing, Basel. pp. 477 - 508. [ Links ]
Malan, A.P., Knoetze, R. & Moore, S.D., 2011. Isolation and identification of entomopathogenic nematodes from citrus orchards in South Africa and their biocontrol potential against false codling moth. J. Invertebr. Pathol 108, 115 - 125. doi:10.1016/j.jip.2011.07.006 [ Links ]
Malan, A.P., Knoetze, R. & Tiedt, L.R., 2014. Heterorhabditis noenieputensis n. sp. (Rhabditida: Heterorhabditidae), a new entomopathogenic nematode from South Africa. J. Helminthol. 88, 139 - 151. doi:10.1017/ S0022149X12000806 [ Links ]
Malan, A.P., Knoetze, R. & Tiedt, L.R., 2016. Steinernema jeffreyense n. sp. (Rhabditida: Steinernematidae), a new entomopathogenic nematode from South Africa. J. Helminthol. 90, 262 - 278. doi:10.1017/ S0022149X15000097 [ Links ]
Malan, A.P. & Moore, S.D., 2016. Evaluation of local entomopathogenic nematodes for the control of false codling moth, Thaumatotibia leucotreta (Meyrick, 1913), in a citrus orchard in South Africa. Afr. Entomol. 24, 489 - 501. doi:10.4001/003.024.0489 [ Links ]
Malan, A.P., Nguyen, K. & Addison, M., 2006. Entomopathogenic nematodes (Steinernematidae and Heterorhabditidae) from the southwestern parts of South Africa. Afr. Plant Prot. 12, 65 - 69. [ Links ]
Mutegi, D.M., Kilalo, D., Kimenju, J.W. & Waturu, C., 2017. Pathogenicity of selected native entomopathogenic nematodes against tomato leaf miner (Tuta absoluta) in Kenya. World J. Agric. Res. 5, 233 - 239. doi:10.12691/ wjar-5-4-5 [ Links ]
Platt, T., Stokwe, N.F. & Malan, A.P., 2018. Potential of local entomopathogenic nematodes for control of the vine mealybug, Planococcus ficus. S. Afr. J. Enol. Vitic. 39, 208 - 215. doi: 10.21548/39-2-3158 [ Links ]
Platt, T., Stokwe, N.F. & Malan, A.P., 2019. Foliar application ofSteinernema yirgalemense to control Planococcus ficus: assessing adjuvants to improve efficacy. S. Afr. J. Enol. Vitic. 40, 13 - 19. doi:10.21548/40-1-2920 [ Links ]
Portman, S.L., Krishnankutty, S.M. & Reddy, G.V.P., 2016. Entomopathogenic nematodes combined with adjuvants presents a new potential biological control method for managing the wheat stem sawfly, Cephus cinctus (Hymenoptera: Cephidae). PLoS ONE 11. doi:10.1371journal.pone.0169022. [ Links ]
Steyn, V.M., 2019. Integrated control of false codling moth, Thaumatotibia leucotreta, on stone fruit and table grapes. PhD thesis, Stellenbosch University, Private Bag X1, 7602 Matieland (Stellenbosch), South Africa. [ Links ]
Stock, S.P. & Hunt, D.J., 2005. Morphology and systematics of nematodes used in biocontrol. In: Grewal, P.S., Ehlers, R.-U. & Shapiro-Ilan, D.I. (eds). Nematodes as Biocontrol Agents, CABI, Wallingford. pp. 3 - 43. [ Links ]
Torrance, L.A.I., 2016. The bio-ecology of the Cape grapevine leafminer, Holocacista capensis (Lepidoptera: Heliozelidae), in the Western Cape. MSc thesis, Stellenbosch University, Private Bag X1, 7602 Matieland (Stellenbosch), South Africa. [ Links ]
Van Damme, V.M., Beck, B.K.E.G., Berckmoes, E., Moerkens, R., Wittemans, L., De Vis, R., Nuyttens, D., Casteels, H.F., Maes, M., Tirry, L. & De Clercq, P., 2015. Efficacy of entomopathogenic nematodes against larvae of Tuta absoluta in the laboratory. Pest Manag. Sci. 72, 1702 - 1709. doi:10.1002/ps.4195 [ Links ]
Van Niekerk, S. & Malan, A.P., 2015. Adjuvants to improve aerial control of the citrus mealybug Planococcus citri (Hemiptera: Pseudococcidae) using entomopathogenic nematodes. J. Helminthol. 89, 189 - 195. doi:10.1017/ S0022149X13000771 [ Links ]
Van Nieukerken, E.J. & Geertsema, H., 2015. A new leafminer on grapevine and Rhoicissus (Vitacea) in South Africa within an expanded generic concept of Holocacista (Insecta, Lepidoptera, Heliozelidae). ZooKeys 507, 41 - 97. doi:10.3897/zookeys.507.9536 [ Links ]
White, G.F., 1927. A method for obtaining infective nematode larvae from cultures. Science 66, 302 - 303. [ Links ]
Wright, D., Peters, A., Schroer, S. & Fife, J., 2005. Application technology. In: Grewal, P.S., Ehlers, R.-U. & Shapiro-Ilan, D.I. (eds). Nematodes as Biocontrol Agents, CABI, Wallingford. pp. 91 - 106. [ Links ]
Submitted for publication: March 2019
Accepted for publication: July 2019
* Corresponding author: E-mail address: apm@sun.ac.za
Acknowledgements: The authors wish to thank D.G. Nel (Centre for Statistical Consultation, Stellenbosch University) and K.L. Pringle (Department of Conservation Ecology and Entomology, Stellenbosch University) for their assistance with the statistical analyses. Financial support was provided by the National Research Foundation (NRF), the South African Table Grape Industry (SATI), and the Technology and Human Resources for Industry Programme (THRIP-TP14062571871)
RESEARCH NOTE
Effect of Light Quality on Fruit Growth, Composition and the Sensory Impact of the Wines
E. H. BlancquaertI, *; A. OberholsterII; J. M. Ricardo-da-SilvaIII; A. J. DeloireIV
IDepartment of Viticulture and Oenology, Stellenbosch University, Private Bag X1, Matieland, 7602, South Africa
IIDepartment of Viticulture and Enology, University of California, Davis, CA 95616, USA
IIILEAF - Linking Landscape, Environment, Agriculture and Food, Laboratório Ferreira Lapa (Sector de Enologia),Instituto Superior de Agronomia, Universidade de Lisboa, 1349-017 Lisboa, Portugal
IVSupAgro, Department of Biology and Ecology, Montpellier University, 34060 Montpellier, France
ABSTRACT
The stage at which grapes are harvested has an influence on the aromatic and phenolic composition of the berries and the resulting wines. The aim of this study was to evaluate wines harvested sequentially as outlined in the berry sugar accumulation model. Two vintages and treatments in which the light quality and quantity were altered at the fruit zone were compared. In 2010/2011, the grapes were harvested at two ripening stages after the sugar loading plateau was reached, namely the "fresh fruit" stage (20-25 days afterwards) and "pre-mature" stage (at approximately 35 days). In the 2011/2012 season, grapes were harvested 45 days after the sugar loading plateau was reached (the "mature fruit" stage). Vegetative aromas were synonymous with the "fresh fruit" stage in 2010/2011, while the 2011/2012 wines from the "mature fruit" harvest date were characterized by raisin, prune and spicy aromas. In both seasons, the control treatments were rated more intense in 'satin in the mouth' in and after expectoration. Wines in which the UV-B radiation was excluded during berry growth were rated the highest in the mouthfeel attribute 'coarseness' in both treatment seasons. Wines were analyzed chemically for phenolic content using HPLC, and sensorial using descriptive analysis with a trained panel. In the leaf removal treatments, higher acidity content enhanced the perception of astringency in the wine. Wines were analyzed chemically for phenolic content using HPLC and sensorial using descriptive analysis with a trained panel. Overall, the data showed that grape composition was altered by varying light quality, within a season, but seasonal variation overrode treatment effects. Flavonol concentration in 2011/2012 wine was higher in the exposed leaf removal treatment compared to the other treatments. High light intensities in 2011/2012 season increased anthocyanin concentration in the wine.. This study emphasizes the importance of the quality and quantity of light on the composition and quality of wines, and presents new findings regarding sensory attributes associated with harvesting at different ripening stages.
Keywords: Cabernet Sauvignon, sequential harvesting, fresh fruit, mature fruit, sensory
INTRODUCTION
Grape ripening is multi-faceted as it includes numerous physical and biochemical modifications (Jackson & Lombard, 1993; Le Moigne et al., 2008; Dai et al., 2010; Deloire, 2013). Numerous classes of primary (sugars and organic acids) and secondary metabolites (phenolics) as well as hormones and aromatic precursors are synthesised prior and post-véraison while others are provided by the roots and leaves (Ollat & Gaudillère, 1996; Deloire, 2013). The concentration and content of the primary and secondary metabolites change during grape berry ripening stages, which are controlled by independent regulated synthesis pathways that are affected by genotype, environmental factors as well as viticultural practices (Jackson & Lombard, 1993; Le Moigne et al., 2008; Dai et al., 2010; Suklje et al., 2016; Chou et al., 2018).
Optimal berry ripeness depends on the wine style goal. The sensory characteristics of the finished wine, and thus the quality, are strongly dependent on the perception of the primary and secondary metabolites and the alcohol level. Numerous studies have been conducted on the relationship between berry composition and wine phenolic composition. No clear relationship has been found between the content of phenolic compounds in grapes at harvest and the content found in finished wine (Garcia-Beneytez et al. 2002; Habertson et al. 2002; Hazak et al. 2005; Koundouras et al. 2006). The polyphenol content in wine can be ascribed to factors involved in the extraction of phenolics such as grapeskin thickness, fermentation temperature and alcohol content. Preys et al. (2006) suggested that there are relationships between sensory properties and polyphenolic composition in the final wine. Relationships have also been reported between berry composition and sensory attributes which can be attributed to the applied treatment, vineyard attributes and seasonal variation (Somers & Evans, 1974; Ough & Nagaoka, 1984; Bravdo et al. 1985; Hunter et al. 1991 &1995). More recently, Bindon et al. (2013) and Bindon et al. (2014) ascribed significant changes in wine matrix chemistry to grape maturity and yeast metabolism, which had a direct impact on the sensory attributes of Cabernet Sauvignon.
Consequently, it would be valuable to be able to predict the future wine style in relation to harvest time (Deloire, 2013). Various ripening tools have been developed to determine berry maturity objectively and accurately at harvest. Berry maturity indices include (i) total soluble solids (TSS), (ii) titratable acidity (TA), (iii) pH and (iv) combinations thereof (maturity indexes) (Amerine & Winkler, 1941; Du Plessis & Van Rooyen, 1982; Van Rooyen, 1984; Boulton et al., 1996; Iland et al., 2000; Ribéreau-Gayon et al., 2006; Botes, 2009). Kourakou (1974), Carbonneau et al. (1998) and Schneider et al. (2002) identified three types of grape maturity levels: (i) technological maturity, which corresponds to maximum sugar accumulation/concentration and low acidity (ii) phenolic maturity, defined as the concentrations of phenolics in the skins and seeds and (iii) aromatic maturity, associated with the decrease in vegetal notes and the evolution of wine volatile profile.
Deloire (2011) defined sugar loading as the evolution of the sugar quantity (mg/berry) from véraison onward. The evolution of sugar accumulation per berry gives an indication of the ripening time and could be used as a physiological indicator in direct relation with the potential wine styles. Three sugar loading profiles are distinguished: continual and rapid loading, slow sugar loading (inhibition of ripening) and sugar loading presenting a plateau phase. Depending on whether the grapes are picked in the early, mid or late stages of the plateau phase, the wine will be characterized as "fresh fruit", 'neutral-spicy' or 'pre-mature' and "mature fruit" (Deloire, 2011). The aroma potential in the grapes can be attributed to the evolution of volatile precursors during berry development, which are dependent on enzyme activity and specificity. An in-depth understanding of secondary metabolites during berry development may provide predictive information between the grape and wine aroma (Kalua & Boss, 2009). These aromatic stages require sensory analysis to verify which sensory attributes associate with the respective stages. In terms of aromatic contribution to wine aroma, Swiegers and Pretorius (2007) and Garde-Cerdán et al., (2008) suggested that the volatile compounds derived from sugar and amino acid metabolism by yeast are the higher alcohols, esters, carbonyl compounds, volatile fatty acids, and sulphur compounds. Cabernet Sauvignon grapes often have a characteristic aroma described as 'vegetative', 'herbaceous', 'grassy' or 'green' (Lacey et al., 1991).
Polyphenols are very important in the colour and flavor of red wines. The two best-known groups of phenols are the condensed tannins (also called proanthocyanidins), and the anthocyanins, which are responsible for the red colour in red grapes and wine. A number of factors have been identified that can influence polyphenol accumulation and composition in grapes. This includes abiotic factors such as light (Flint et al., 1985; Crippen and Morrison, 1986; Gao and Cahoon 1994; Price et al., 1995; Dokoozlian and Kliewer, 1996; Haselgrove et al., 2000; Bergqvist et al. 2001; Jordão et al., 2001; Kolb et al., 2003; Cortell and Kennedy 2006; Downey et al., 2006; Ristic et al., 2007; Koyama and Goto-Yamamoto 2008; Berli et al., 2011; Gregan et al., 2012), temperature (Spayd et al., 2002; Mori et al., 2005; Mori et al., 2007; Azuma et al., 2012; Cohen et al., 2012; Yamane et al., 2006) and water status (Ojeda et al., 2002; Kennedy et al., 2002; Romero et al., 2013) as well as cultivar (Ricardo-da-Silva et al., 1992a; Ricardo-da-Silva et al., 1992b; Ryan and Revilla 2003; Downey et al., 2004), crop level (Peña-Neira, et al., 2007; Bindon et al., 2008), nutritional status (Delgado et al., 2004), soil type (Li et al., 2011) and plant growth regulators (Lacampagne et al., 2009).
Following harvest, the rate of phenolic extraction into the wine is dependent on: (i) ripeness of the fruit (Canals et al., 2005), (ii) berry size (Walker et al., 2005), (iii) the concentration in the grapes (Ozmianski et al., 1986), (iv) temperature (Koyama et al., 2007), (v) sulphur dioxide (Bakker et al., 1993), (vi) extraction or winemaking techniques (Nel et al., 2014), (vii) ethanol content (Canals et al., 2005); (viii) as well as the ageing conditions (Fang et al., 2008). Astringency and bitterness, which are largely dependent on wine phenol composition, are altered by grape maturity at harvest, winemaking techniques and wine ageing. Condensed tannins are mainly responsible for bitterness and astringency as well as colour development due to the role it plays in wine ageing processes such as polymerisation reactions with anthocyanins to form polymeric pigments (Ricardo-da-Silva et al., 1991). Wine colour is affected by the level and composition of anthocyanins, tannins and flavonols extracted during vinification (Baranowski & Nagel 1983; Bakker et al. 1993; Picinelli et al. 1994; Dallas et al., 1996; Cheynier et al., 2000; Romero & Bakker 2000; Eglinton et al., 2004; Ristic et al., 2007). Flavonols form co-pigments with anthocyanins and protect the flavylium cation against the nucleophilic attack of water, peroxide, and sulfur dioxide bleaching and pH changes (Gordillo et al., 2015).
Astringency is a tactile sensation in which drying, puckering and roughing are the result of increased friction between the tongue and the surfaces inside the mouth (Lea & Arnold, 1978; Robichaud & Noble, 1990). Recently, Ferrer-Gallego et al. (2014) reported that astringent perceptions are modulated by an increase in the volatile compounds. Bitterness is a taste sensation perceived by each of the several thousand sensors on the tongue (Katsnelson, 2015). Gonzalo-Diago et al. (2014) found that bitterness was highly correlated with in-mouth persistence. As previously stated, flavan-3-ols or their oligomers (referred to as proanthocyanidins) contribute to bitterness and astringency. The low molecular weight flavan-3-ols exhibit more bitterness then astringency, however as the flavan-3-ols increase in size, astringency increases faster than bitterness (Robichaud & Noble, 1990; Kennedy et al.,2006; Ren et al., 2017). Thus, the low molecular weight flavan-3-ols, which are associated more with grape seeds, have a lower astringency to bitterness ratio then the high molecular weight flavan-3-ols of grape skins.
In view of the previous work outlined above, the aim of this study was to evaluate wines produced from grapes that were harvested at different ripeness levels using berry sugar accumulation as a physiological indicator. Sequential harvest dates for the STD treatment in 2010/2011 were used to understand the possible effect of the evolution of fruit ripening on the wine matrix and sensory properties. The potential effect of the phenolic composition and volatile compounds on the wine sensory attributes was studied in the 2011/2012 season. The results presented are preliminary, and several subsequent seasons and more detailed chemical analyses are needed to link fruit and wine chemical composition and wine sensory profile of grapes harvested sequentially. This work is part of a larger study in which the evolution of the grape seed, skin tannin, flavonols and anthocyanins were investigated under altered light and temperature conditions in Cabernet Sauvignon (Vitis vinifera L.) (Blancquaert, 2015).
MATERIALS AND METHODS
Vineyard characteristics
The study was conducted during the growing seasons of 2010/2011 and 2011/2012 in a Stellenbosch University vineyard (GPS Coordinates: 33°56' 42" S 18°27' 43" E). The vineyard consists of Vitis vinifera L. cv. Cabernet Sauvignon clone CS 388C, grafted onto 101-14 Mgt (Vitis riparia X Vitis rupestris). The row orientation was northwest/south-east. The vines are trained on a six-wire vertical trellis system. The block was subjected to irrigation during critical phenological stages (e.g. fruit-set and véraison) and as required throughout the season to give a predawn leaf water potential between 0 and -0.3 MPa (Deloire & Heyns, 2011).
Treatments
The study comprised two main treatments with altered bunch microclimates in both seasons: no lateral shoot or leaf removal in the bunch zone (STD) and leaf removal in the bunch zone (LRW) (Table 1). In the LRW treatment, leaves were removed just after flowering corresponding to growth stage 19 (Eichorn and Lorenz system) on the western side of the canopy at the fruiting zone level (± 35-40 cm above the cordon) (Coombe, 1995).
Furthermore, to assess the effect of change in light quality on fruit growth and composition, supplementary treatments were applied. A UV sheet, reducing the UV-B radiation ('Perspex' ® Opal 050, Perspex South Africa Pty Ltd, Umbogintwini) was added to the Control/STD (STD-UV-B) and Leaf Removal West (LRW-UV-B) treatment in 2010/2011. During the 2011/2012 season, the UV-B suppression sheets were installed on both sides of the canopy to exclude the effect that the row direction can have on grape development as in the 2010/2011 season. Additional to the 'Perspex'® Opal 050 sheets, a clear acrylic UV-sheet (UHI) was used during the 2011/2012 season. The latter resulted in the following treatments: LR (-UV-B, 2xOp50) and LR (-UV-B, 2xUHI) (Table 1). These sheets were installed just after flowering at ±35 cm above the cordon and suspended on 1.2 m custom-made poles, with hinges to open for sampling and spraying. The treatments were applied in a randomised block design. Each treatment was carried out in five replicates and each replicate comprised three panels (six vines between poles). Therefore, each of the four treatments in each season comprised five replicates and each replicate consisted of 18 vines.
Sampling procedure
Sampling occurred at regular intervals throughout the season. Sampling was conducted between 06:00 and 08:00 at each sampling date from after fruit-set until harvest: 13-116 days after anthesis (DAA) during the 2010/2011 season; 26130 DAA in the 2011/2012 season. Sampling corresponded with the Eichorn and Lorenz (E-L) system (Coombe, 1995) and started at stage 29 (pea size) until stage 38 (harvest) for phenolic analyses.
Harvesting
Sequential harvest dates were predicted using the berry sugar loading model (Deloire 2011 & 2013). Grapes were harvested during the 2010/2011 season at the following times: (i) "fresh fruit" period for all four treatments (20-25 days after the sugar loading plateau was reached) on the 28th of February 2011; and (ii) 'pre-mature' period (± 35 days after the sugar loading plateau was reached) on the 20th of March 2011. For the latter, only the STD treatment was harvested. The STD treatment at the 'pre-mature' period was investigated in order to confirm whether 'neutral' wine aromas develop from wines made at this harvest stage using berry sugar accumulation as a physiological indicator (Deloire, 2011). The study aimed to assess the potential aromatic profile of the wine made from grapes harvested at the 'pre-mature' stage, which according to the model, should deliver a 'neutral' or 'pre-mature' wine style. The grapes of all the treatments in 2011/2012 season were harvested at the "mature fruit" period (45 days after the sugar loading plateau was reached) on the 26th of March 2012.
Small-scale winemaking
Standard winemaking procedures at the experimental cellar of the Department of Viticulture and Oenology, Stellenbosch University were followed. Four wines were made from the "fresh fruit" stage in duplicate. Additionally, the control (STD) was vinified at the 'pre-mature' stage in the 2010/2011 season. In the 2011/2012 season, four wines were made in duplicate from the grapes harvested at the "mature fruit" stage. In both seasons the grapes were crushed and destemmed into 20L plastic drums and 30 mg/L SO2 was added. Juice samples for pH, titratable acidity, and °B were taken before the SO2 addition. The crushed grapes were inoculated with 30 g/hL Saccharomyces cerevisiae (Lalvin ICV-D21®, Lallemand) and 30 g/hL Go Ferm Protect (Lallemand) in the rehydration water in 2010/2011 and 2011/2012, respectively. Co-inoculation with 0.01 g/L Oenococcus oeni (Enoferm ® Alpha, Lallemand) was carried out 24 hours after the yeast inoculation in order to start the malolactic fermentation. Fermentation took place at 25 °C and punch downs were done three times a day. The rate of fermentation was measured daily with a hydrometer. After 5 °B sugar was fermented 0.25 g/L Fermaid K (Lallemand) was added. The fermentation took about 5 days after which the skins were pressed at 1 bar when the wines were deemed dry (-1 °B) and moved to 20 °C in order to finish the malolactic fermentation. Once the malolactic fermentation was completed (malic and lactic acids determined enzymatically by the Central Analytical Facility, Stellenbosch University, South Africa), the wines were racked off the lees and 50 mg/L SO2 was added. The wines underwent cold stabilisation for 3 weeks at -4 °C before adjusting the free SO2 to 40 mg/L. The wines were then bottled in 750 mL dark green glass bottles, sealed with screw caps and stored at 15°C after bottling. Sensory analyses were performed six months after bottling.
Chemical analysis
The determination of the classical parameters (TSS, pH and TA) entailed the sampling of thirty berries from each of the five treatment replicates (30x5=150) in the middle of the bunch. The hundred and fifty berries from each treatment were divided into three sub-samples of 50 berries each and processed immediately after sampling for TSS, pH and titratable acidity. The berries were crushed and the grape juice centrifuged. TSS were measured using an ATAGO PAL-1 pocket refractometer (Tokyo, Japan). The pH and TA were measured using an automatic titrator (Metrohm, 702 SM Titrino, Herisau, Switzerland). The fresh berries were weighed.
Compounds were quantified using external calibration curves were set up for malvidin-3-glucoside ( Extrasynthese, Genay Cedex, France), as well as caffeic acid, p-coumaric acid, (+)-catechin, (-)-epicatechin, (-)-epicatechin-3-O-gallate, gallic acid and 2,6-dimethyl-hepten-2-ol (all from Sigma-Aldrich St. Louis, MO, U.S.A.). (+)-Catechin, (-)-epicatechin, (-)-epicatechin-3-O-gallate were quantified at 280 nm. All anthocyanins and other pigments were quantified at 520 nm as malvidin-3-glucoside units, whereas proanthocyanidins and polymeric phenols were quantified at 280 nm as (+)-catechin equivalents. Phloroglucinol and sodium acetate was obtained from Sigma-Aldrich (Johannesburg, South Africa) for the acid catalyses in the presence of excess phloroglucinol.
Isolation, purification and characterization of proantho-cyanidins/tannins
The proanthocyandins/tannins were characterised and quantified in the 2011/2012 wines. Proanthocyanidins/tannins were isolated in triplicate from different wine treatments using Toyopearl® HW-40 (Tosoh Bioscience, Stuttgart, Germany) size exclusion columns (60 mm x 14.5 mm) as described previously Oberholster et al. (2013). In short, dimers and smaller phenolics were washed off the column after loading of the wine (2 mL) with ethanol/water (55/45) containing 0.05 % trifluoroacetic acid (TFA). Larger pro-anthocyanidins/tannin were eluted with 30 mL of acetone/ water (60/40) containing 0.05 % TFA which was collected and concentrated under reduced pressure at 35°C to remove excess solvent.
The phloroglucinolysis protocol described by Oberholster et al. (2013) was implemented and the proanthocyanidin cleavage products were analysed by HPLC using an Agilent® Poroshell 120 SB-C18 column (4.6 x 150mm, 2.8 μηι particle) on an Agilent® Infinity series 1260 HPLC system (Agilent Technologies, Inc., Deerfield, IL, USA) equipped with a Diode Array DetectION (DAD) detector. Mobile phase A was 0.1 % (v/v) formic acid (Sigma-Aldrich, St. Louis, MO, USA) and mobile phase B acetonitrile containing 0.1 % (v/v) formic acid. Linear elution conditions were as follows: column temp 35°C; 2 ml/ min; 2.96 min at 3 % B; 3 to 16 % B in 10.30 min, 16 to 20 % B in 0.1 min, 1.7 min at 20 % B, 20 to 80 % B in 0.90 min, column clean-up at 80 % B for 1.34 min, and back to 3 % B in 1.00 min. The column was equilibrated for 8 min at 3 % B before the next injection. Chromatograph integration was performed using Agilent® CDS ChemStation software.
The proanthocyanidin cleavage products were quantified by means of their response factor relative to catechin, which was used as the quantitative standard (Kennedy & Jones, 2001). All samples were analysed in duplicate. The LOQ and LOD determined for (+)-catechin (Sigma Chemicals, St. Louis, MO) were, respectively, 0.0244 nmol and 0.0087 nmol where LOQ was defined as the minimum injected amount that gives a peak height seven times higher than baseline noise. LOD was defined as as the lowest concentration of an analyte in a sample that results in a peak with a height three times as high as the baseline noise level.
Descriptive analysis (DA)
The wines were evaluated 6 months after bottling by a panel of ten female judges (28-65 years old) for the 2010/2011 season during four replicate sessions, as outlined by Lawless & Heymann (2010). The 2011/2012 wines were evaluated by a panel of nine female judges (29-65 years old) during six replicate sessions. Prior to testing the panel members underwent training and assessment of panel performance in six two-hour sessions in both seasons. The first training session-involved standardisation (consensus) of the panellists on the aroma standards provided in 2011 and 2012 as well as touch standards using different materials (Table 2).
The mouthfeel properties of the wines were aligned with touch standards using the mouthfeel wheel (Gawel et al., 2000). The samples were evaluated for an array of aroma attributes, as well as taste and mouthfeel attributes, before and after expectoration using 100-point unstructured line scales. Wine samples were served in standard ISO wine tasting glasses, with each glass containing 30 mL of wine. Each sample was coded with a 3-digit random code and served in a complete randomised order (Lawless & Heymann, 2010). Panellists performed the analysis in individual booths, with each booth being fitted with a data collecting system (Compusense® five, Version 5.2, Compusense Inc., Guelph, Ontario, Canada). The testing area was light- and temperature-controlled (20 ±1 °C).
Statistical analysis
A univariate analysis of variance (ANOVA) was performed on the sensory data using the GLM (General Linear Model) Procedure of SAS software (Version 9.2; SAS Institute Inc., Cary, USA). Sensory data were pre-processed and subjected to a test-retest analysis of variance (ANOVA) using SAS. The latter was performed to test for panel reliability. The Shapiro-Wilk test was performed to test for normality (Shapiro & Wilk, 1965). Students' t-test least significant difference was calculated at the 5 % level to compare treatment means (Ott, 1998). A probability level of p<0.05 was considered significant for all the significance tests. Data were also subjected to multivariate methods of analysis, such as the principal component analysis (PCA) (XLStat, Version 2011, Addinsoft, New York, USA), to visualise and then interpret the relationships between the samples and their attributes.
RESULTS AND DISCUSSION
Berry composition
At harvest total soluble solids (TSS), pH and titratable acidity (TA) were determined for grapes from each of the treatments in both seasons (Table 3).
In the 2010/2011 season, the TSS varied significantly (p<0.01) at harvest among the treatments (Table 3), with the STD treatment showing significantly lower TSS (p< 0.01) compared to the other three treatments in 2010/2011 (Table 3). An increase in a similar low TSS in the STD-UV-B treatments was not observed despite the similar, low measured light intensities when compared with the STD treatment (Table 4). Spayd et al. (2002), Joscelyne et al. (2007) and Ristic et al. (2007) reported a delay in ripening due to shading which was caused by a greater proportion of leaves in the grapevine canopy. However, Haselgrove and coworkers (2000) found no difference in TSS of shaded or exposed treatments. The thermal time (DD) (Table 5) was the lowest in the STD treatment, but STD-UV-B had similar DD to the other treatments suggesting an interactive effect of temperature and light. When comparing the premature harvest data with the "fresh fruit" harvest data for the STD treatment, there was an increase in TSS and a simultaneous decrease in TA as expected, but the pH remained the same between the two harvest dates.
In the 2011/2012 season the TSS at harvest was significantly higher (p<0.001) in the STD treatment compared to the other treatments although all values were within 1.3 Brix of each other. pH were significantly lower (p<0.001) in the STD, LRW and LR (-UV-B, 2xOp50) treatments compared to LR (-UV-B, 2xUHI) in 2011/2012 (Table 5). Additionally, a significant lower TA (p<0.001) was observed in the LR (-UV-B, 2xUHI) treatment when compared to the other three treatments (Table 5).
This can be ascribed to the higher exposure level and the absence of leaves which degrade the acid in the berry (Table 3). Rojas-Lara & Morrison (1989), Morrison & Noble (1990) and Downey et al. (2006) reported differences in pH and TA in response to light and temperature as shaded fruit had higher pH and potassium levels. From our results, there was no clear relation between the grape classical parameters and the impact of treatment on light and temperature parameters indicating that differences were rather driven by seasonal influences.
Wine composition 2011/2012
The wine chemical composition of the 2011/2012 wines differed significantly between the treatments (Table 6). Wines made from LRW and LR (-UV-B, 2xUHI) treatments had the highest % alcohol while the LR (-UV-B, 2xOp50) contained significantly less, alcohol. Wine pH from the STD and LRW treatments were significantly higher compared to the LR (-UV-B, 2xOp50) and LR (-UV-B, 2xUHI) treatments. TA values differed significantly among the wines with LR (-UV-B, 2xUHI) treatment having the highest value (Table 6). There was no clear relationship between the grape and wine chemical parameters.
The proanthocyanidin composition of the wine tannins was determined by phloroglucinolysis. (+)-Catechin was the predominant terminal unit in the wine in each of the treatments (Table 7).
This corresponds with the findings of Fernández et al. (2007) who reported similar (+)-catechin proportions in different Carménère and Cabernet Sauvignon wines. There were small although significant differences in the tannin composition of the different wine treatments (Table 7). (-)-Epicatechin was the predominant extension subunit as found by other authors (Fernández et al. 2007). Most notably the higher percentage prodelphinidins (% P) in LR (-UV-B, 2xOp50) indicates larger contribution from skin tannin. Light exposure is known to increase skin tannin concentration (Price et al., 1995; Cortell & Kennedy, 2006; Ristic et al. 2007; Blancquaert, 2015) but only a small impact of light was found in this study. The treatments with the highest % light intensity, LR (-UV-B, 2xUHI) and LRW (Table 4) did not have higher % P compared to the other more shaded treatments. Although the tannin concentration was significantly higher in the LRW treatment, the STD was not significantly different from LR (-UV-B, 2xOp50). The high tannin concentration observed in the wines may possibly be ascribed to tannin compositional changes as the wine had ten months of bottle aging before analysis.. This result corresponds with the findings of Cosme et al. (2009) who also noted increases in tannin concentrations after six months of storage.
Wine flavonol concentration was higher in the LRW treatment (9.1 mg/L) compared to STD, LR (-UV-B, 2xOp50) and LR (-UV-B, 2xUHI) treatments (7.0, 3.56 and 3.99 mg/L), respectively. This corresponds to previous findings on flavonol concentration and content in grapes, as discussed by Blancquaert (2015) where higher flavonol concentration were observed in the LRW treatment throughout berry development. The anthocyanin concentration was the highest in the most exposed treatments: LRW and LR (-UV-B, 2xUHI) (173.9 and 139.9 mg/L, respectively) while wines made from the shaded treatments LR (-UV-B, 2xOp50) and STD wines were lower at 92.5 and 124.4 mg/L, respectively. These results compare favourably with the findings of Cortell & Kennedy (2006) and Song et al. (2015) who also noted high anthocyanin concentrations, wine colour density, total pigments and total phenolic and tannin in wine made from bunches exposed to sunlight.
Sensory profile of the wines
The sensory profile of a wine is greatly influenced by the primary and secondary metabolites of the berries at harvest as well as the techniques used during vinification. In this study the accumulation of grape flavan-3-ol monomers, dimers, total tannin, flavonols and anthocyanins as well as the compositional changes of the seed and skin tannin and anthocyanins was investigated. Overall, the data showed that grape composition was altered by the light quality/quantity within a particular season.
Table 8 lists the wine attributes evaluated in the wines made in the 2010/2011 season. The wines made from the different treatments differed significantly for 11 of the 22 sensory attributes. These included the aromas 'vegetative green' (p<0.001) and 'green plum' (p<0.001) and the in mouth palate attributes: 'acidity' (p<0.001), 'fullness' (p<0.001), 'drying' (p<0.05), 'satin' (p<0.05) and 'coarse emery' (p<0.05). there were also significant differences between the treatments in the attributes experienced after expectoration, including 'drying' (p<0.001), 'adhesive' (p<0.001), 'hotness' (p<0.001) and 'fruit flavour persistence' (p<0.001) (Table 8).
Wines made from STD and STD-UV-B treatment grapes scored significantly more for the aroma attribute green plum (Table 8). High levels of green plum can be ascribed to the low light intensities through natural shading (STD) and the addition of the UV-B sheets (STD-UV-B) (Table 3). This corresponds to the findings of Heymann & Noble (1987) and Morrison & Noble (1990) who reported an increase in the 3-isobutyl-2-methoxypyrazine (IBMP) ('vegetative', 'herbaceous' and 'grassy') concentration as a result of increased canopy density and bunch shading. The LRW treatment was rated high in 'vegetative green' character. Wines made from the "fresh fruit" stage of the sequential harvest model did not seem to be influenced by the applied treatment, but were described as "fresh fruit", 'green plant' like aromas and 'unripe plum' (Table 8). This corresponds to the findings of Nell (2015) in Merlot noir and Cabernet Sauvignon harvested at the "fresh fruit" stage. Treatments seemed to have most effect on intensity of attributes rather than the range used to describe the wines. For example, when the STD wine from the "fresh fruit" stage and that of the 'pre-mature' stage were compared it was evident that the latter wine had significantly less intense 'green plum' aromas and more intense 'blackberry' aromas (Table 8).
When mouthfeel attributes were compared, wines made from the STD treatment grapes were rated significantly higher levels of 'satin in the mouth' compared to the other treatment wines (Table 8). This finding coincides with that of Ristic et al. (2007) who found wines made from shaded berries to be less coarse and grainy. After expectoration, 'drying' and 'adhesive' was rated most intense for the STD-UV-B treatment, indicating a higher perception of astringency. Numerous authors attribute the increase in perception of astringency to greater concentration of tannins, polymerised phenols and the variation in tannin structures (Vidal et al., 2003; Kennedy et al., 2006, Mercurio & Smith 2008; Oberholster et al., 2009). From the grape composition in a previous study (Blancquaert, 2015) the STD-UV-B treatment did not have significantly higher concentration or content of tannins at harvest. This may be due to extraction of tannins from berry cell wall material during winemaking which results in the berries and the resulting wine having different phenolic compositions (Adams & Scholz, 2007; Holt et al., 2008). Furthermore, wine made from the STD treatment grapes harvested at the 'pre-mature' stage were rated as being less 'adhesive' after expectoration compared to the STD treatment from the "fresh fruit" stage which indicates a decrease in astringency. Thus the STD wine made from the 'pre-mature fruit' had less green character and decreased astringency compared to the STD wine from the "fresh fruit" stage. As wines from the 2010/2011 vintage were not analysed chemically, it is not possible to confirm and/or relate the sensory differences to changes in the wine composition.
Wines made from the 2011/2012 season differed significantly among treatments in both aroma and mouthfeel attributes for 20 of the 27 attributes investigated (Table 9).
These include the aromas 'prune' (p<0.001), 'raisin' (p<0.001), 'spice' (p<0.001), 'earthy' (p<0.05) and 'cooked vegetable' (p<0.001). On the palate, 'acidity' (p<0.001), 'satin' (p<0.05), 'silk' (p<0.05), 'coarse emery' (p<0.001), 'drying' (p<0.001) 'hotness' (p<0.001) and 'puckery' (p<0.001) were significantly affected. After expectoration, 'acidity' (p<0.05), 'satin' (p<0.05), 'silk' (p<0.05), 'coarse/ emery' (p<0.001), 'drying' (p<0.001), 'hotness (% alc. burn)' (p<0.001), 'puckery' (p<0.05), 'adhesive' (p<0.001) and 'astringent persistence' (p<0.001) were significantly different among wine treatments (Table 10).
The aroma attributes that were perceived by the panel may be associated with 'over-matured fruit' indicating a longer hanging time, which corresponds with the sequential harvest model of Deloire (2011). The 'over-matured fruit' and 'spicy' aroma attributes found in this study correspond with the findings of Nell (2015) in Merlot noir and Cabernet Sauvignon. The LR (-UV-B, 2xUHI) wine scored higher for 'prune' (p<0.001), 'raisin' (p<0.001), 'spice' (p<0.001) and 'cooked vegetative / green' (p<0.05) attributes when compared to the other treatments (Table 9). The latter result can be ascribed to the grapes from this treatment being exposed to higher % light in the visible spectrum (380- 780nm). The LR (-UV-B, 2xUHI) treatment had a shading coefficient of 1.0, thermal time of 729.7 and a maximum mean temperature of 39.6°C (Table 4).
In general, the wine from treatment LR (-UV-B, 2xUHI) was rated significantly higher than the other three treatments in most of the palate and 'after expectoration' attributes (Table 9). Gawel et al. (2007) suggested that an increase in 'puckery' sensation was characterised by low anthocyanin levels, high acidity and high pigmented polymer and tannin concentrations. Although wine treatment LR (-UV-B, 2xUHI) was rated more intense than the other treatments in all of the astringency related attributes except for 'satin', the wine analyses did not support this finding. Tannin analyses (Table 7) indicated that there were no significant differences between treatment LR (-UV-B, 2xUHI) and treatments LRW and LR (-UV-B, 2xOp50) in tannin concentration and mDP values. Phenolic profile results from HPLC analysis supported this. There were differences in anthocyanin (7.0, 9.0, 3.9 and 3.5 mg/L) and flavonol content (124.4, 173.9, 139.9 and 92.5 mg/L) for STD, LRW, LR (-UV-B, 2xOp50) and LR (-UV-B, 2xUHI), respectively.
The perception of astringency in wines can be influenced by other parameters such as pH, acidity, ethanol concentration and polysaccharides (Cheynier et al., 2006; Bajec & Pickering, 2008; Ma et al., 2014). From the results in this study(Table 6), the LR (-UV-B, 2xUHI) treatment had significantly higher (p<0.001) 'acidity', which could enhance the astringency perception of the phenolic compounds.
Multivariate associations of sensory attributes and treatments
Principle component analysis (PCA) was performed on all the aroma and mouthfeel properties for wines from both seasons in an attempt to discriminate among the treatments and the perceived attributes. Cumulatively, PC1 and PC2 explained 80.08 % in 2010/2011 and 92.23 % in 2011/2012 season (Fig. 1 a & b) of the variance.
In the 2010/2011 season, the LRW and STD-UV-B treatments associate with most of the mouthfeel attributes, whereas STD, LRW-UV-B and STD'pre-mature' associated with three of the aroma attributes i.e 'raspberry', 'cooked green' and 'black currant' as well as the mouthfeel attributes 'satin after expectoration' and 'hotnessalcohol' (Fig.1). Differences were driven by higher scores in 'blackcurrant' aroma, 'alcohol hotness' and 'satin mouthfeel' for wines from treatments STD and LRW-UV-B in addition to lower scores in mouthfeel terms 'drying', 'puckery' and 'adhesive'. STD 'pre-mature' separated from STD fresh due to mainly an increase in 'raspberry' aroma and a decrease in 'green plum'. These results agree with the findings of Archer & Strauss (1990), Morrison & Noble (1990) and Price et al. (1995), who reported that wine made from grapes grown in shaded conditions were characterised as 'green' or 'grassy' with limited differences in composition, but wines from exposed treatments were rated higher in overall quality due to the intensity of the aromas and darker colour. The treatments in this study did not follow any specific trend except for descriptors corresponding with the sequential harvest model (Deloire, 2011).
In the 2011/2012 season, separation of the wine treatments was due to much higher scores for most aroma and palate attributes for the LR (-UV-B, 2xUHI) treatment compared with the other treatments, with the exception of the 'fresh vegetative/ green' and 'satin attributes'. There was thus a clear separation of wines in the 2011/2012 according to light exposure (72, 278.9, 98.4 and 424.4 LiE.m-2.s-1 for STD, LRW, LR (-UV-B, 2xOp50) and LR (-UV-B, 2xUHI) respectively) based on sensory attributes. According to the 2011/2012 results (Fig. 1b), it is clear that a limited number of sensory attributes on the negative side of the PCA bi-plot, i.e 'strawberry' and 'fresh vegetative aromas and satin (in and after expectoration) can be ascribed to the light quantity and not quality as the LR (-UV-B, 2xOp50) was closely related to the LRW and STD treatment. The LR (-UV-B, 2xUHI) treatment was associated with the majority if the sensory attributes, especially the mouthfeel attributes (Fig. 1b). It is clear that the development of aroma and mouthfeel properties is dependent on light exposure as the LR (-UV-B, 2xUHI) were characterised by high visible light exposure. However, in the 2010/2011 season similar differences in light intensity (175.3, 517.7, 115.3, 260.2 LE.m-2.s-1 for STD, LRW, STD-UV-B and LRW-UV-B, respectively) did not result in clear separation of the treatments. The impact of the season can however been seen if the light intensiies for the STD treatment in both seasons are compared. In this study, it appears that seasonal variation had a larger impact than treatments on wine sensory attributes. However, the grapes were not harvested at the same stages in the different seasons, making conclusions more difficult. When comparing the two seasons (Fig. 1), the aroma attributes perceived in both seasons were found to be significantly different in the assessed wines. The aroma attributes in the wines corresponded to the descriptors associated with stages in the berry sugar accumulation model described by Deloire (2011).
CONCLUSIONS
Wines were made from different grape treatments harvested at different maturity levels using the berry sugar accumulation model (Deloire, 2011) in two consecutive seasons. Descriptive analysis was used to characterise differences in the perceived aroma and mouthfeel attributes of the wines made with grapes at the different maturity stages of sequential harvesting. In both seasons berry composition was influenced significantly by the prevailing light and temperature conditions within the season. Descriptors for wines corresponded with those predicted by sequential harvest using the berry sugar accumulation model, as wines made from berries harvested during the "fresh fruit" stage were classified as 'fresh', 'green' in 2010/2011, and wines made from the 'mature' stage were associated with 'prune' and 'raisin' attributes in 2011/2012. Wines from the STD treatment were consistently rated as having higher 'satin' properties in and after expectoration.
Sequential harvesting is an interesting way to explore the evolution of grape ripening and the aromas and mouthfeel attributes in the associated wines in a consumer-driven wine world. Ideally, the study should be conducted over additional seasons with the same treatments to investigate the impact of light intensity on grape ripening. Aspects of this work that should be further investigated include associating wine composition with specific mouthfeel attributes, and determining matrix effects on mouthfeel. Additionally, grapes from the respective treatments should be harvested across each ripeness levels in different seasons, to determine whether ripeness (i.e harvest time) has more of a sensory impact than light quantity and quality.
LITERATURE CITED
Adams, D.O. & Scholz, R.C., 2007. Tannins - the problem of extraction. In: Proceedings 13th Australian Wine Industry Technical Conference, Adelaide, South Australia pp. 160-164. [ Links ]
Amerine, M.A. & Winkler, A.J., 1941. Maturity studies with California grapes. I. The Balling-acid ratio of wine grapes. Proc. Amer. Soc. Hort. Sci. 38, 373-387. [ Links ]
Archer E. & Strauss, H.C., 1990. Effect of vine spacing on some physiological aspects of Vitis vinifera L. (cv. Pinot noir). S. Afr. J. Enol. Vitic. 11, 76-86. [ Links ]
Azuma, A, Yakushiji, H, Koshita, Y, Kobayashi, S., 2012. Flavonoid biosynthesis-related genes in grape skin are differentially regulated by temperature and light conditions. Planta, 236, 1067-1080. [ Links ]
Bajec, M. R. & Pickering, G. J., 2008. Astringency: mechanisms and perception. Crit. Rev. Food Sci. Nutr, 48, 858-875. [ Links ]
Bakker, J., Picinelli, A., Bridle, P. & Gracia-Viquera, C., 1993. Colour and composition changes during ageing. Vitis 32, 111-118. [ Links ]
Baranowski, E.S. & Nagel, C.W., 1983. Kinetics of malvidin-3-glucoside condensation in wine model systems. J. Food Sci. 48, 419-421. [ Links ]
Berli, F.J, Moreno, D, Piccoli, P, Hespanhol-Viana, L, Silva, M.F, Bressan-Smith, R, Cavagnaro, J.B, Bottini, R., 2011. Abscisic acid is involved in the response of grape (Vitis vinifera L.) cv. Malbec leaf tissues to ultraviolet-B radiation by enhancing ultraviolet-absorbing compounds, antioxidant enzymes and membrane sterols. Plant Cell Environ. 33, 1-10. doi: 10.1111/j.1365-3040.2009.02044.x [ Links ]
Bergqvist, J, Dokoozlian, N, Ebisuda, N., 2001. Sunlight exposure and temperature effects on berry growth and composition of Cabernet Sauvignon and Grenache in the central San Joaquin valley of California. Am. J. Enol. Vitic. 52, 1, 1-7. [ Links ]
Bindon, K.A., Dry, P.R. & Loveys, B.R., 2008. The Interactive Effect of Pruning Level and Irrigation Strategy on Grape Berry Ripening and Composition in Vitis vinifera L. cv. Shiraz. S. Afr. J. Enol. Vitic. 29, 2, 7178. [ Links ]
Bindon K., Varela C., Kennedy J., Holt H. & Herderich M., 2013. Relationships between harvest time and wine composition in Vitis vinifera L. cv. Cabernet Sauvignon 1. Grape and wine chemistry. Food Chem. 138, 1696-1705. [ Links ]
Bindon K., Holt H., Williamson P.O., Varela C., Herderich M. & Francis I.L., 2014. Relationships between harvest time and wine composition in Vitis vinifera L. cv. Cabernet- Sauvignon 2. Wine sensory properties and consumer preference. Food Chem. 154, 90-101. [ Links ]
Blancquaert, E.H. (2015) Berry tannin structure and phenolics evolution in cv. Cabernet Sauvignon (Vitis vinifera L.): effect of light and temperature. PhD Agric dissertation, Stellenbosch University, Private Bag X1, 7602, Matieland (Stellenbosch), South Africa. [ Links ]
Botes, M.P. 2009. Evaluation of parameters to determine optimum ripeness in cabernet Sauvignon grapes in relation to wine quality. MSc Agric thesis. Stellenbosch University, Private Bag X1, 7602, Matieland (Stellenbosch), South Africa. [ Links ]
Boulton, R.B, Singleton, V.L., Bisson, L.F. & Kunkee, R.E., 1996. Principles and practices of winemaking. Chapman & Hall, New York. [ Links ]
Bravdo, B., Hepner, Y., Loinger, C., Cohen, S. & Tabacman, H., 1985. Effect of crop level and crop load on growth, yield, must and wine composition, and quality of Cabernet Sauvignon. Am. J. Enol. Vitic. 36, 125-131. [ Links ]
Canals, R., Llaudy, M.C., Vallis, J., Canals, J.M. & Zamora, F., 2005. Influence of ethanol concentration on the extraction of color and phenolic compounds from the skins and seeds of Tempranillo grapes at different stages of ripening. J. Agric. Food Chem. 53, 4019-4025. [ Links ]
Carbonneau, A., Champagnol, F., Deloire, A. & Sevila, F., 1998. Récolte et qualité du raisin. In C. Flanzy (Ed.), Enologie, fondements scientifiques et technologiques, Paris, Technique et Documentation Lavoisier. pp. 649-670. [ Links ]
Cerpa-Calderón, F.K. & Kennedy, J.A., 2008. Berry integrity and extraction of skin and seed proanthocyanidins during red wine fermentation. J. Agric. Food. Chem. 56, 9006-9014. [ Links ]
Cheynier, V., Remy, S. & Fulcrand, H., 2000. Mechanisms of anthocyanin and tannin changes during winemaking and ageing. In: Proceedings of the ASEV 50th Anniversary Annual Meeting, Seattle, Washington. American Society for Enology and Viticulture: Davis, 337-344. [ Links ]
Cheynier, V., Dueñas-Paton, M., Salas, E., Maury, C, Jean-Marc Souquet, J., Sarni-Manchado, P. & Fulcrand, H., 2006. Structure and properties of wine pigments and tannins. Am. J. Enol. Vitic. 57, 298-305. [ Links ]
Chou, H., Suklje, K., Antalick, G., Schmidtke, L.M. & Blackman, J.W., 2018. Late-Season Shiraz Berry Dehydration That Alters Composition and Sensory Traits of Wine. J. Agric. Food Chem. 66 29, 7750-7757. [ Links ]
Cohen, S.D., Tarara, J.M., Gambetta, G.A., Matthews, M.A., Kennedy, J.A., 2012. Impact of diurnal temperature variation on grape berry development, proanthocyanidin accumulation, and the expression of flavonoid pathway genes. J Exp. Bot. 63, 2655-2665. doi:10.1093/jxb/err449 [ Links ]
Coombe, B.G.,1995. Adoption of a system for identifying grapevine growth stages. Aust. J. Grape Wine Res.1, 104-10. doi: 10.1111/j.1755-0238.1995.tb00086.x [ Links ]
Cortell, J.M. & Kennedy, J.A. 2006. Effect of shading on accumulation of flavonoid compounds in (Vitis vinifera L.) Pinot noir fruit and extraction in a model system. J. Agric. Food. Chem. 54, 8510-8520. [ Links ]
Cosme, F., Ricardo-da-Silva, J.M. & Laureano, O., 2009. Effect of various proteins on different molecular weight proanthocyanidin fractions of red wine during wine fining. Am. J. Enol. Vitic. 60, 74-81. [ Links ]
Crippen, D.D.J., Morrison, J.C., 1986. The effects of sun exposure on the phenolic content of Cabernet Sauvignon berries during development. Am. J. Enol. Vitic. 37, 4, 243-247. [ Links ]
Dallas, C., Ricardo-da-Silva, J.M. & Laureano, O., 1996. Interactions of oligomeric procyanidins in model wine solutions containing malvidin-3-glucoside and acetaldehyde. J.Sci. Food Agric. 70, 493-500. [ Links ]
Dai, Z.W, Vivin, P., Ollat, N., Barrieu, F. & Delrot, S., 2010. Physiological and modelling approaches to understand water and carbon fluxes in relation with grape berry growth and quality. Aust. J. Grape Wine Res. 16, 70-85. [ Links ]
Delgado, R., Martín, P., del Álamo, M. & González, M., 2004. Changes in the phenolic composition of grape berries during ripening in relation to vineyard nitrogen and potassium fertilisation rates. J Sci Food Agric, 84, 623 - 630 [ Links ]
Deloire, A.J., 2011. The concept of sugar loading. Wynboer, January, 9395. [ Links ]
Deloire, A.J., Heyns, D., 2011. The leaf water potentials: Principles, method and thresholds. Wineland, 129-131. [ Links ]
Deloire, A.J., 2013. Berry ripening and wine aroma. Practical Winery and Vineyard, April, 1-3. [ Links ]
Dokoozlian, N.K, Kliewer, W.M., 1996. Influence of light on grape berry growth and composition varies during fruit development. J. Am. Soc. Hortic Sci. 121, 869-874. [ Links ]
Downey, M.O., Harvey, J.S., Robinson, S.P., 2004. The effect of bunchshading on berry development and flavonoid accumulation in Shiraz grapes. Aust. J. Grape Wine Res.10, 55-73. doi: 10.1111/j.1755-0238.2004.tb00008.x [ Links ]
Downey, M.O., Dokoozlian, N.K. & Krstic, M.P., 2006. Cultural practice and environmental impacts on the flavonoid composition of grapes and wine: a review of recent research. Am. J. Enol. Vitic. 57, 257-268. [ Links ]
Du Plessis, C.S. & Van Rooyen, P.C., 1982. Grape maturity and wine quality. S. Afr. Enol. Vit. 3, 41-45. [ Links ]
Eglinton, J., Griesser, M., Henschke, P., Kwiatkowski, M., Parker, M. & Herderich, M., 2004. Yeast-mediated formation of pigmented polymers in red wine. In: Red Wine Color: Exploring the Mysteries. Waterhouse A.L., and Kennedy J.A. (Eds.) (American Chemical Society: Washington, DC.) pp. 9-21. [ Links ]
Fang, F., Li, J., Zhang, P., Tang, K., Wang, W., Pan, Q. & Juang, W., 2008. Effects of grape variety, harvest date, fermentation vessel and wine ageing on flavonoid concentration in red wines. Food Research International, 41, 1, 53-60. [ Links ]
Fernández, K., Kennedy, J.A. & Agosin, E., 2007. Characterization of grape and wine proanthocyanidins of Vitis vinifera cv. Carmenere. J. Agric. Food Chem. 55, 3675-3680. [ Links ]
Ferrer-Gallego, R., Hernández-Hierro, J.M., Rivas-Gonzalo, J.C., Escribano-Bailón, M.T., 2014. Sensory evaluation of bitterness and astringency sub-qualities of wine phenolic compounds: synergistic effect and modulation by aromas. Food Res Int, 62, 1100-1107. [ Links ]
Flint, S.D., Jordan, P.W., Caldwell, M.M., 1985. Plant protective response to enhanced UVB radiation under field conditions: leaf optical properties and photosynthesis. Photochem Phytobiol. 41, 95-99. doi: 10.1111/j.1751-1097.1985.tb03454.x [ Links ]
Gao, Y, Cahoon, G.A., 1994. Cluster shading effects on fruit quality, skin color, and anthocyanin content and composition in Reliance (Vitis hybrid). Vitis, 33, 205-209. [ Links ]
Garcia-Beneytez, E., Revilla, E. & Cabello, F., 2002. Anthocyanin pattern of several red grape cultivars and wines made from them. Eur Food Res Technol 215, 32-37. [ Links ]
Garde-Cerdán, T., Jarauta, I., Salinas, M.R., Ancín-Azpilicueta, C., 2008. Comparative study of the volatile composition in wines obtained from traditional vinification and from the Ganimede method. J. Sci. Food Agric. 88, 10, 1777-1785. [ Links ]
Gawel, R., Oberholster, A. & Francis, I.L., 2000. Red wine mouth-feel terminology. Aust. J. Grape Wine Res. 6, 203-207. [ Links ]
Gawel, R., Francis, L. & Waters, E.J., 2007. Statistical correlations between the in-mouth t textural characteristics and the chemical composition of Shiraz wines. J. Agric. Food Chem. 55, 2683-2687. [ Links ]
Gonzalo-Diago, A., Dizy, M. & Fernández-Zurbano, P., 2014. Contribution of low molecular weight phenols to bitter taste and mouthfeel properties in red wines. Food Chem. 154, 187-198. [ Links ]
Gordillo, B., Rodríguez-Pulido, F.J., Gonzalez-Miret, M.L., Quijada-Morín, N., Rivas-Gonzalo, J.C., García-Estevez, I., Heredia, F.J. and Escribano-Bailon, M.T., 2015. Application of differential colorimetry to evaluate anthocyanin-flavonol-flavanol ternary copigmentation interactions in model solutions. J. Agric. Food Chem. DOI: 10.1021/acs.jafc.5b00181. [ Links ]
Gregan, S.M., Wargent, J.J., Liu, L., Shinkle, J., Hofmann, R., Winefield, C., Trought, M., Jordan, B., 2012. Effects of solar ultraviolet radiation and canopy manipulation on the biochemical composition of Sauvignon blanc grapes. Aust. J. Grape WineRes.18, 2, 227-238. doi: 10.1111/j.1755-0238.2012.00192.x [ Links ]
Habertson, F. & Adams, J. A., 2002. Tannins in skins and seeds of Cabernet Sauvignon, Syrah and Pinot noir berries during ripening. Am. J. Enol. Vitic. 53, 54-59. [ Links ]
Haselgrove, L., Botting, D., van Heeswijck, R., H0j, P.B., Dry, P.R., Ford, C. & Iland, P.G., 2000. Canopy microclimate and berry composition: The effect of bunch exposure on the phenolic composition of Vitis vinifera L cv. Shiraz grape berries. Aust. J. Grape Wine Res. 6, 141-149. [ Links ]
Hazak, J.C., Harbertson, J.F., Adams, D.O., Lin, C.H. & Ro, B.R., 2005. The phenolic components of grape berries in relation to wine composition. Acta Horticulturae 689, 189-196. [ Links ]
Heymann, H. & Noble, A.C., 1987. Descriptive analysis of commercial Cabernet Sauvignon wines from California. Am. J. Enol. Vitic. 38, 41-44. [ Links ]
Holt, H.E., Francis, I.L., Field, J., Hererich, M.J. & Iland, P.G., 2008. Relationships between wine phenolic composition and wine sensory properties for Cabernet Sauvignon (Vitis vinifera L.). Aust. J. Grape Wine Res. 14, 162-176. [ Links ]
Hunter, J.J., De Villiers, O.T. & Watts, J.E., 1991. The effect of partial defoliation on quality characteristics of Vitis vinifera L. cv. Cabernet Sauvignon grapes. II. Skin color, skin sugar, and wine quality. Am. J. Enol. Vitic. 42, 13-18. [ Links ]
Hunter, J.J., Ruffner, H.P., Volschenk, C.G. & Le Roux, D.J., 1995. Partial defoliation of Vitis vinifera L. cv. Cabernet Sauvignon/99 Richter: Effect on root growth, canopy efficiency, grape composition, and wine quality. Am. J. Enol. Vitic. 46, 306-314 [ Links ]
Iland, P., Ewart, A., Sitters, J., Markides, A. & Bruer, N., 2000. Techniques for chemical analysis and quality monitoring during winemaking. In: Patrick Iland wine promotions (1st ed.) Campbelltown, Australia. [ Links ]
Jackson, D.I. & Lombard, P.B., 1993. Environmental management practices affecting grape composition and wine quality - A review. Am. J. Enol. Vitic. 44, 409-430. [ Links ]
Jordão, A.M., Ricardo-da-Silva, J.M., Laureano, O., 2001. Evolution of catechins and oligomeric procyanidins during grape maturation of Castelão Frances and Touriga Francesca. Am. J. Enol. Vitic. 52, 3, 230-234. [ Links ]
Joslyn, M.A. & Goldstein, J.L., 1964. Astringency of fruits and fruit products in relation to phenolic content. Adv. Food Res. 13, 178-217. [ Links ]
Joscelyne, V., Downey, M., Mazza, M. & Bastian, S., 2007. Partial shading of Cabernet Sauvignon and Shiraz vines altered wine colour and mouthfeel attributes but increased exposure had little impact. J. Agric. Food Chem. 55, 10888-10896. [ Links ]
Kalua, C.M. & Boss, P.K., 2009. Evolution of Volatile Compounds during the Development of Cabernet Sauvignon Grapes (Vitis vinifera L.). Agric. Food Chem. 57, 3818-3830. [ Links ]
Katsnelson, A., 2015. From the tongue to the brain. A body of research by Charles Zuker explains how we distinguish bitter from sweet, salty from sour-and why we should care. Accessed: 1 June 2015. (http://www.columbiamedicinemagazine.org/features/spring-2015/tongue-brain). [ Links ]
Kennedy, J.A. & Jones, G.P., 2001. Analysis of proanthocyanidin cleavage products following acid-catalyses in the presence of excess phloroglucinol. J. Agric. Food. Chem. 49, 1740-1746. [ Links ]
Kennedy, J.A., Ferrier, J., Harbertson, J.F. & Gachons, C.P.D., 2006. Analysis of tannins in red wine using multiple methods: Correlation with perceived astringency. Am. J. Enol. Viticult. 57, 481-485. [ Links ]
Kolb, C.A, Kopecky, J Riederer, M., 2003. Pfündel, E.E. UV screening by phenolics in berries of grapevine (Vitis vinifera). Funct Plant Biol. 30, 1177-1186. [ Links ]
Kourakou, S., 1974. Optimalerreifergrad derTraubenin bezugaufden gewiinschten weityp (Fr). Paper presented, XIV Congress international de la vigne et du vin. O.I.V. Bolzano. Italy, Oct. [ Links ]
Koundouras, S., Marinos, V., Gkoulioti, A., Kotseridis, Y. & van Leeuwen, C., 2006. Influence of vineyard location and vine water status on fruit maturation of nonirrigated cv. Agiorgitiko (Vitis vinifera L.). Effects on wine phenolic and aroma components. J. Agric. Food Chem. 54, 5077- 5086. [ Links ]
Koyama, K., Goto-Yamamoto, N. J., 2008. Bunch shading during different developmental stages affects the phenolic biosynthesis in berry skins of 'Cabernet Sauvignon' grapes. Am. Soc.Hortic. Sci. 133, 743-753. [ Links ]
Lacey, M.J., Allen, M.S., Roger, L.N Harris, Brown, W.V., 1991. Methoxypyrazines in Sauvignon blanc grapes and wines. . Am. J. Enol. Vitic. 42, 2, 103-108. [ Links ]
Lawless, H.T. & Heymann, H., 2010. Data Relationships and Multivariate Applications. In: Sensory evaluation of food. Publisher Springer New York. pp. 433-449. [ Links ]
Lea, A.G.H. & Arnold, G.M., 1978. The phenolics of ciders: Bitterness and astringency. J. Sci. Food Agric. 29, 478-483. [ Links ]
Le Moigne, M., Symoneaux, R. & Jourjon, F., 2008. How to follow grape maturity for wine professionals with seasonal judge training? Food Qual. Prefer. 19, 672-681. [ Links ]
Li, Z., Pan, Q, Jin, Z., Mu, L. & Duan, C. 2011. Comparison on phenolic compounds in Vitis vinifera cv. Cabernet Sauvignon wines from five winegrowing regions in China. Food Chemistry, 125, 1 77-83. [ Links ]
Ma, W., Guo, A., Zhang, Y., Wang, H., Liu, Y. and Li, H., 2014. A review on astringency and bitterness perception of tannins in wine. Trends in Food Science & Technology 40, 6-19. [ Links ]
Mercurio, M.D. & Smith, P. A., 2008. Tannin quantification in red grapes and wine: Comparison of polysaccharide- and protein-based tannin precipitation techniques and their ability to model wine astringency. J. Agric. Food Chem. 56, 5528-5537. [ Links ]
Mori, K, Sugaya, S, Gemma, H. (2005). Decreased anthocyanin biosynthesis in grape berries grown under elevated night temperature condition. Sci. Hortic. 105, 319-330. doi: https://doi.org/10.1016/j.scienta.2005.01.032 [ Links ]
Mori, K, Goto-Yamamoto, N, Kitayama, M, Hashizume, K., 2007. Loss of anthocyanins in red-wine grape under high temperature. J. Exp. Bot. 58, 1935-1945. doi: 10.1093/jxb/erm055 [ Links ]
Morrison, J. C. & Noble, A. C., 1990. The effects of leaf and cluster shading on the composition of Cabernet Sauvignon grapes and on fruit and wine sensory properties. Am. J. Enol. Vitic. 41, 193-200. [ Links ]
Nel, A.P., Van Rensburg, P. & Lambrecht, M.G., 2014. The influence of different winemaking techniques on the extraction of grape tannins and antho-cyanins. S. Afr. J. Enol. Vitic. 35, 2, 304-320. [ Links ]
Nell, M., 2015.Sensory characterisation of several red cultivar (Vitis vinifera L.) wines, using berry sugar accumulation as a physiological indicator and sequential harvest. MScAgric thesis, Stellenbosch University, Private Bag X1, 7602, Matieland (Stellenbosch), South Africa. [ Links ]
Noble, A.C., 1990. Bitterness and astringency in wine. In Developments in Food Science 25. Bitterness in Foods and Beverages. R.L. Rouseff (Ed.), pp. 145-158. Elsevier, New York. [ Links ]
Oberholster, A., Francis, I., Iland, P. & Waters, E. 2009. Mouthfeel of wines made with and without pomace contact and added anthocyanins. Aust. J. Grape Wine Res. 15, 59-69. [ Links ]
Oberholster, A., Carstens, L., Du Toit, W., 2013. Investigation of the effect of gelatine, egg albumin and cross-flow microfiltration on the phenolic composition of Pinotage wine. Food Chem. 138, 1275-1281. [ Links ]
Ollat, N. & Gaudillère, J.P., 1996. Investigation of assimilates import mechanisms in berries of Vitis vinifera var. Cabernet-Sauvignon. Acta Horticulturae 427, 141 - 149. [ Links ]
Ott, R.L., 1998. An introduction to statistical methods and data analysis. Duxbury Press, Belmont, California. [ Links ]
Ough, C.S. & Nagaoka, R., 1984. Effect of cluster thinning and vineyard yields on grape and wine composition and wine quality of Cabernet Sauvignon. Am. J. Enol. Vitic. 35, 30-34. [ Links ]
Ozmianski, J., Romeyer, F.M., Sapis, J.C. & Macheix, J.J., 1986. Grape seed phenolics: extraction as affected by some conditions occurring during wine processing. Am. J. Enol. Vitic. 37, 7-12. [ Links ]
Peña-Neira, A., Cáceres, A. & Pastenes, C., 2007. Low Molecular Weight Phenolic and Anthocyanin Composition of Grape Skins from cv. Syrah (Vitis vinifera L.) in the MaipoValley (Chile): Effect of Clusters Thinning and Vineyard Yield. Food Sci Tech Int. 13, 2:153-158. [ Links ]
Ren, M., Wang, X., Du, G., Tian, C., Zhang, J., Song, X. & Zhu, D., 2017. Influence of different phenolic fractions on red wine astringency based on polyphenol/protein binding. S. Afr. J. Enol. Vitic. 38, 1, 118-124. [ Links ]
Picinelli, A., Bakker, J. & Bridle, P., 1994. Model wine solutions: effect of sulphur dioxide on colour and composition during ageing. Vitis 33, 31-35. [ Links ]
Price, S.F., Breen, P.J., Valladao, M. & Watson, B.T., 1995. Cluster exposure and quercetin in Pinot noir grapes and wine. Am. J. Enol. Vitic. 46, 187-194. [ Links ]
Preys, S., Mazerolles, G., Courcoux, P., Samson, A., Fischer, U., Hanafi, M., Bertrand, D. & Cheynier, V., 2006. Relationship between polyphenolic composition and some sensory properties in red wines using multiway analyses. Anal. Chim. Acta 563, 126-136. [ Links ]
Ricardo-da-Silva, J.M., Rigaud, J., Cheynier, V., Cheminat, A. & Moutounet, M. 1991. Procyanidin dimers and trimers from grape seeds. Phytochemistry 30, 1259-1264. [ Links ]
Ricardo-da-Silva, J.M., Belchior, A.P., Spranger, M.I. & Bourzeix, M., 1992a. Oligomeric procyanidins of three grapevine varieties and wines from Portugal. Sci. Aliments 12, 223-237. [ Links ]
Ricardo-da-Silva, J.M., Mourgues, J. & Moutounet, M., 1992b. Dimer and trimer procyandins in Carignan and Mouvédre grapes and red wines. Vitis 31, 55-63. [ Links ]
Ristic, R., Downey, M.O., Illand, P.G., Bindon, K., Francis, I.L., Herderich, M., Robinson, S., 2007. Exclusion of sunlight from Shiraz grapes alters wine colour, tannin and sensory properties. Aust. J. Grape Wine Res. 13, 53-65. [ Links ]
Robichaud, J.L. & Noble, A.C., 1990. Astringency and bitterness of selected phenolics in wine. J. Sci. Food Agric. 53, 343-353. [ Links ]
Romero, C. & Bakker, J., 2000. Effect of acetaldehyde and several acids on the formation of vitisin A in model wine anthocyanin and colour evolution. Int. J. Food Sci. Technol. 35, 129-140. [ Links ]
Rojas-Lara, B.A. & Morrison, J.C., 1989. Differential effects of shading fruit or foliage on the development and composition of grape berries. Vitis 28, 199-208. [ Links ]
Rossi, J.A. & Singleton, V.L., 1966. Flavor effects and adsorptive properties of purified fractions of grape seed phenols. Am. J. Enol. Vitic. 17, 240-246. [ Links ]
Ryan, J.M, Revilla, E., 2003. Anthocyanin composition of Cabernet Sauvignon and Tempranillo grapes at different stages of ripening. J. Agric. Food Chem. 51, 3372-3378. doi: 10.1021/jf020849u [ Links ]
Schneider, R., Razungles, A., Charrier, F., & Baumes, R., 2002. Effet du site, de la maturité et de l'éclairement des grappes sur la composition aromatique des baies de Vitis vinifera L. cv. Melon B. dans le vignoble du Muscadet Bulletin de l'OIV. pp. 270-282. [ Links ]
Shapiro, S.S. & Wilk, M.B., 1965. An analysis of variance test for normality (complete samples). Biometrika 52, 591-611. [ Links ]
Somers, T.C. & Evans, M.E., 1974. Wine quality: Correlations with colour density and anthocyanin equilibria in a group of young red wines. J. Sci. Food Agric 25, 1369-1379. [ Links ]
Song, J., Smart, R., Wang, H, Dambergs, B., Sparrow, A. & Qian, M.C., 2015. Effect of grape bunch sunlight exposure and UV radiation on phenolics and volatile composition of Vitis vinifera L. cv. Pinot noir wine. Food Chemistry 173, 424-431. [ Links ]
Spayd, S.E., Tarara, J.M., Mee, D.L. & Ferguson, J.C., 2002. Separation of sunlight and temperature effects on the composition of Vitis vinifera cv. Merlot berries. Am. J. Enol. Vitic. 53, 3, 171-181. [ Links ]
Suklje, K., Zhang, X., Antalick, G., Clark, A.C., Deloire, A & Schmidtke, L.M., 2016. Berry shriveling significantly alters Shiraz (Vitis vinifera L.) grape and wine chemical composition. J. Agric. Food Chem. 64, 870- 880. [ Links ]
Swiegers, J.H. & Pretorius, I.S., 2007. Modulation of volatile sulfur compounds by wine yeast. Appl Microbiol Biotechnol 74, 954-960. [ Links ]
Van Rooyen, P.C, Ellis, L.P. & Du Plessis, C.S., 1984. Interactions between grape maturity and quality for Pinotage and Cabernet Sauvignon wines from four locations. S. Afr. Enol, Vitic. 5, 29-34. [ Links ]
Vidal, S., Francis, L., Guyot, S., Marnet, N., Kwiatkowski, M. & Gawel, R., 2003. The mouth-feel properties of grape and apple proanthocyanidins in a wine-like medium. J. Sci. Food Agric. 83, 6, 564-573. [ Links ]
Walker, R.R., Blackmore, D.H., Clingeleffer, P.R., Kerridge, G.H., Ruhl, E.H. & Nicholas, P. R., 2005. Shiraz berry size in relation to seed number and implications for juice and wine composition. Aust. J. Grape Wine Res. 11, 2-8. [ Links ]
Submitted for publication: July 2018
Accepted for publication: June 2019
Acknowledgements: We gratefully acknowledge the Wine Industry Network for Expertise and Technology (Winetech) and the Technology and Human Resources for Industry Programme (THRIP) for financial support. We would also like to acknowledge Ms Nina Muller and Mrs Erika Moelich for assistance during the sensory analysis and Mrs Marieta Van der Rijst and Prof. Martin Kidd for statistical analyses .
* Corresponding author: E-mail address: ewitbooi@sun.ac.za ^rND^sAdams^nD.O.^rND^sScholz^nR.C^rND^sAmerine^nM.A.^rND^sWinkler^nA.J.^rND^sArcher^nE.^rND^sStrauss^nH.C.^rND^sAzuma^nA^rND^sYakushiji^nH^rND^sKoshita^nY^rND^sKobayashi^nS.^rND^sBajec^nM. R.^rND^sPickering^nG. J.^rND^sBakker^nJ.^rND^sPicinelli^nA.^rND^sBridle^nP^rND^sGracia-Viquera^nC.^rND^sBaranowski^nE.S.^rND^sNagel^nC.W.^rND^sBerli^nF.J^rND^sMoreno^nD^rND^sPiccoli^nP^rND^sHespanhol-Viana^nL^rND^sSilva^nM.F^rND^sBressan-Smith^nR^rND^sCavagnaro^nJ.B^rND^sBottini^nR^rND^sBergqvist^nJ^rND^sDokoozlian^nN^rND^sEbisuda^nN^rND^sBindon^nK.A.^rND^sDry^nP.R^rND^sLoveys^nB.R.^rND^sBindon^nK.^rND^sVarela^nC.^rND^sKennedy^nJ.^rND^sHolt^nH.^rND^sHerderich^nM.^rND^sBindon^nK.^rND^sHolt^nH.^rND^sWilliamson^nP.O.^rND^sVarela^nC.^rND^sHerderich^nM.^rND^sFrancis^nI.L.^rND^sBravdo^nB.^rND^sHepner^nY.^rND^sLoinger^nC^rND^sCohen^nS.^rND^sTabacman^nH.^rND^sCanals^nR.^rND^sLlaudy^nM.C.^rND^sVallis^nJ^rND^sCanals^nJ.M.^rND^sZamora^nF.^rND^sCarbonneau^nA.^rND^sChampagnol^nF^rND^sDeloire^nA.^rND^sSevila^nF.^rND^sCerpa-Calderón^nF.K.^rND^sKennedy^nJ.A.^rND^sCheynier^nV.^rND^sRemy^nS.^rND^sFulcrand^nH.^rND^sCheynier^nV.^rND^sDueñas-Paton^nM.^rND^sSalas^nE.^rND^sMaury^nC,^rND^sJean-Marc Souquet^nJ.^rND^sSarni-Manchado^nP^rND^sFulcrand^nH.^rND^sChou^nH.^rND^sSuklje^nK.^rND^sAntalick^nG.^rND^sSchmidtke^nL.M.^rND^sBlackman^nJ.W.^rND^sCohen^nS.D.^rND^sTarara^nJ.M.^rND^sGambetta^nG.A.^rND^sMatthews^nM.A.^rND^sKennedy^nJ.A^rND^sCoombe^nB.G.^rND^sCortell^nJ.M.^rND^sKennedy^nJ.A.^rND^sCosme^nF.^rND^sRicardo-da-Silva^nJ.M.^rND^sLaureano^nO.^rND^sCrippen^nD.D.J.^rND^sMorrison^nJ.C^rND^sDallas^nC.^rND^sRicardo-da-Silva^nJ.M.^rND^sLaureano^nO.^rND^sDai^nZ.W,^rND^sVivin^nP.^rND^sOllat^nN^rND^sBarrieu^nF.^rND^sDelrot^nS.^rND^sDelgado^nR^rND^sMartín^nP.^rND^sdel Álamo^nM.^rND^sGonzález^nM.^rND^sDeloire^nA.J.^rND^sHeyns^nD.^rND^sDokoozlian^nN.K,^rND^sKliewer^nW.M.^rND^sDowney^nM.O^rND^sHarvey^nJ.S.^rND^sRobinson^nS.P.^rND^sDowney^nM.O.^rND^sDokoozlian^nN.K.^rND^sKrstic^nM.P.^rND^sDu Plessis^nC.S.^rND^sVan Rooyen^nP.C.^rND^sEglinton^nJ.^rND^sGriesser^nM.^rND^sHenschke^nP.^rND^sKwiatkowski^nM.^rND^sParker^nM.^rND^sHerderich^nM.^rND^sFang^nF.^rND^sLi^nJ.^rND^sZhang^nP.^rND^sTang^nK.^rND^sWang^nW.^rND^sPan^nQ.^rND^sJuang^nW.^rND^sFernández^nK.^rND^sKennedy^nJ.A.^rND^sAgosin^nE.^rND^sFerrer-Gallego^nR.^rND^sHernández-Hierro^nJ.M^rND^sRivas-Gonzalo^nJ.C.^rND^sEscribano-Bailón^nM.T.^rND^sFlint^nS.D.^rND^sJordan^nP.W^rND^sCaldwell^nM.M^rND^sGao^nY,^rND^sCahoon^nG.A.^rND^sGarcia-Beneytez^nE.^rND^sRevilla^nE.^rND^sCabello^nF.^rND^sGarde-Cerdán^nT^rND^sJarauta^nI.^rND^sSalinas^nM.R.^rND^sAncín-Azpilicueta^nC.^rND^sGawel^nR.^rND^sOberholster^nA.^rND^sFrancis^nI.L.^rND^sGawel^nR.^rND^sFrancis^nL.^rND^sWaters^nE.J.^rND^sGonzalo-Diago^nA.^rND^sDizy^nM^rND^sFernández-Zurbano^nP.^rND^sGordillo^nB^rND^sRodríguez-Pulido^nF.J.^rND^sGonzalez-Miret^nM.L.^rND^sQuijada-Morín^nN^rND^sRivas-Gonzalo^nJ.C.^rND^sGarcía-Estevez^nI.^rND^sHeredia^nF.J^rND^sEscribano-Bailon^nM.T.^rND^sGregan^nS.M.^rND^sWargent^nJ.J^rND^sLiu^nL.^rND^sShinkle^nJ^rND^sHofmann^nR^rND^sWinefield^nC^rND^sTrought^nM.^rND^sJordan^nB.^rND^sHabertson^nF^rND^sAdams^nJ. A.^rND^sHaselgrove^nL.^rND^sBotting^nD^rND^svan Heeswijck^nR^rND^sH0j^nP.B.^rND^sDry^nP.R.^rND^sFord^nC^rND^sIland^nP.G.^rND^sHazak^nJ.C^rND^sHarbertson^nJ.F^rND^sAdams^nD.O^rND^sLin^nC.H.^rND^sRo^nB.R.^rND^sHeymann^nH.^rND^sNoble^nA.C.^rND^sHolt^nH.E.^rND^sFrancis^nI.L.^rND^sField^nJ^rND^sHererich^nM.J^rND^sIland^nP.G.^rND^sHunter^nJ.J^rND^sDe Villiers^nO.T^rND^sWatts^nJ.E.^rND^sHunter^nJ.J.^rND^sRuffner^nH.P.^rND^sVolschenk^nC.G^rND^sLe Roux^nD.J.^rND^sIland^nP.^rND^sEwart^nA.^rND^sSitters^nJ.^rND^sMarkides^nA^rND^sBruer^nN.^rND^sJackson^nD.I.^rND^sLombard^nP.B.^rND^sJordão^nA.M.^rND^sRicardo-da-Silva^nJ.M^rND^sLaureano^nO^rND^sJoslyn^nM.A^rND^sGoldstein^nJ.L.^rND^sJoscelyne^nV.^rND^sDowney^nM.^rND^sMazza^nM.^rND^sBastian^nS.^rND^sKalua^nC.M.^rND^sBoss^nP.K.^rND^sKennedy^nJ.A^rND^sJones^nG.P.^rND^sKennedy^nJ.A.^rND^sFerrier^nJ^rND^sHarbertson^nJ.F.^rND^sGachons^nC.P.D.^rND^sKolb^nC.A^rND^sKopecky^nJ^rND^sRiederer^nM.^rND^sKourakou^nS.^rND^sKoundouras^nS.^rND^sMarinos^nV.^rND^sGkoulioti^nA.^rND^sKotseridis^nY.^rND^svan Leeuwen^nC.^rND^sKoyama^nK.^rND^sGoto-Yamamoto^nN. J.^rND^sLacey^nM.J.^rND^sAllen^nM.S^rND^sRoger^nL.N Harris^rND^sBrown^nW.V.^rND^sLawless^nH.T.^rND^sHeymann^nH.^rND^sLea^nA.G.H.^rND^sArnold^nG.M.^rND^sLe Moigne^nM.^rND^sSymoneaux^nR.^rND^sJourjon^nF.^rND^sLi^nZ.^rND^sPan^nQ,^rND^sJin^nZ.^rND^sMu^nL.^rND^sDuan^nC.^rND^sMa^nW.^rND^sGuo^nA^rND^sZhang^nY.^rND^sWang^nH.^rND^sLiu^nY.^rND^sLi^nH.^rND^sMercurio^nM.D.^rND^sSmith^nP. A.^rND^sMori^nK^rND^sSugaya^nS^rND^sGemma^nH.^rND^sMori^nK^rND^sGoto-Yamamoto^nN^rND^sKitayama^nM^rND^sHashizume^nK^rND^sMorrison^nJ. C.^rND^sNoble^nA. C.^rND^sNel^nA.P.^rND^sVan Rensburg^nP.^rND^sLambrecht^nM.G.^rND^sNoble^nA.C.^rND^sOberholster^nA^rND^sFrancis^nI^rND^sIland^nP.^rND^sWaters^nE.^rND^sOberholster^nA.^rND^sCarstens^nL^rND^sDu Toit^nW^rND^sOllat^nN.^rND^sGaudillère^nJ.P.^rND^sOugh^nC.S.^rND^sNagaoka^nR.^rND^sOzmianski^nJ^rND^sRomeyer^nF.M^rND^sSapis^nJ.C.^rND^sMacheix^nJ.J.^rND^sPeña-Neira^nA.^rND^sCáceres^nA.^rND^sPastenes^nC.^rND^sRen^nM.^rND^sWang^nX.^rND^sDu^nG.^rND^sTian^nC^rND^sZhang^nJ^rND^sSong^nX.^rND^sZhu^nD.^rND^sPicinelli^nA.^rND^sBakker^nJ.^rND^sBridle^nP.^rND^sPrice^nS.F.^rND^sBreen^nP.J.^rND^sValladao^nM.^rND^sWatson^nB.T.^rND^sPreys^nS.^rND^sMazerolles^nG^rND^sCourcoux^nP.^rND^sSamson^nA.^rND^sFischer^nU^rND^sHanafi^nM^rND^sBertrand^nD.^rND^sCheynier^nV.^rND^sRicardo-da-Silva^nJ.M.^rND^sRigaud^nJ.^rND^sCheynier^nV.^rND^sCheminat^nA^rND^sMoutounet^nM.^rND^sRicardo-da-Silva^nJ.M.^rND^sBelchior^nA.P^rND^sSpranger^nM.I.^rND^sBourzeix^nM.^rND^sRicardo-da-Silva^nJ.M.^rND^sMourgues^nJ.^rND^sMoutounet^nM.^rND^sRistic^nR.^rND^sDowney^nM.O.^rND^sIlland^nP.G.^rND^sBindon^nK.^rND^sFrancis^nI.L.^rND^sHerderich^nM.^rND^sRobinson^nS.^rND^sRobichaud^nJ.L^rND^sNoble^nA.C.^rND^sRomero^nC.^rND^sBakker^nJ.^rND^sRojas-Lara^nB.A.^rND^sMorrison^nJ.C.^rND^sRossi^nJ.A.^rND^sSingleton^nV.L.^rND^sRyan^nJ.M^rND^sRevilla^nE.^rND^sShapiro^nS.S^rND^sWilk^nM.B.^rND^sSomers^nT.C.^rND^sEvans^nM.E.^rND^sSong^nJ.^rND^sSmart^nR.^rND^sWang^nH,^rND^sDambergs^nB^rND^sSparrow^nA.^rND^sQian^nM.C.^rND^sSpayd^nS.E.^rND^sTarara^nJ.M.^rND^sMee^nD.L.^rND^sFerguson^nJ.C.^rND^sSuklje^nK.^rND^sZhang^nX^rND^sAntalick^nG^rND^sClark^nA.C.^rND^sDeloire^nA^rND^sSchmidtke^nL.M.^rND^sSwiegers^nJ.H.^rND^sPretorius^nI.S.^rND^sVan Rooyen^nP.C,^rND^sEllis^nL.P.^rND^sDu Plessis^nC.S.^rND^sVidal^nS.^rND^sFrancis^nL.^rND^sGuyot^nS^rND^sMarnet^nN^rND^sKwiatkowski^nM.^rND^sGawel^nR.^rND^sWalker^nR.R^rND^sBlackmore^nD.H.^rND^sClingeleffer^nP.R.^rND^sKerridge^nG.H.^rND^sRuhl^nE.H^rND^sNicholas^nP. R.^rND^1A01^nG.^sGarrido-Bañuelos^rND^1A01^nA.^sBuica^rND^1A01 A02^nE.^sSharp^rND^1A02^nA.^sde Villiers^rND^1A01^nW. J.^sdu Toit^rND^1A01^nG.^sGarrido-Bañuelos^rND^1A01^nA.^sBuica^rND^1A01 A02^nE.^sSharp^rND^1A02^nA.^sde Villiers^rND^1A01^nW. J.^sdu Toit^rND^1A01^nG^sGarrido-Bañuelos^rND^1A01^nA^sBuica^rND^1A01 A02^nE^sSharp^rND^1A02^nA^sde Villiers^rND^1A01^nW. J^sdu Toit
ARTICLES
doi:https://doi.org/10.21548/42-2-3375
The Impact of Different Tannin to Anthocyanin Ratios and of Oxygen on the Phenolic Polymerisation Over Time in a Wine-like Solution
G. Garrido-BañuelosI, #; A. BuicaI, *; E. SharpI, II; A. de VilliersII; W. J. du ToitI
IDepartment of Viticulture and Oenology, Stellenbosch University, Private Bag X1, Matieland 7062, South Africa
IIDepartment of Chemistry and Polymer Science, Stellenbosch University, Private Bag X1, Matieland 7062, South Africa
ABSTRACT
Colour and phenolic stability during ageing are influenced by the levels of distinct classes of phenolics in young red wines. The ratios between different classes of phenolic compounds also determine the colour and phenolic development of red wines. The present study evaluated the impact of forced oxidation on different anthocyanin/tannin (A/T) extracts and its consequent effect on the colour and phenolic evolution over time. The results showed that higher contents of seed tannins could enhance phenolic polymer formation, especially in the presence of oxygen. The addition of oxygen seemed to favour certain polymerisation reactions between tannins, leading to higher concentrations of monomeric anthocyanins in solution. A slower oxygen consumption was also observed as the phenolic composition of the wine-like extract evolved over time.
Key words: Phenolic compounds; wine-like extract; oxygen; polymerisation; anthocyanin/tannin extracts; ageing
INTRODUCTION
Red wine quality can be directly influenced by phenolic compounds. Colour and phenolic stability of red wine are parameters that are related to consumer acceptance of the product. Grape phenolics are the main source of these secondary metabolites, which are progressively extracted during alcoholic fermentation as the ethanol concentration increases (Peyrot Des Gachons & Kennedy, 2003; González-Manzano et al., 2004; Ribéreau-Gayon et al., 2006). Grape anthocyanins and condensed tannins (proanthocyanidins) are the most important groups of phenolic compounds in red wines due to their involvement in determining the colour and sensory properties (Cheynier et al., 2006; He et al., 2012a, 2012b). Anthocyanins are normally exclusively extracted from the grape skins, whereas condensed tannins also originate from the grape skins, stems and seeds (Meyer & Hernandez, 1970; Pascual et al., 2016). Differences in the chemical structure, polymer length and % galloylation of grape tannins can influence their extractability (González-Manzano et al., 2006), reactivity and thereby their final impact on the sensory properties of wines (Peleg et al., 1999). Grape tannins can be subdivided in two groups: procyanidins and prodelphinidins (Cheynier et al., 2006; Kennedy et al., 2006; Mattivi et al., 2009). Prodelphinidins are only found in grape skins, whilst procyanidins are extracted from grape skins and seeds and consist of units of (+)-catechin and its epimer, (-)-epicatechin (Souquet et al., 1996; Adams, 2006).
From crushing, anthocyanins and tannins are chemically modified and undergo continual evolution over time, leading to the formation of new and more stable compounds (Pérez-Magarino & González-SanJosé, 2004; Monagas et al., 2006; He et al., 2012b; Arapitsas et al., 2014, 2016; Bimpilas et al., 2015). Skin tannins, together with anthocyanins, follow a sigmoidal extraction, reaching a plateau in the early stages of the alcoholic fermentation (Mattivi et al., 2009; Yacco et al., 2016). However, longer maceration periods are required to reach better extraction of seed phenols due to a necessary hydration phase of the grape seeds (Casassa, 2017), leading to different levels of anthocyanins (A) and total tannins (T). The initial A/T ratio of wine must is thought to affect the subsequent polymerisation reactions in wine (Singleton & Trousdale, 1992; Sparrow et al., 2015) and the interaction of phenolic compounds with other wine components (Bindon et al., 2010; Springer et al., 2016). Reactions such as polymerisation, condensation between tannins and anthocyanins, or the formation of complexes with proteins or polysaccharides depend on the different types of tannins and their concentrations in the wine.
Oxygen is involved in several of these reactions, such as phenolic polymerisation, which leads to the formation of more complex and stable phenolic compounds (Fulcrand et al., 1996; Atanasova et al., 2002). The oxidation of ethanol produces acetaldehyde, which enhances the formation of ethyl-bridged composite phenols (Timberlake & Bridle. 1977; Dallas et al., 1996; Saucier et al., 1997; Es-Safi et al., 1999; Waterhouse & Laurie, 2006). At lower doses. the impact of oxygen can be beneficial, increasing colour stability and improving wine taste and structure (Waterhouse & Laurie, 2006; Gambuti et al., 2013). However, the oxygen intake should be controlled to avoid excessive production of acetaldehyde and subsequent over-polymerisation and precipitation (Castellari, et al., 2000; Du Toit, et al., 2006a; Ribéreau-Gayon, et al., 2006). The ageing potential of a wine seems to be influenced by the nature of the tannins and the relative A/T ratios (Singleton & Trousdale, 1992; Ribéreau-Gayon et al., 2006; Pascual et al., 2016; Picariello et al., 2017), but this needs further clarification. Two recent publications have evaluated the oxygen consumption of several oenological tannins in a model wine solution, showing how the different nature of the tannins (model wine solutions rich in ellagitannins, gallotannins, skin tannins or seed tannins) influence the oxygen consumption rates (Pascual et al., 2017; Vignault et al., 2018). However, the impact of a continuous oxygen exposure and how the new phenolic polymers formed during ageing react towards it still remains unknown.
There are many unknowns in the continuous evolution of wine phenols during ageing. Current analytical methods can only provide limited information on the different phenolic polymer structures. The impact of oxygen on wine phenols in general has been examined extensively (Castellari et al., 2000; Atanasova et al., 2002; Wirth et al., 2010; Arapitsas et al., 2012; McRae et al., 2015; Quaglieri et al., 2017). However, only two recent publications have evaluated the effect of oxygen on wines with different A/T ratios (Picariello et al., 2017; Carrascón et al., 2018). In the study from Picariello et al. (2017), the commercial tannins used may contain additional non-tannin compounds, thereby not only altering tannin concentrations but also those of other wine components and complicating interpretation of their findings (Versari et al., 2013). The present work aimed to investigate how oxygen affects phenolic polymerisation reactions at different A/T extracts in a wine-like (WL) system. To our knowledge this is the first study that focuses on proanthocyanidin polymerisation reactions as a function of the combination of these two variables (oxygen and A/T ratio). In addition, we also evaluate the different oxygen consumption patterns over time.
MATERIALS AND METHODS
Wine-like extracts
Shiraz grapes were harvested in 2015 from the Welgevallen experimental vineyard of the Department of Viticulture and Oenology at Stellenbosch University. The experimental design consisted of three different extracts, obtained by varying the amount of seeds used in the extraction and therefore the A/T ratio. The three extracts were obtained from 240 g grape skin without any grape seeds added (SK), in a normal seed (80 g) to skin ratio (SKSD) and in the presence of four times the normal seed (320 g) to skin ratio (SK4SD) found in the Shiraz grapes of the study. All extractions were carried out for nine days at 25°C in1 L hydroalcoholic solution (15% ethanol) at pH 3.4 and containing 6.0 g/L tartaric acid.
To avoid the possibility of spontaneous fermentation during sample storage, 20 mg/L NaN3 (Sigma-Aldrich, St. Louis, MO, USA) was added to the extracts. All extractions were manually shaken three times per day. A single extraction was performed per extract. After nine days, the skins and seeds from their corresponding extract were removed and softly pressed by hand in the presence of CO2. The iron and copper concentrations were then adjusted to 5 mg/L and 0.3 mg/L, respectively, by adding the requisite amounts of FeSO4.7H2O and CuSO4.5H2O (Sigma-Aldrich) according to Danilewicz (2007). The three final extracts (SK, SKSD, and SK4SD) were then centrifuged at 8000 rpm (5 min) to remove any residual grape skins.
The extracts were then divided into Control (C) and Oxygen treatments (Ox), transferred to vials (20 mL vials for C and 100 mL vials for Ox) and sealed hermetically, with the use of crimp caps. Ox samples were exposed to a forced oxidation before being transferred to the vials. The Ox samples were vigorously shaken by hand in a 500 mL volumetric flask for 2 minutes, allowing air to enter every 10 seconds to reach oxygen saturation. On the other hand, C treatments were directly transferred into the vials (previously filled with nitrogen), while blowing CO2 into the vial. All vials were stored in the dark at 15°C until the required analysis after 3 (3M), 6 (6M) and 9 months (9M) of storage. Once opened and analysed, C treatment vials were discarded, whereas in the case of Ox samples, 20 mL were drawn for the colour and phenolic analysis and the remainder of the extract was again saturated with oxygen before further storage. Glass beads were used to fill the headspace in the Ox vials at each of the sampling stages. In total, Ox samples were saturated with oxygen three times (at time 0 - 0 M, after 3 M and 6 M). The oxygen introduced ranged between 6.8-7.6 mg/L at time 0, 7.1-7.6 mg/L after 3 M and 8.5-8.9 mg/L after 6 M.
Oxygen measurement
Oxygen spots (Pst3, PreSens, Regensburg, Germany) were placed in several vials (control and oxygen vials) to avoid invasive measurements and used to monitor the oxygen uptake rate (Coetzee et al., 2016). The oxygen consumption was monitored in C and Ox samples for the first 70-75 hours after oxygen addition. Vials were stored in the dark to avoid possible damage to the spots.
Colour and phenolic measurements
Spectrophotometric analysis
The colour and phenolic composition were analysed at time 0 M in each of the three extracts. In addition, these parameters were measured in C and Ox samples at 3 M, 6 M and 9 M of storage. At each time point, three vials of each treatment were opened and analysed. The colour density (CD), total red pigments (TRP) and total phenols (TP) of the samples were measured by spectrophotometric analysis (Somers & Evans, 1974; Boulton, 2001). TRP and TP were obtained from the absorbance units (AU) at 280 nm and 520 nm from wine-like samples diluted in 1M HCl. Tannin concentrations of the samples were then detemined by the methyl cellulose precipitation (MCP) method (Sarneckis et al., 2006) and the results are expressed (in catechin equivalents) in mg/L.
Reversed phase high performance liquid chromatography (RP-HPLC)-DAD analyses
The analysis of individual and polymeric phenolic compounds were also performed at 0M and for all treatments after 3 M, 6 M and 9 M of storage using RP-HPLC according to Garrido-Banuelos et al. (2019). WL samples were centrifuged for 5 min at 8000 rpm and 20 μL of the supernatant was injected. Calibrations were done for the following phenolic standards with additional compounds quantified as equivalents indicated in brackets: gallic acid, (+)-catechin ((-)-epicatechin, B1, polymeric phenols), caffeic acid (GRP, caftaric acid), p-coumaric acid, quercetin-3-glucoside (quercetin-3-glucuronide, quercetin-3-galactoside), quercetin, myricetin, kaempferol from Sigma-Aldrich Chemie (Steinheim, Germany), and malvidin-3-glucoside (delphinidin-, cyanidin-, malvidin-, peonidin-, petunidin- 3-glucosides, -3-acetyl-glucosides, -3-p-coumaryl-glucosides, polymeric pigments) from Extrasynthese (Lyon, France). The identification of the compounds was done based on retention times of standards and the UV-Vis spectra (acquired by injection of standards or from the literature). To simplify the large set of data, certain individual compounds were grouped, namely the sum of total hydroxycinnamic acids, total flavonols, the total glucosylated-anthocyanins, total acetylated-anthocyanins and total coumaroylated-anthocyanins.
Statistical analysis
All analyses were carried out using Statistica 13.2 (TIBCO Statistica software, Palo Alto, CA, USA). Significant differences were judged on a 5% significance level (p < 0.05) with Fisher LSD Post Hoc tests. Principal Component Analysis (PCA) was performed with SIMCA 14.1 software (Sarto-rium Stedim Biotech - Malmö, Sweden).
RESULTS AND DISCUSSION
Colour and phenolic extraction in the different extracts
Based on previous trials, all extractions were performed for nine days in order to allow for a better extraction from the grape seeds. At 0 M (after nine days of extraction) the colour density (CD) and the total red pigments (TRP) were similar between the three extracts. As expected, higher TP and tannin concentration were found in the SKSD and especially SK4SD samples prepared with more seeds, compared to SK (prepared with only skin tannins). Considering the individual phenolic compounds, especially gallic acid and catechin concentrations were significantly different between the different extracts at 0 M (Table 1).
Influence of a different phenolic extract on oxygen consumption
The oxygen consumption (mg/L) was firstly monitored for the C and Ox samples at 0 M, and only for Ox samples in the following oxygenations after 3 M and 6 M of storage. The oxygen consumption of the following oxidations was only monitored during the first three days (70-75 hours). As illustrated in Figure 1, the different extracts, which probably differ in concentration and chemical nature, clearly played a role as the oxygen consumption rates differed between the storage times and treatments. These differences in the oxygen depletion rates could possibly be explained by changes occurring in the phenolic profile and concentration of the extracts over time. Firstly, as shown in Figure 1 A1, there was a quick depletion of the low amount of oxygen present in C samples (probably due to a minimal oxygen intake during sample preparation). From Figure 1 A2, which illustrates the oxygen consumption in Ox vials at 0 M, minimal differences were found between the extracts. At 0 M, the higher phenolic levels, together with possible differences in the nature of the phenols, did not seem to influence oxygen consumption, differing from the findings of Pascual et al., (2017). In both cases, the dissolved oxygen in the different extracts was depleted after a few hours. On the other hand, the oxygen consumption rate varied over time, as the phenolic profiles of the extracts evolved. Oxygen consumption measured after 3 M was generally slower compared to 0 M (Figure 1 A3). Interestingly, after 3 M the oxygen consumption was slower in the SK4SD samples. We consider that the initial excess of seed phenols may have had an influence on the formation rate of new polymeric forms involving oxidative reactions during the early stages of storage. This may have led to an extract composition with lower levels of compounds susceptible to oxidation after 3 M. Furthermore, oxygen consumption observed in Figure 1 A4 was even slower for all three extracts after 6 M, probably also as a consequence of a lower substrate availability to react with oxygen in the WL media.
Colour and phenolic evolution of the final extracts
Differences were observed in terms of the colour parameter and phenolic levels as determined spectrophotometrically at 0 M, as well as a function of storage time. Storage time played a particularly important role, as significant differences were also found in colour and the phenolic concentration between the different extracts over time. Whilst the extract was the most important factor in determining TP levels and, obviously, the tannin concentration, oxygen had a large influence on the colour parameter such as the TRP and CD, especially the absorbance at 420 nm for the latter. Furthermore, time was also a determining factor, especially for the TRP.
The evolution of the phenolic parameters determined spectrophotometrically as a function of time (Table 1 supplementary) for the three extracts and C and Ox samples are shown in Figure 2. The cumulative effect of all the studied parameters drives a clear separation between the samples. In Figure 2 A1, it can be seen that the different extracts were separated along the PC1 axis (54.4%). As previously mentioned, the TP and tannin concentration were mainly influenced by the respective extract composition. The scores plot and the corresponding loadings plot (Figure 2- A1 and B) showed a general higher phenolic content in SK4SD treatments, especially compared to SK treatments. Over the course of time, these differences between the extracts became smaller, especially after 9 M, probably as a consequence of phenolic degradation, but also as a result of over-polymerisation reactions and subsequent precipitation of insoluble phenolic compounds. In Figure 2 A2, the samples are coloured according to the sampling stages (0 M, 3 M, 6 M and 9 M). After 9 M, the extracts were more closely distributed along the PC1 axis (54.4%). When the samples were coloured according to the C/Ox treatment, the samples were distributed along the PC2 axis (21.3%), with Ox samples being characterised by a generally higher phenolic and especially tannin concentrations (Figures 2 and 3). Contrary to the findings of Geldenhuys et al. (2012), oxygen was also found to play an important role in tannin concentrations (Figure 2 A3). However, Geldenhuys et al. (2012) applied progressive micro-oxygenation, whereas in this study a large amount of oxygen was added at a time.
A general loss of colour and reduction in phenolic levels was found over time, especially pronounced from 0 M (Table 1) to 3 M, except for the total tannin concentration as determined by the MCP method (Figure 3). As an example, TRP levels decreased in all the samples during the first 3M, especially in most of the C treatments (Table 1 supplementary). Oxygen seemed to have enhanced the polymerisation between certain compounds, thereby possibly limiting the degradation of certain red pigments. The TRP content was significantly higher in the SKSD and SK4SD Ox treatments at 3 M (Table 1 supplementary). From then onwards, the differences between C and Ox treatments and between the extracts became less over time.
Conversely, the tannin content showed different patterns from 0 to 3 M within the different treatments. As illustrated in Figure 3 (values at 0 M are specified on the Y axis), clear differences were found between C and Ox samples. While the MCP tannin levels were relatively constant from 0 M to 3 M in C samples (except for a slight increase in SKSD), an increase in the tannin concentration was observed in Ox (SKSD and SK4SD) samples during the same period. However, after 3 M, the tannin levels were only significantly higher in SK4SD-Ox samples compared to the corresponding C samples (Figure 3). During the following three months, the C treatments showed a progressive decrease in tannin concentration, except for the SK treatment (constant from 3M to 9M), while not changing significantly up to 9M. (Figure 3). On the other hand, the Ox treatments' tannin levels increased (SK and SKSD) or remained stable (SK4SD) up to 6M of storage, which might also explain the different oxygen consumption rates observed for the second oxidation step after 3M of storage. From then, all the Ox extracts experienced a general decrease in tannin concentration towards the last sampling stage (9M). This decrease can possibly be explained by the formation of larger and/or more unstable polymers which are no longer soluble in the hydroalcoholic solution. Thus, the oxygen had an impact on the tannin polymerisation reactions, and likely the reactivity of the polymerisation reaction products towards methylcellulose (Figure 3). The significant role of oxygen in tannin polymerisation has been widely documented in literature (Singleton, 1987; Castellari et al., 2000; Atanasova et al., 2002; Waterhouse & Laurie, 2006; Gambuti et al., 2013; Quaglieri et al., 2017).
Oxygen also influenced the evolution of the amount of TRP in the extracts. In the presence of oxygen, higher phenolic levels might compete for reaction with oxygen, favouring specific polymerisation reactions. Thus, the higher pigment content can be explained by the depletion of oxygen as a consequence of the reaction of other phenolic compounds with oxygen, instead of the anthocyanins/pigments.
HPLC data for individual phenolics
Results obtained for the RP-LC analysis of selected individual phenolic concentrations are summarised in Tables 1 and 2. The different extracts, the presence/absence of oxygen and storage time played a role in affecting the phenolic composition of the treatments. Large differences in gallic acid concentrations were found between the three extracts. Higher amounts of seeds led to an obvious increase in gallic acid content (Table 1) at 0 M. From time 0 M to 3 M, a consistent decrease in the gallic acid concentration was observed for all samples, possibly linked to the formation of new polymeric forms (especially in SK4SD), precipitation or degradation reactions. The hypothetical interaction between gallic acid quinones and flavonol units has recently been reported (Mouls & Fulcrand, 2015). The concentration of polymeric phenols was also significantly higher in SKSD and SK4SD compared to SK samples (Table 2). These differences between the extracts remained over time. Over the storage time investigated (especially from 6 M), the polymeric phenol content was generally higher in Ox treatments. Therefore, the presence and reactivity of seed derived compounds and oxygen may influence polymerisation reactions.
Higher total flavonol contents were found in the Ox samples; however, the total hydroxycinnamic acid concentrations were higher in the C samples. Unexpectedly, the total hydroxycinnamic acid content seemed to slightly increase over time (Table 2), although in some cases not significantly. Literature reports a general decrease of hydroxycinnamic acid concentrations during storage (García-Falcón et al., 2007). However, an increase of certain hydroxycinnamic acids has also been observed (García-Falcón et al., 2007; Arapitsas et al., 2014), possibly as a result of copigment degradation expected to occur over time (Bimpilas et al., 2016).
Likewise, a large decrease was observed in the anthocyanin concentrations of all treatments from 0 M (Table 1) to 3 M (Table 2). The larger decrease in anthocyanin levels observed in the C treatments was not associated with the formation of higher polymeric pigments (Table 2). Nevertheless, the HPLC results confirmed the idea of certain oxidative reactions between phenols being favoured in the presence of oxygen. The oxidation of ethanol and tartaric acid could possibly have led to the formation of ethyl bridged structures between tannins moieties, thereby leading to lower reactivity of free anthocyanins. This may explain the higher concentration of monomeric anthocyanins found after 3 M, in the treatments where higher levels of seeds were present and oxygen added. Supporting this, after 3 M of storage, SK and SKSD samples showed a greater decrease in glucosylated, acetylated and coumaroylated anthocyanins in the absence of oxygen. On the other hand, SK4SD samples initially had higher concentration of polymeric pigments, thereby influencing the polymerisation reactions. These differences between the extracts in the concentrations of polymeric pigments, for both C and Ox samples, were also found at 3 M, but disappeared after 6 M of storage. In the interpretation of these results, we cannot discard the possibility that certain polymeric pigments are not detected by the RP-HPLC method. Nevertheless, after 6 M, all treatments experienced anthocyanin degradation and differences between treatments became smaller. The decrease in anthocyanins showed different rates among the different extracts. This delay may be linked to the excess of seed phenolics, with a higher reactivity in the presence of oxygen, and the exposure to several severe oxidations. These repeated oxidations could lead to over polymerisation, forming phenolic derived compounds not stable in solution, therefore precipitating. This anthocyanin degradation over time has been widely reported in red wines, and is at least partly a consequence of the formation of pigmented polymers (Somers, 1971; Somers & Evans, 1979; Pérez-Magarino & González-SanJosé, 2004; Arapitsas et al., 2014; Quaglieri et al., 2017). Also, the loss of anthocyanin derived forms over time was previously reported to be lower in oxygenated wines (Atanasova et al., 2002).
CONCLUSIONS
To date, a number of studies have focused on the impact of seed addition or removal on the colour, phenolic profile and sensory properties of wines (Meyer & Hernandez, 1970; Canals et al., 2008; Lee et al., 2008; Guaita et al., 2017), but there is a lack of information on the evolution of these wine parameters with age, as well as on the role of oxygen in this process. The main goal of this study was to assess the impact of oxygen addition on the phenolic composition of WL extracts containing three different defined A/T ratios. The extract composition seemed to play a greater role than the oxygen in phenolic evolution. Our results highlight the importance of the initial A/T ratio and of the nature of these respective compound classes on the polymerisation reactions occurring during initial stages of ageing. The higher the concentration of phenols in the solution, the greater the number of molecules susceptible to polymerise, and therefore the greater the competition between these substrates. In this context, seed derived phenols showed a high reactivity to form larger polymeric structures, both in the absence or presence of oxygen. Nevertheless, as a consequence of the oxidative process, excessive seed content may enhance the polymerisation reactions between proanthocyanidins, and thereby favour remaining of free monomeric anthocyanins in solution. The increase in polymeric phenols (Table 2), together with the higher levels of TRP (Table 1 supplementary data) and of monomeric anthocyanins (total glucosylated, acetylated and coumaroylated forms) in the SK4SD-Ox samples after 3M of storage (Table 2), support this idea.
Further research needs to investigate not only the impact of different phenolic ratios on the phenolic stability, but also the polymerisation reactions in the presence of different grape polysaccharides and protein proportions.
LITERATURE CITED
Adams, D.O., 2006. Phenolics and ripening in grape berries. Am. J. Enol. Vitic. 57, 249-256. [ Links ]
Arapitsas, P., Corte, A., Della., Gika, H., Narduzzi, L., Mattivi, F. & Theodoridis, G., 2016. Studying the effect of storage conditions on the metabolite content of red wine using HILIC LC-MS based metabolomics. Food Chem. 197, 1331-1340. [ Links ]
Arapitsas, P., Scholz, M., Vrhovsek, U., Blasi, S., Biondi, A., Masuero, D., Perenzoni, D., Rigo, A. & Mattivi, F., 2012. A Metabolomic Approach to the Study of Wine Micro- Oxygenation. PLoS ONE 7, 1-11. [ Links ]
Arapitsas, P., Speri, G., Angeli, A., Perenzoni, D. & Mattivi, F., 2014. The influence of storage on the '"chemical age"' of red wines. Metabolomics 10, 816-832. [ Links ]
Atanasova, V., Fulcrand, H., Cheynier, V. & Moutounet, M., 2002. Effect of oxygenation on polyphenol changes occurring in the course of wine-making. Analytica Chimica Acta. 458, 15-27. [ Links ]
Bimpilas, A., Panagopoulou, M., Tsimogiannis, D. & Oreopoulou, V., 2016. Anthocyanin copigmentation and color of wine : The effect of naturally obtained hydroxycinnamic acids as cofactors. Food Chem. 197, 39-46. [ Links ]
Bimpilas, A., Tsimogiannis, D., Balta-Brouma, K., Lymperopoulou, T. & Oreopoulou, V., 2015. Evolution of phenolic compounds and metal content of wine during alcoholic fermentation and storage. Food Chem. 178, 164171. [ Links ]
Bindon, K.A., Smith, P.A. & Kennedy, J.A., 2010. Interaction between Grape-Derived Proanthocyanidins and Cell Wall Material. Effect on Proanthocyanidin Composition and Molecular Mass. J. Agric. Food Chem. 58, 2520-2528. [ Links ]
Boulton, R., 2001. The copigmentation of anthocyanins and its role in the color of red wine: a critical review. Am. J. Enol. Vitic. 52, 67-87. [ Links ]
Canals, R., Llaudy, C., Miquel, J. & Fernando, C., 2008. Influence of the elimination and addition of seeds on the colour, phenolic composition and astringency of red wine. Am. J. Enol. Vitic. 226, 1183-1190. [ Links ]
Carrascón, V., Vallverdú-Queralt, A., Meudec, E., Sommerer, N., Fernandez-Zurbano, P. & Ferreira, V., 2018. The kinetics of oxygen and SO2 consumption by red wines. What do they tell about oxidation mechanisms and about changes in wine composition? Food Chem. 241, 206-214. [ Links ]
Casassa, L.F., 2017. Flavonoid Phenolics in Red Winemaking. Phenolic Compounds - Natural Sources, Importance and Applications [ Links ]
Castellari, M., Matricardi, L., Arfelli, G., Galassi, S. & Amati, A., 2000. Level of single bioactive phenolics in red wine as a function of the oxygen supplied during storage. Food Chem. 69, 61-67. [ Links ]
Cheynier, V., Salas, E., Souquet, J., Sarni-Manchado, P. & Fulcrand, H., 2006. Structure and Properties of Wine Pigments and Tannins. Am. J. Enol. Vitic. 3, 298-305. [ Links ]
Coetzee, C., Van Wyngaard, E., Suklje, K., Silva Ferreira, A.C. & Du Toit, W.J., 2016. Chemical and Sensory Study on the Evolution of Aromatic and Nonaromatic Compounds during the Progressive Oxidative Storage of a Sauvignon blanc Wine. J. Agric. Food Chem. 64, 7979-7993. [ Links ]
Dallas, C., Ricardo-da-Silva, J.M. & Laureano, O., 1996. Interactions of Oligomeric Procyanidins in Model Wine Solutions Containing Malvidin-3-Glucoside and Acetaldehyde. J. Sci. Food Agric. 70, 493-500. [ Links ]
Danilewicz, J.C., 2007. Interaction of sulfur dioxide, polyphenols, and oxygen in a wine-model system: Central role of iron and copper. Am. J. Enol. Vitic. 58, 53-60. [ Links ]
Es-Safi, N.E., Fulcrand, H., Cheynier, V. & Moutounet, M., 1999. Studies on the acetaldehyde-induced condensation of (-)-epicatechin and malvidin 3-O-glucoside in a model solution system. J. Agric. Food Chem. 47, 20962102. [ Links ]
Fulcrand, H., Cameira dos Santos, P.J., Sarni-Manchado, P., Cheynier, V. & Favre-Bonvin, J., 1996. Structure of new anthocyanin-derived wine pigments. J. Chem. Soc. 69, 60. [ Links ]
Gambuti, A., Rinaldi, A., Ugliano, M. & Moio, L., 2013. Evolution of Phenolic Compounds and Astringency during Aging of Red Wine: Effect of Oxygen Exposure before and after Bottling. J. Agric. Food Chem. 61, 1618-1627. [ Links ]
García-Falcón, M.S., Pérez-Lamela, C., Martínez-Carballo, E. & Simal-Gándara, J., 2007. Determination of phenolic compounds in wines: Influence of bottle storage of young red wines on their evolution. Food Chem. 105, 248-259. [ Links ]
Garrido-Banuelos, G., Buica, A., Schückel, J., Zietsman, A.J.J., Willats, W.G.T., Moore, J.P. & Du Toit, W.J., 2019. Investigating the relationship between grape cell wall polysaccharide composition and the extractability of phenolic compounds into Shiraz wines. Part I: Vintage and ripeness effects. Food Chem. 278, 36-46. [ Links ]
Geldenhuys, L., Oberholster, A. & Du Toit, W., 2012. Monitoring the Effect of Micro-oxygenation before Malolactic Fermentation on South African Pinotage Red Wine with Different Colour and Phenolic Analyses. SA J. Enol. Vitic. 33, 150-160. [ Links ]
González-Manzano, S., Rivas-Gonzalo, J.C. & Santos-Buelga, C., 2004. Extraction of flavan-3-ols from grape seed and skin into wine using simulated maceration. Analytica Chimica Acta. 513, 283-289. [ Links ]
González-Manzano, S., Santos-Buelga, C., Pérez-Alonso, J.J., Rivas-Gonzalo, J.C. & Escribano-Bailón, M.T., 2006. Characterization of the mean degree of polymerization of proanthocyanidins in red wines using Liquid Chromatography-Mass Spectrometry (LC-MS). J. Agric. Food Chem. 54, 4326-4332. [ Links ]
Guaita, M., Petrozziello, M., Panero, L., Tsolakis, C., Motta, S. & Bosso, A., 2017. Influence of early seeds removal on the physicochemical, polyphenolic, aromatic and sensory characteristics of red wines from Gaglioppo cv. Eur. Food Res. Technol. 243, 1311-1322. [ Links ]
He, F., Liang, N., Mu, L., Pan, Q., Wang, J., Reeves, M.J. & Duan, C., 2012a. Anthocyanins and Their Variation in Red Wines I. Monomeric Anthocyanins and Their Color Expression. Molecules. 17, 1571-1601. [ Links ]
He, F., Liang, N., Mu, L., Pan, Q., Wang, J., Reeves, M.J. & Duan, C., 2012b. Anthocyanins and Their Variation in Red Wines II. Anthocyanin Derived Pigments and Their Color Evolution. Molecules 17, 1483-1519. [ Links ]
Kennedy, J.A., Saucier, C. & Glories, Y., 2006. Grape and Wine Phenolics: History and Perspective. Am. J. Enol. Vitic. 3, 20-21. [ Links ]
Lee, J., Kennedy, J.A., Devlin, C., Redhead, M. & Rennaker, C., 2008. Effect of early seed removal during fermentation on proanthocyanidin extraction in red wine: A commercial production example. Food Chem. 107, 1270-1273. [ Links ]
Mattivi, F., Vrhovsek, U., Masuero, D. & Trainotti, D., 2009. Differences in the amount and structure of extractable skin and seed tannins amongst red grape varieties. Aust. J. Grape Wine Res. 15, 27-35. [ Links ]
McRae, J.M., Day, M.P., Bindon, K.A., Kassara, S., Schmidt, S.A., Schulkin, A., Kolouchova, R. & Smith, P.A., 2015. Effect of early oxygen exposure on red wine colour and tannins. Tetrahedron 71, 3131-3137. [ Links ]
Meyer, B.J. & Hernandez, R., 1970. Seed Tannin Extraction in Cabernet Sauvignon. Am. J. Enol. Vitic. 21, 184-188. [ Links ]
Monagas, M., Gómez-Cordovés, C. & Bartolome, B., 2006. Evolution of the phenolic content of red wines from Vitis vinifera L. during ageing in bottle. Food Chem. 95, 405-412. [ Links ]
Mouls, L. & Fulcrand, H., 2015. Identification of new oxidation markers of grape-condensed tannins by UPLC e MS analysis after chemical depolymerization. Tetrahedron 71, 3012-3019. [ Links ]
Pascual, O., González-Royo, E., Gil, M., Gómez-Alonso, S., García-Romero, E., Canals, J.M., Hermosín-Gutiérrez, I. & Zamora, F., 2016. Influence of Grape Seeds and Stems on Wine Composition and Astringency. J. Agric. Food Chem. 64, 6555-6566. [ Links ]
Pascual, O., Vignault, A., Gombau, J., Navarro, M., Gómez-Alonso, S., García-Romero, E., Canals, J.M., Hermosín-Gutiérrez, I., Teissedre, P.L. & Zamora, F., 2017. Oxygen consumption rates by different oenological tannins in a model wine solution. Food Chem. 234, 26-32. [ Links ]
Peleg, H., Gacon, K., Schlich, P. & Noble, A.C., 1999. Bitterness and astringency of flavan-3-ol monomers, dimers and trimers. J. Sci. Food and Agric. 79, 1123-1128. [ Links ]
Pérez-Magarino, S. & González-SanJosé, M.L., 2004. Evolution of flavanols, anthocyanins, and their derivatives during the aging of red wines elaborated from grapes harvested at different stages of ripening. J. Agric. Food Chem. 52, 1181-1189. [ Links ]
Peyrot Des Gachons, C. & Kennedy, J.A., 2003. Direct Method for Determining Seed and Skin Proanthocyanidin Extraction into Red Wine. J. Sci. Food Agric. 51, 5877-5881. [ Links ]
Picariello, L., Gambuti, A., Picariello, B. & Moio, L., 2017. Evolution of pigments, tannins and acetaldehyde during forced oxidation of red wine: Effect of tannins addition. LWT - Food Sci. Technol. 77, 370-375. [ Links ]
Quaglieri, C., Jourdes, M., Waffo-Teguo, P. & Teissedre, P.L., 2017. Updated knowledge about pyranoanthocyanins: Impact of oxygen on their contents, and contribution in the winemaking process to overall wine color. Trends Food Sci. Technol. 67, 139-149. [ Links ]
Ribéreau-Gayon, P., Glories, Y., Maujean, A. & Dubourdieu, D., 2006 (Vol. 2). Handbook of Enology. The chemistry of wine. Stabilization and treatments. John Wiley & Sons, LTD, [ Links ]
Sarneckis, C.J., Dambergs, R.G., Jones, P., Mercurio, M., Herderich, M.J. & Smith, RA., 2006. Quantification of condensed tannins by precipitation with methyl cellulose: Development and validation of an optimised tool for grape and wine analysis. Aust. J. Grape Wine Res. 12, 39-49. [ Links ]
Saucier, C., Bourgeois, G., Vitry, C., Roux, D. & Glories, Y., 1997. Characterization of (+)-Catechin-Acetaldehyde Polymers: A Model for Colloidal State of Wine Polyphenols. J. Agric. Food Chem. 45, 1045-1049. [ Links ]
Singleton, V.L., 1987. Oxygen with phenols and related reactions in musts, wines, and model systems: observations and practical implications. Am. J. Enol. Vitic. 38, 69-77. [ Links ]
Singleton, V.L. & Trousdale, E.K., 1992. Anthocyanin-Tannin Interactions Explaining differences in polymeric phenols between white and red wines. Am. J. Enol. Vitic. 43, 63-70. [ Links ]
Somers, T.C., 1971. The Polymeric Nature of Wine Pigments. Phytochem. 10, 2175-2186. [ Links ]
Somers, T.C. & Evans, M.E., 1974. Wine Quality: Correlations with Colour Density and Anthocyanin Equilibria in a Group of Young Red Wines. J. Agric. Food Chem. 25, 1369-1379. [ Links ]
Somers, T.C. & Evans, M.E., 1979. Grape pigment phenomena: Interpretation of major colour losses during vinification. J. Sci. Food Agric. 30, 623-633. [ Links ]
Souquet, J.M., Cheynier, V., Brossaud, F. & Moutounet, M., 1996. Polymeric proanthocyanidins from grape skins. Phytochem. 43, 509-512. [ Links ]
Sparrow, A.M., Dambergs, R.G., Bindon, K.A., Smith, P.A. & Close, D.C., 2015. Interaction of Grape Skin, Seed, and Pulp Tissues on Tannin and Anthocyanin Extraction in Pinot noir Wines. Am. J. Enol. Vitic., 1-27. [ Links ]
Springer, L.F., Chen, L.A., Stahlecker, A.C., Cousins, P. & Sacks, G.L., 2016. Relationship of Soluble Grape-Derived Proteins to Condensed Tannin Extractability during Red Wine Fermentation. J. Agric. Food Chem. 64, 8191-8199. [ Links ]
Timberlake, C.F. & Bridle, P., 1977. Anthocyanins: Colour Augmentation with Catechin and Acetaldehyde. J. Sci. Food Agric. 28, 539-544. [ Links ]
Du Toit, W.J., Marais, J., Pretorius, I.S. & Du Toit, M., 2006. Oxygen in must and wine: A review. SA J. Enol. Vitic. 27, 76-94. [ Links ]
Versari, A., Du Toit, W. & Parpinello, G.P., 2013. Oenological tannins: A review. Aust. J. Grape Wine Res. 19, 1-10. [ Links ]
Vignault, A., González-Centeno, M.R., Pascual, O., Gombau, J., Jourdes, M., Moine, V., Iturmendi, N., Canals, J.M., Zamora, F. & Teissedre, P.L., 2018. Chemical characterization, antioxidant properties and oxygen consumption rate of 36 commercial oenological tannins in a model wine solution. Food Chem. 268, 210-219. [ Links ]
Waterhouse, A.L. & Laurie, V.F., 2006. Oxidation of wine phenolics: A critical evaluation and hypotheses. Am. J. Enol. Vitic. 57, 306-313. [ Links ]
Wirth, J., Morel-Salmi, C., Souquet, J.M., Dieval, J.B., Aagaard, O., Vidal, S., Fulcrand, H. & Cheynier, V., 2010. The impact of oxygen exposure before and after bottling on the polyphenolic composition of red wines. Food Chem. 123, 107-116. [ Links ]
Yacco, R.S., Watrelot, A.A. & Kennedy, J.A., 2016. Red Wine Tannin Structure-Activity Relationships during Fermentation and Maceration. J. Agric. Food Chem. 64, 860-869. [ Links ]
Submitted for publication: February 2019
Accepted for publication: May 2019
* Corresponding author: E-mail address: abuica@sun.ac.za
# Present address: Product Design and Perception, RISE Research Institutes of Sweden - Agrifood and Bioscience, Box 5401, S-402 29, Göteborg, Sweden.
Acknowledgements: The authors would like to thank Winetech, Thrip and NRF for financial support


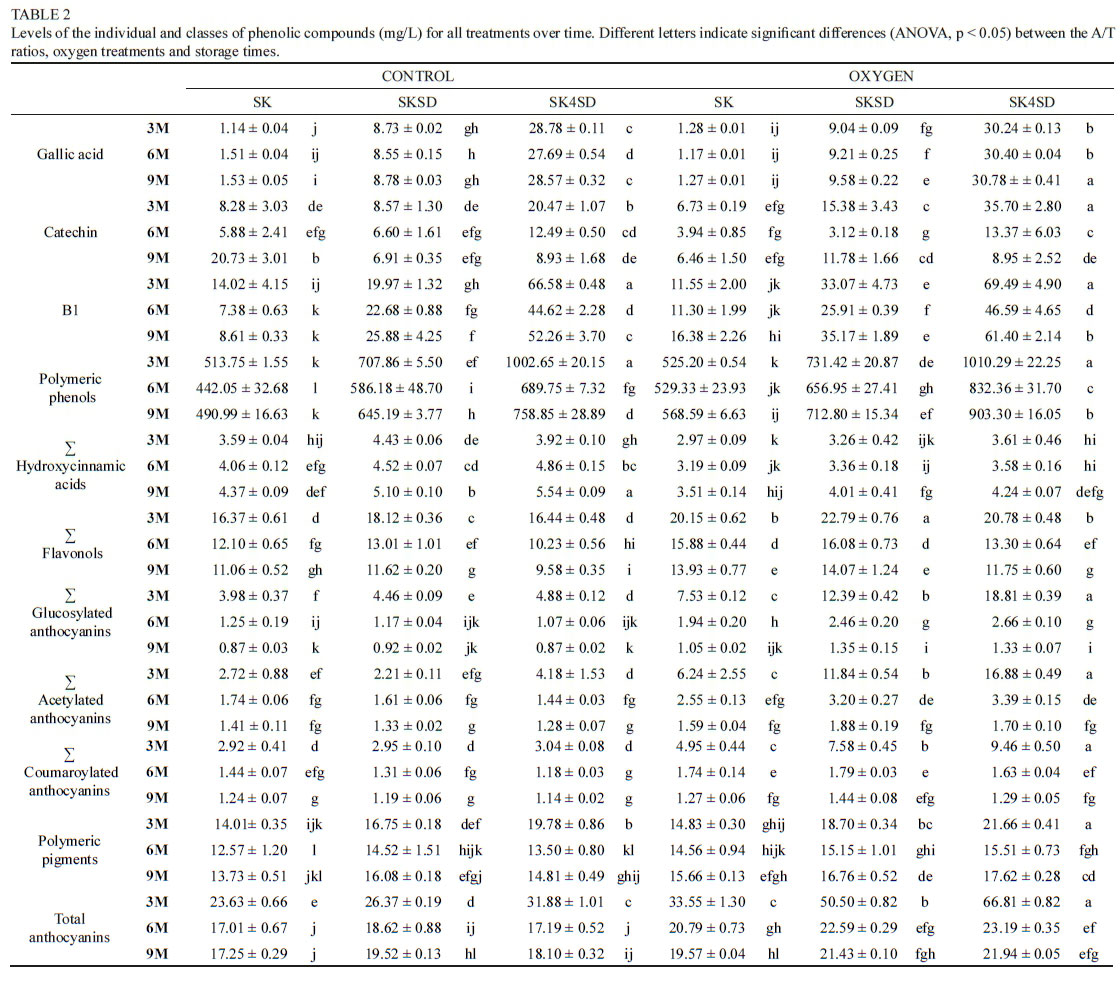
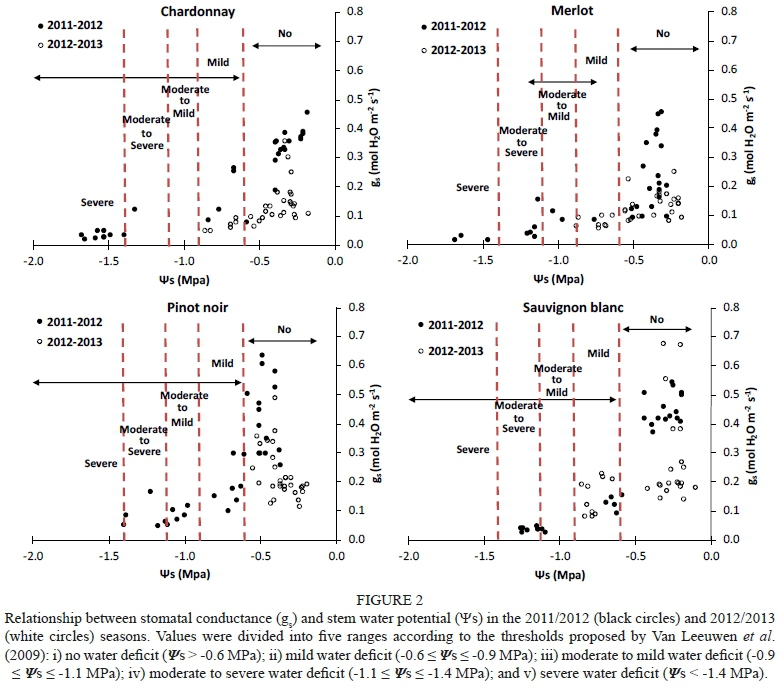
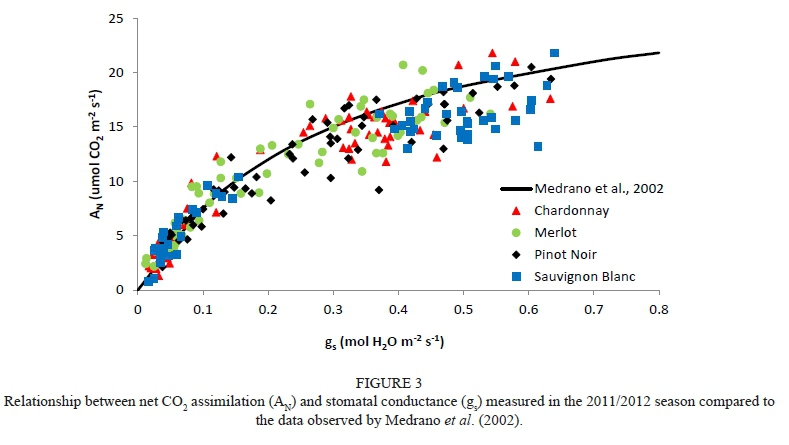
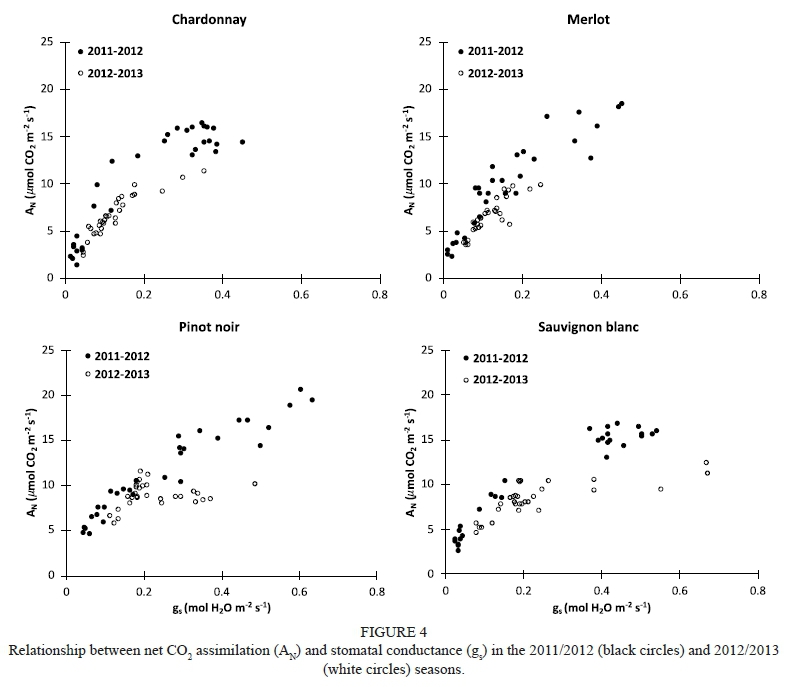
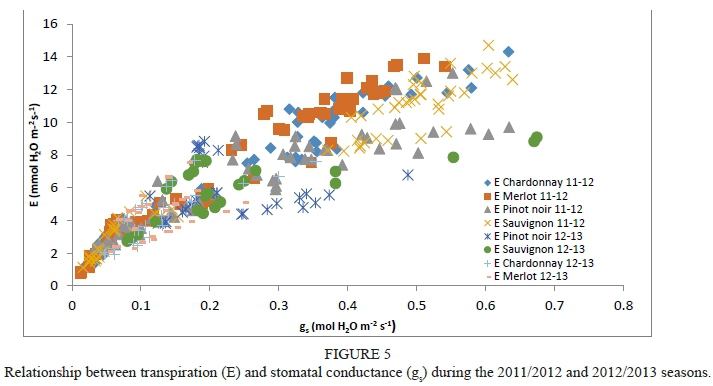
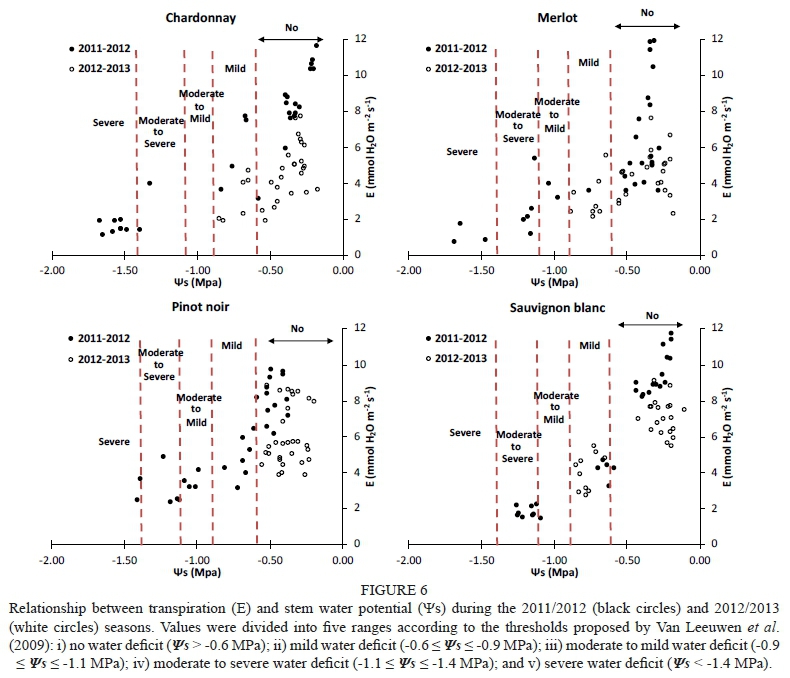
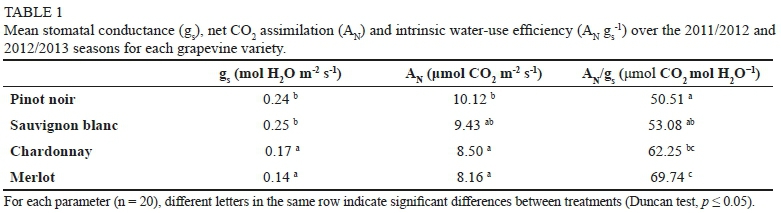
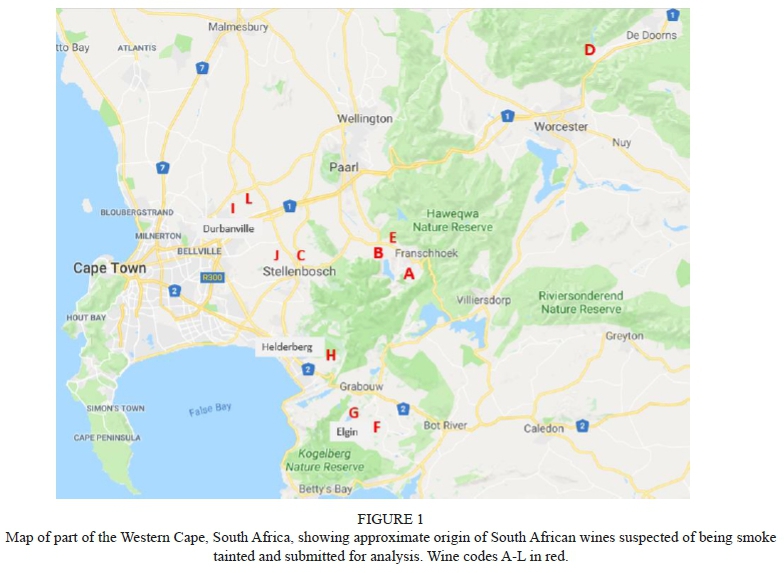
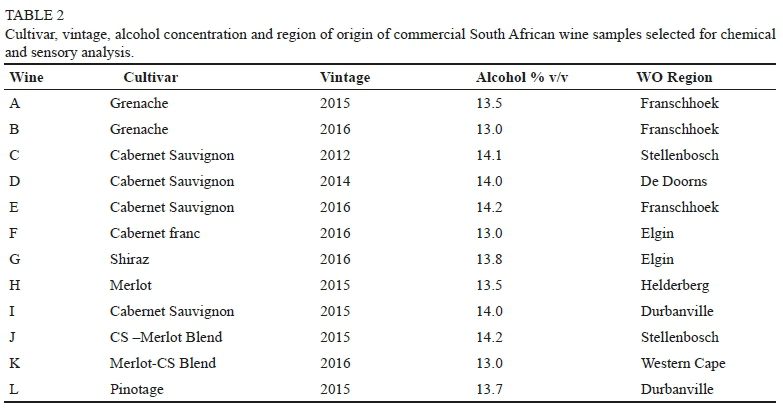
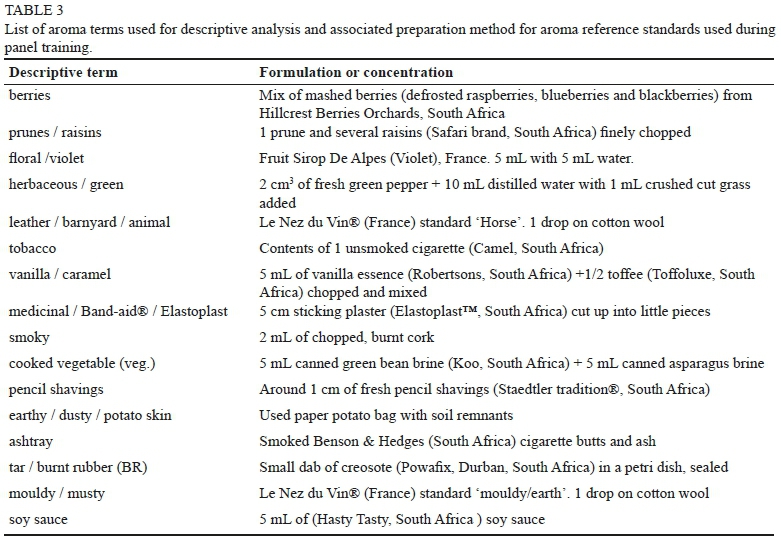
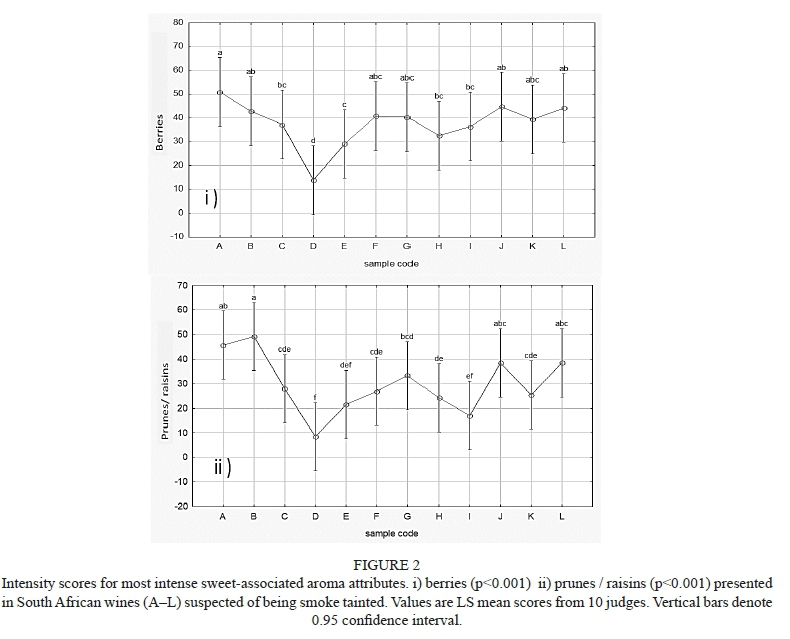
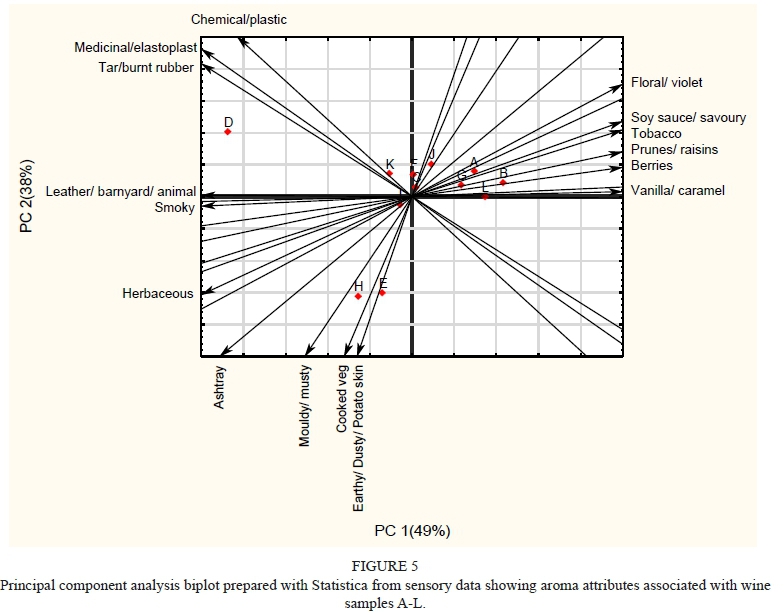
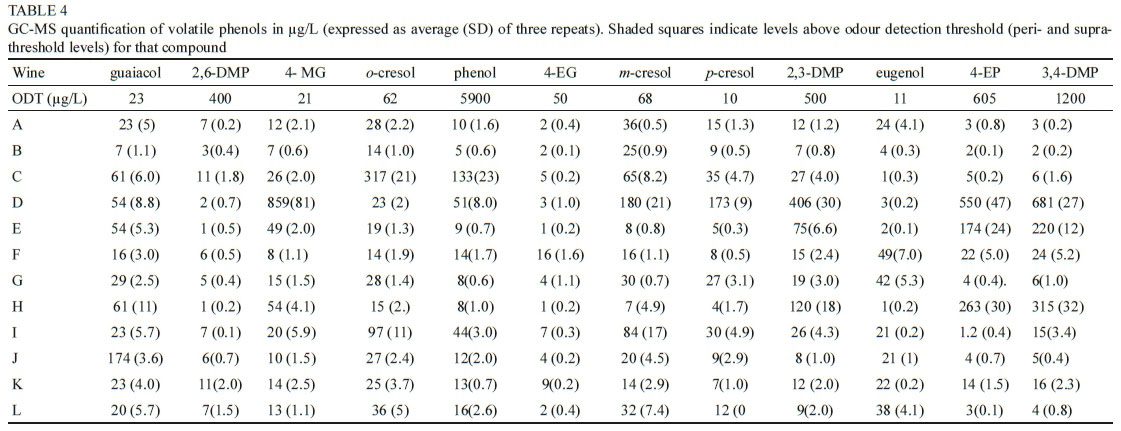
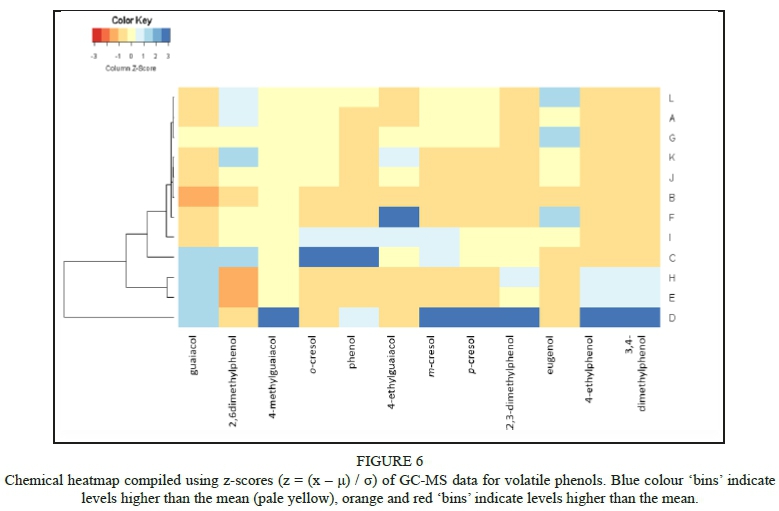
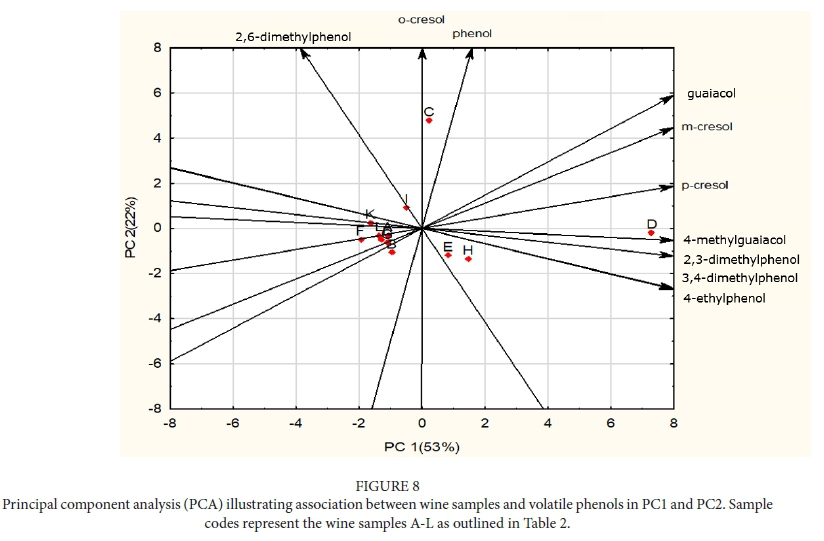
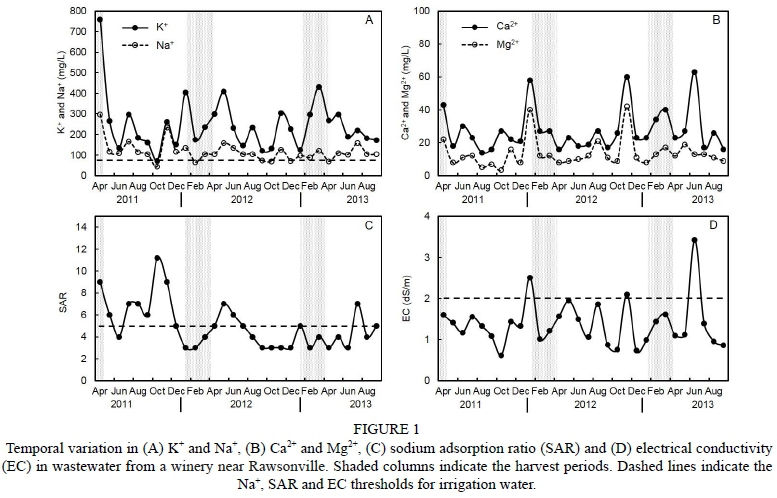
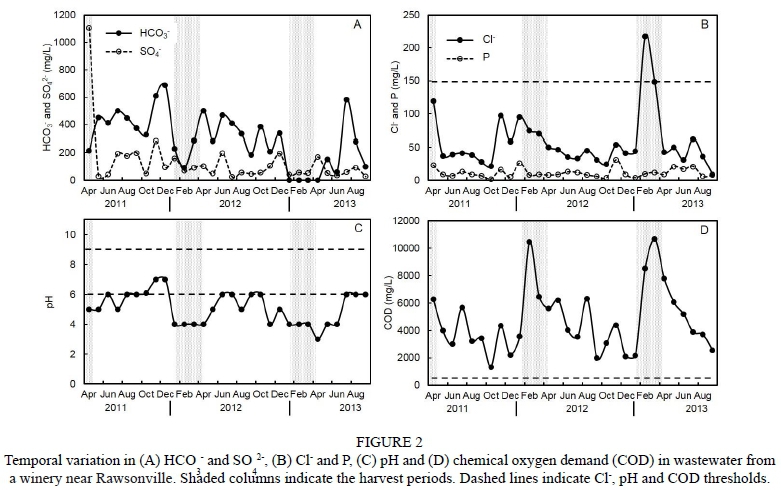
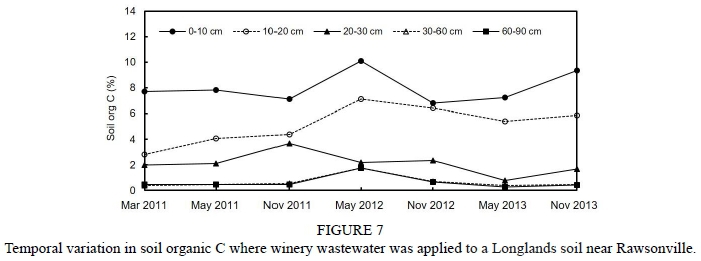
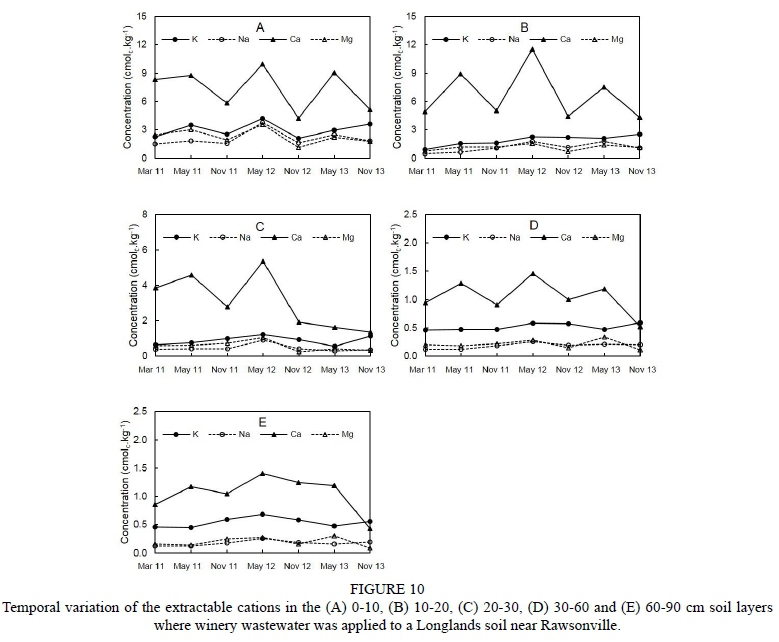
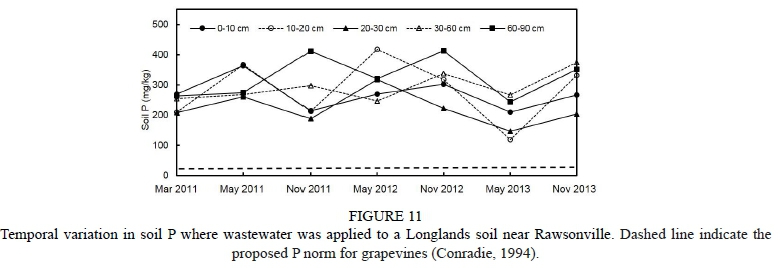
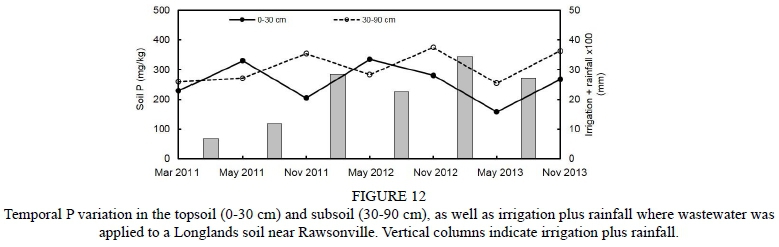
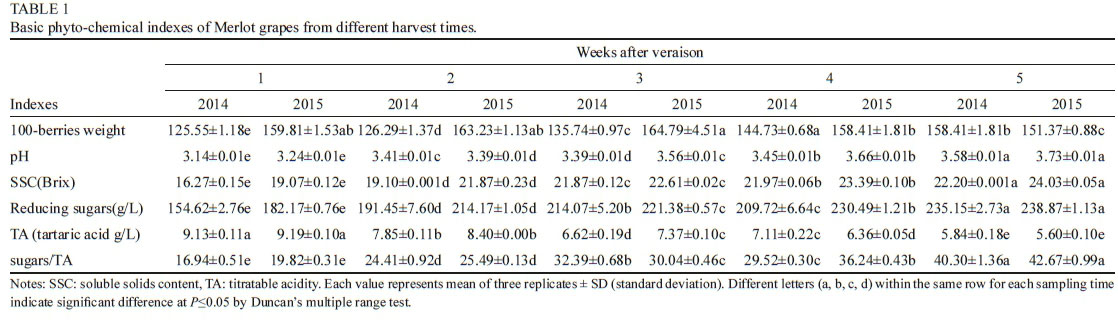
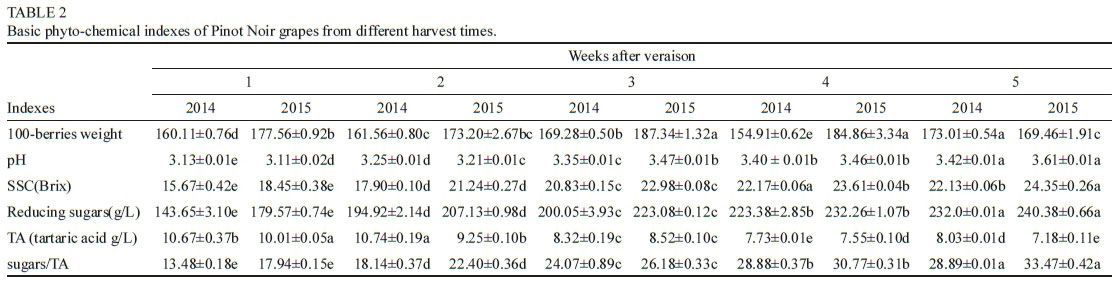
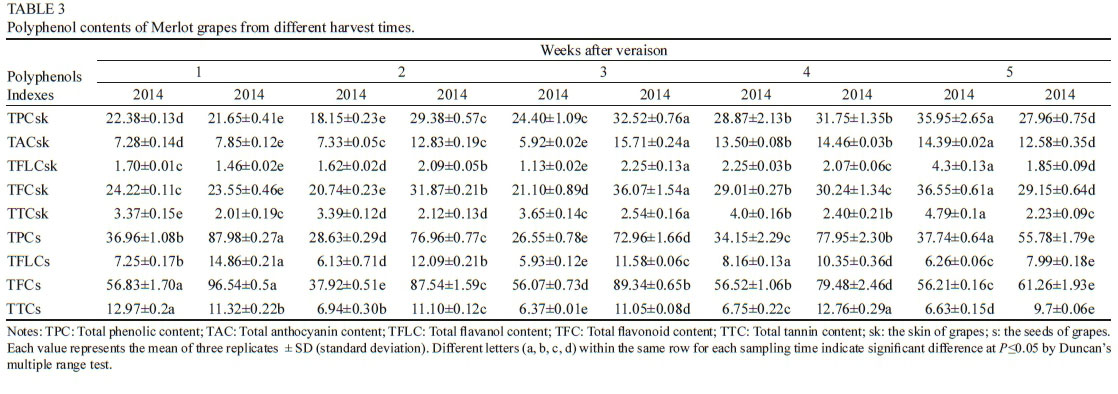
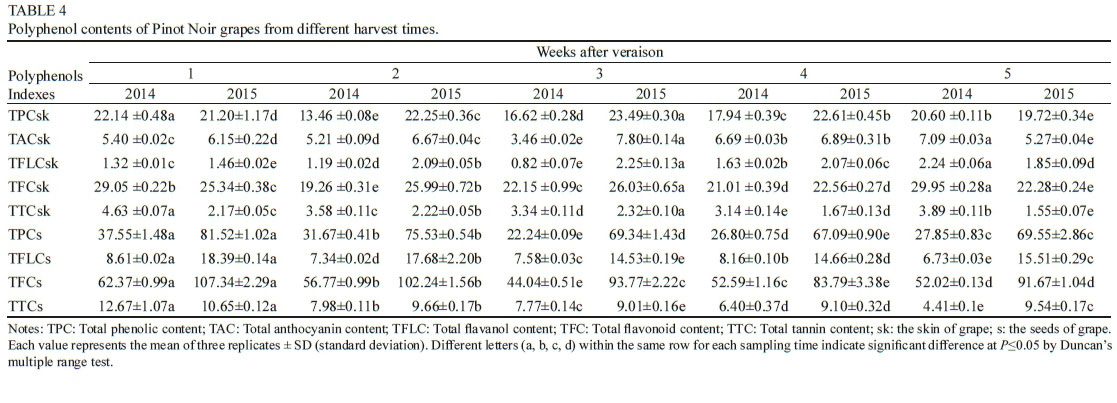
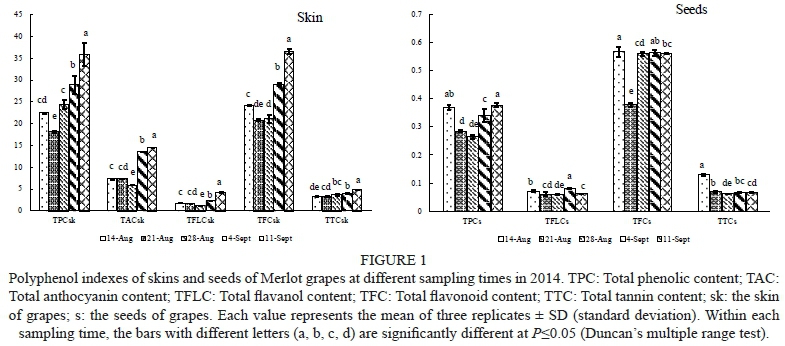
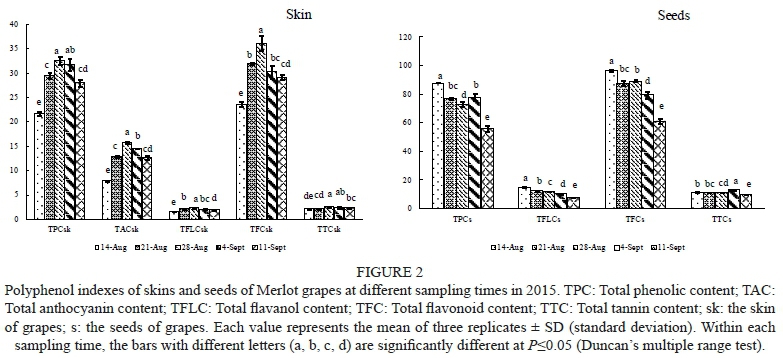
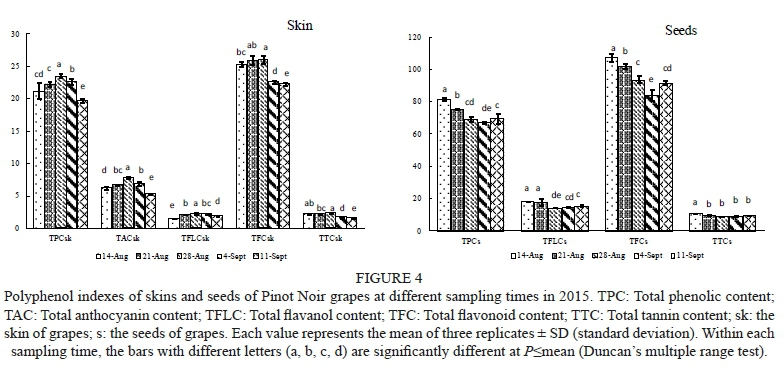
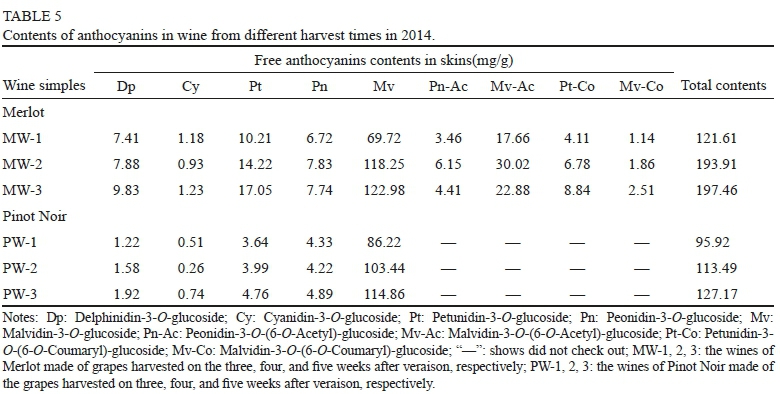
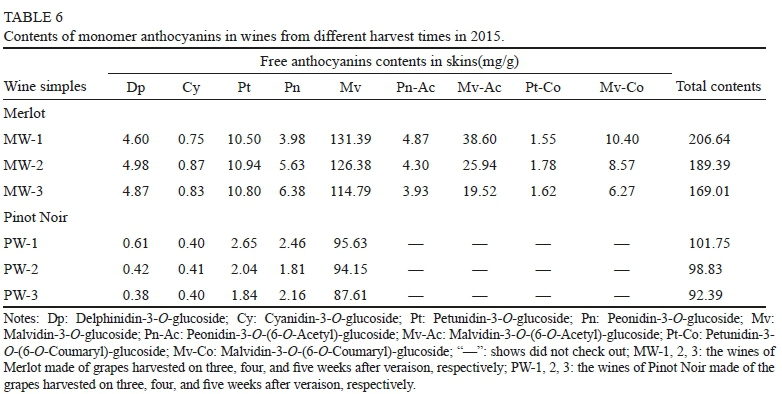
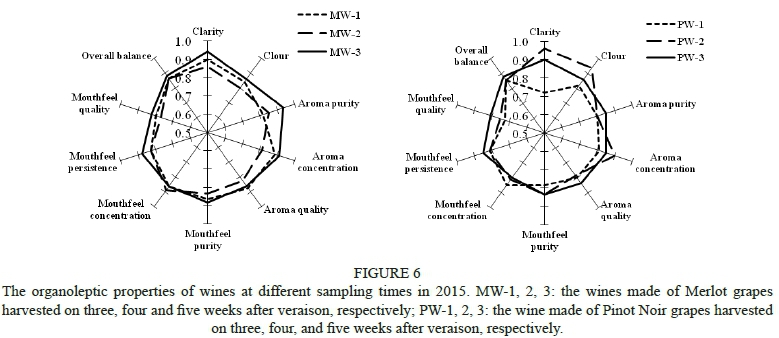
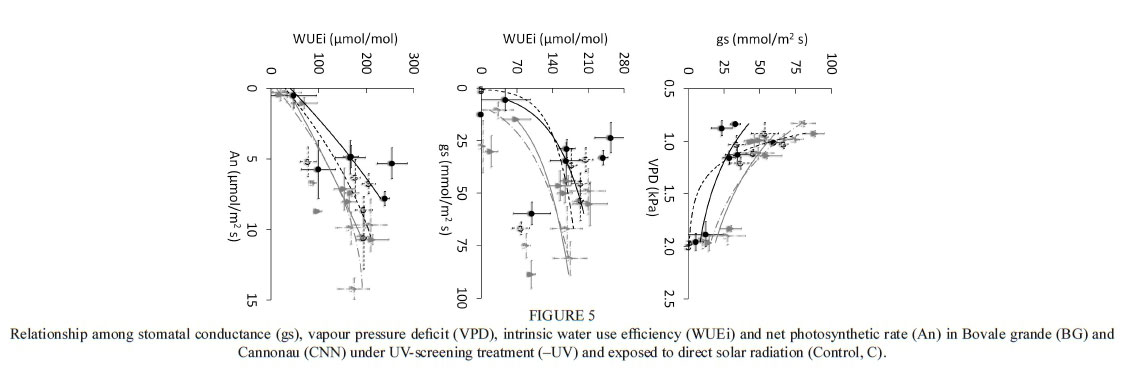
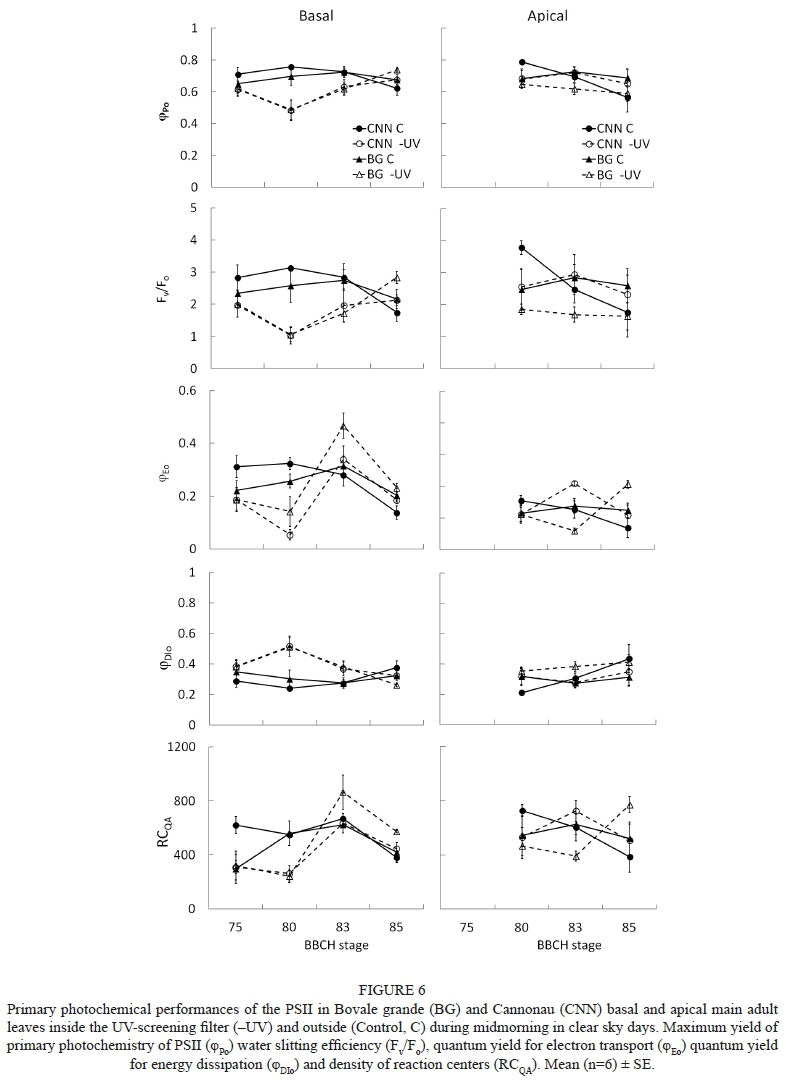
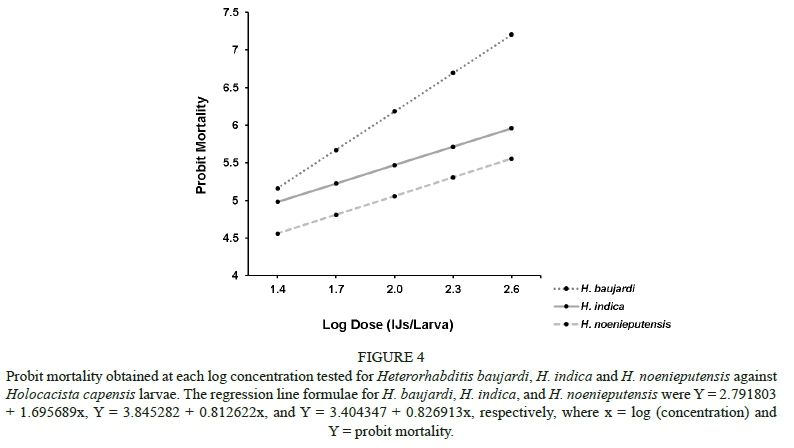
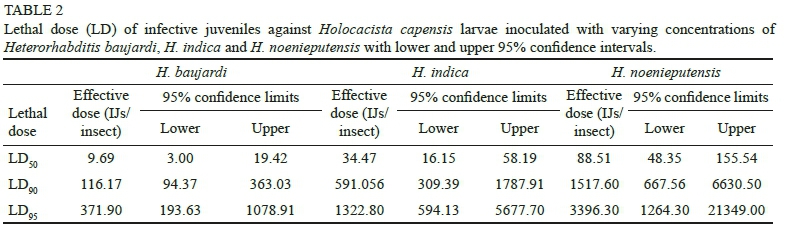
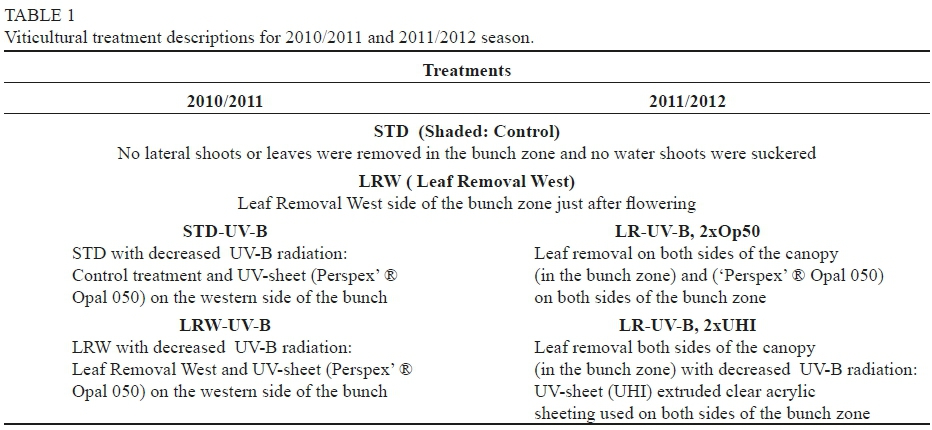
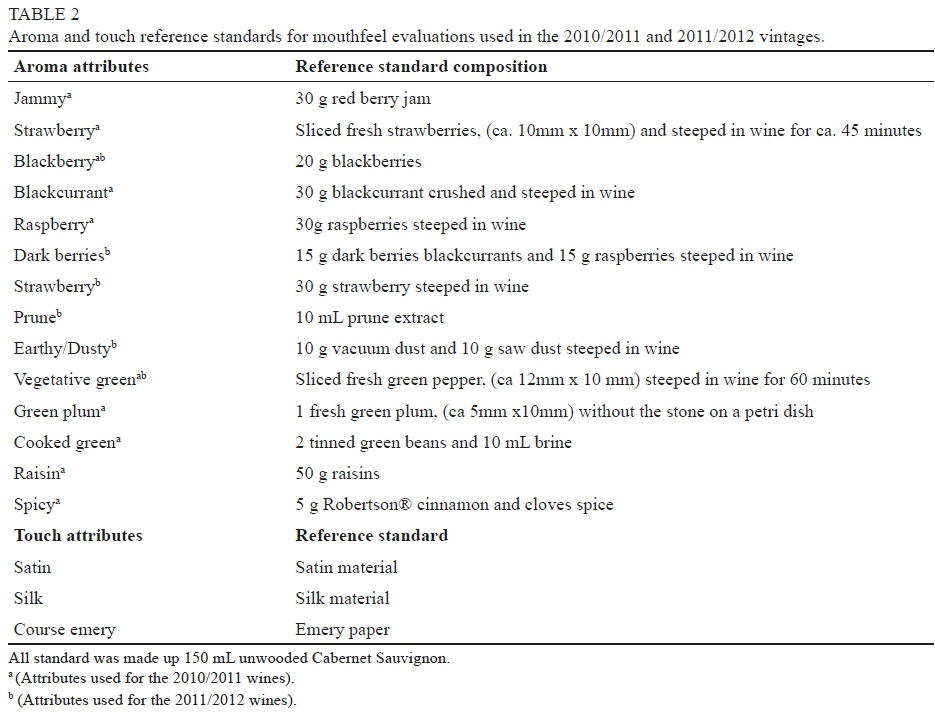
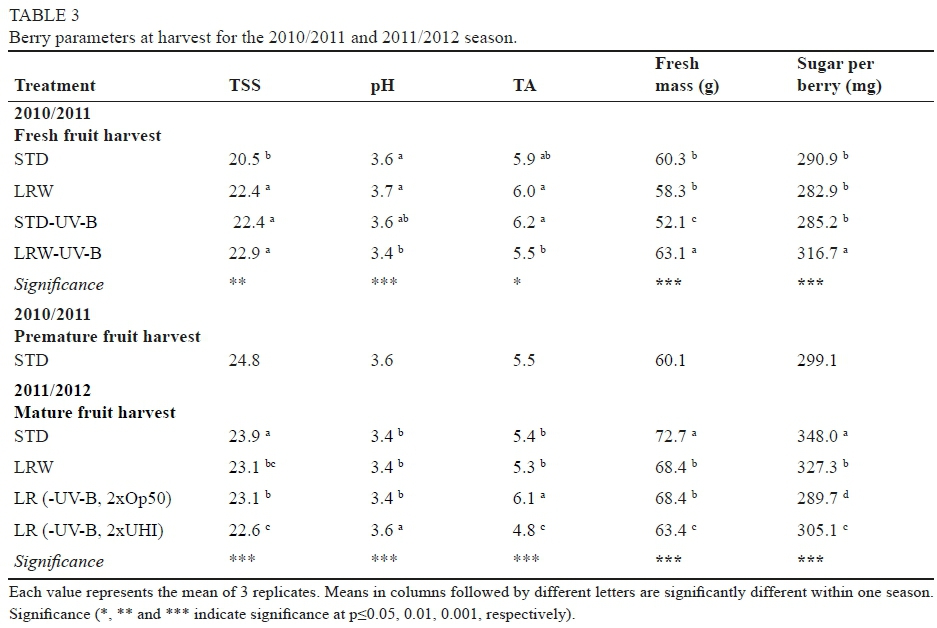
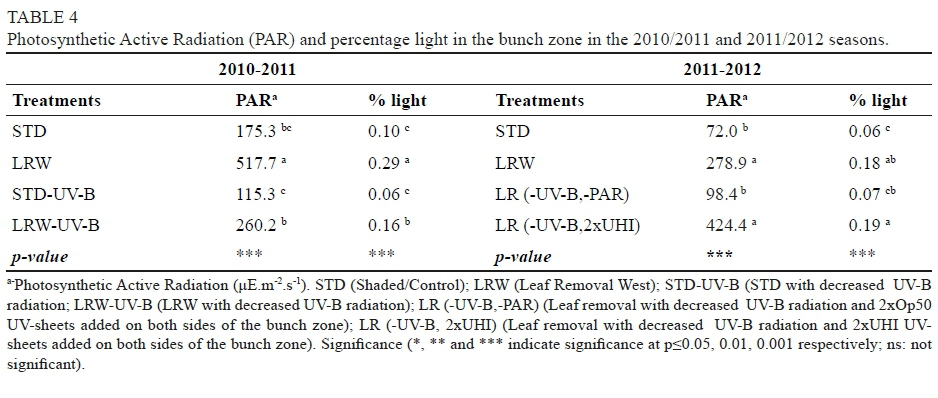
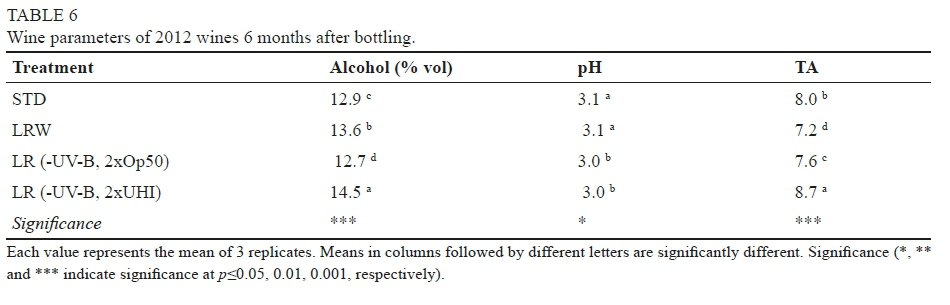
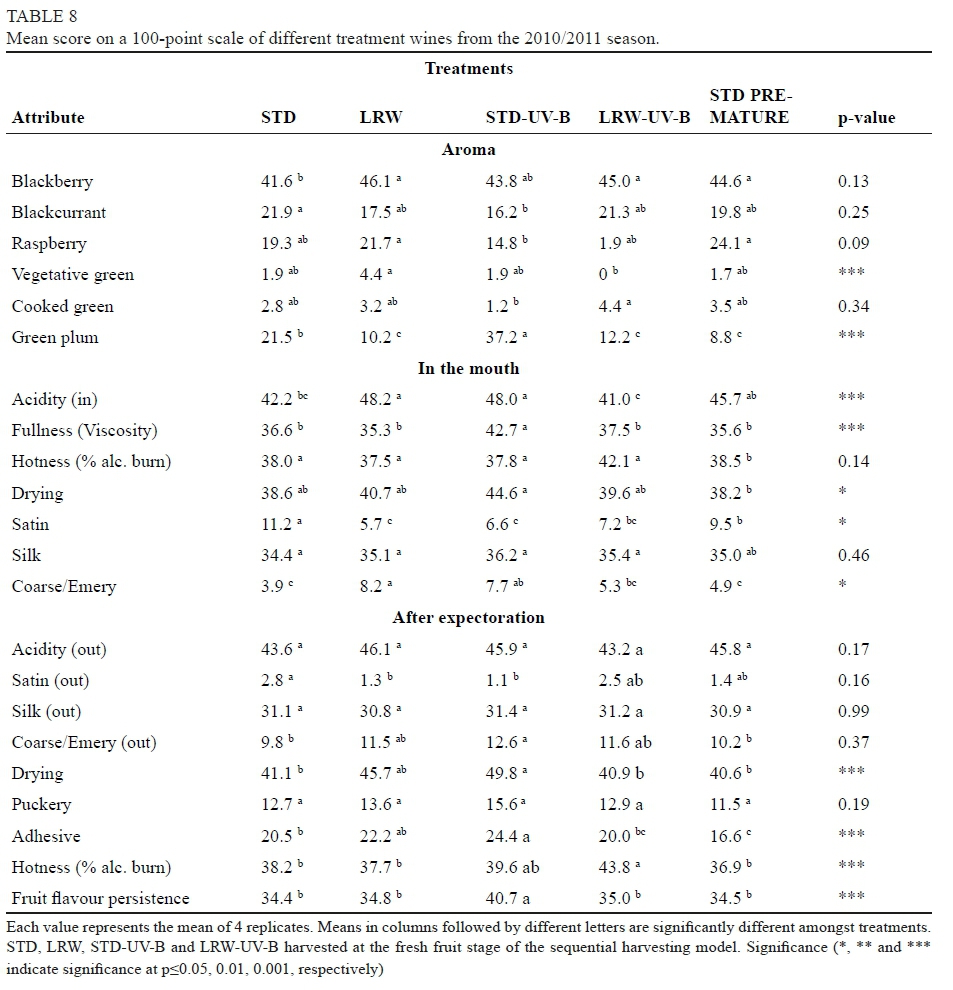
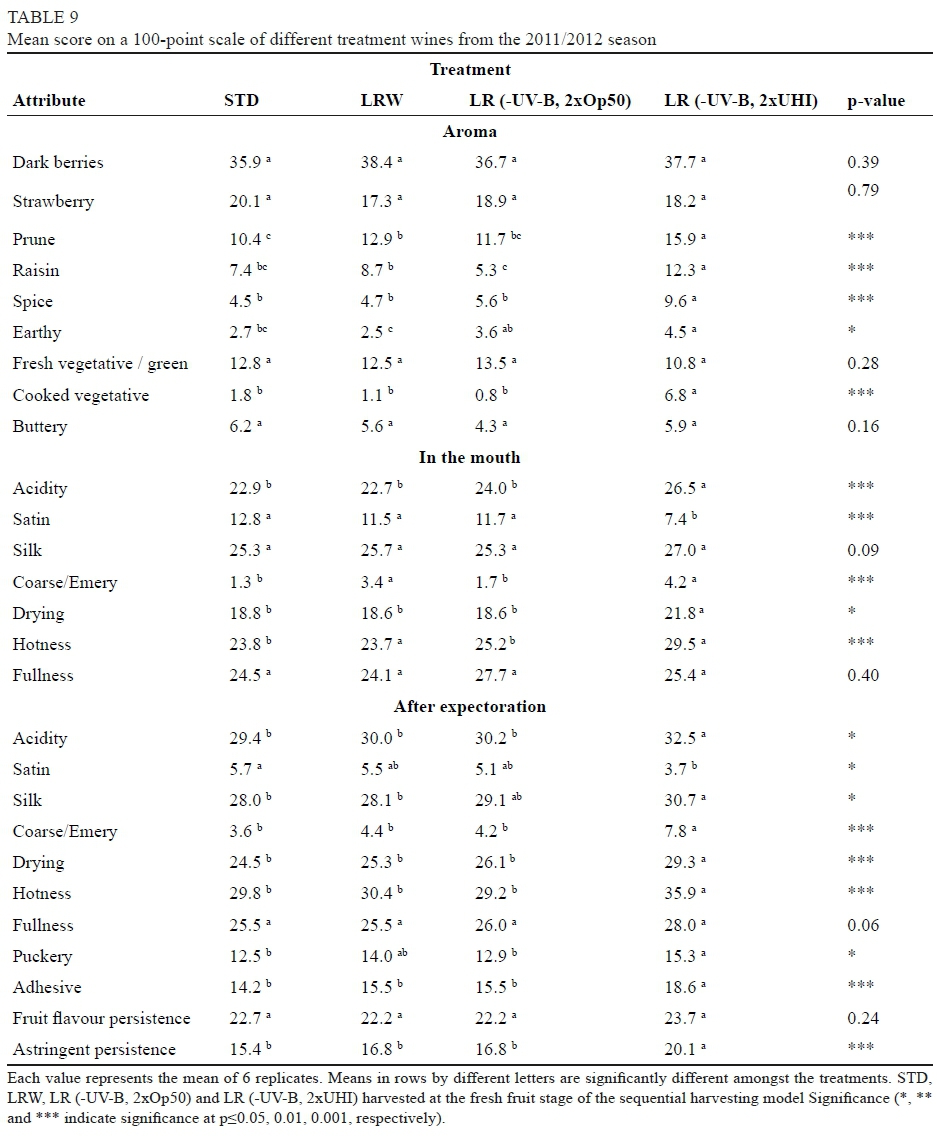