


Services on Demand
Article
 English (pdf)
 Article in xml format
 Article references
Indicators

Related links
-
 Cited by Google
 -
 Similars in Google
Share

 Permalink
South African Journal of Enology and Viticulture
On-line version ISSN 2224-7904
Print version ISSN 0253-939X
S. Afr. J. Enol. Vitic. vol.40 n.2 Stellenbosch 2019
http://dx.doi.org/10.21548/40-2-3373
ARTICLES
doi: http://dx.doi.org/10.21548/40-2-3373
Grape Must Profiling And Cultivar Discrimination Based On Amino Acid Composition And General Discriminant Analysis With Best Subset
G. PetrovicI; J.L. Aleixandre-TudoII; A. BuicaI, II, *
IDepartment of Viticulture and Oenology, P/Bag X1 Matieland, Stellenbosch 7600, South Africa
IIInstitute for Grape and Wine Sciences, P/Bag X1 Matieland, Stellenbosch 7600, South Africa
ABSTRACT
The present study aimed to elucidate the amino acid profile of a number of grapevine cultivars relevant to the South African wine industry using 738 grape must samples obtained during the 2016 and 2017 harvests. Proline and arginine were found to be the most abundant amino acids, with an average of 697.69 mg/L for proline (range 33.22-3445.43 mg/L) and 388.35 mg/L for arginine (range 13.56-1616.56 mg/L) across all vintages, regions, and cultivars. At the other extreme, ornithine (2.01 mg/L), glycine (3.28 mg/L), methionine (3.64 mg/L) and lysine (3.91 mg/L) were found to have the lowest concentrations, both in terms of the overall average, as well as per cultivar. Furthermore, the data were used to demonstrate how characteristic the amino acid profile is of a particular group (red or white) or cultivar. Cultivars were predicted based on their average amino acid concentrations using general discriminant analysis (GDA) and the best subset principle. For white musts, Chardonnay showed the highest prediction accuracy (100%), and Pinotage (75%) for red cultivars. Overall, the white cultivars included in this study were more accurately distinguished from one another (75.6%) compared to the red (60.1%). This predictive ability was subsequently compared to the accuracy of predicting cultivars based on only the arginine and proline concentrations as well as the ratio between the two. The use of only these amino acids as well as the addition of the proline/arginine ratio as a predictor variable did not offer satisfactory discriminatory power between either white or red cultivars.
Key words: grape must amino acid composition, grape cultivars, General Discriminant Analysis (GDA), best subset, prediction, misclassification
INTRODUCTION
The grape juice matrix presents the yeast with a complex mixture of nutrients during fermentation. Nitrogenous compounds are, however, one of the most important classes, second only to carbon (Bely et al., 1990b; Stines et al., 2000). As sugar is in most cases present in sufficient quantities to support the growth of the yeast during fermentation, the nitrogen concentration of the must has been identified as the most common cause for stuck or sluggish fermentations (Bisson, 1999). The assimilable portion of the grape juice matrix is referred to as yeast assimilable nitrogen (YAN) and is primarily made up of ammonium and free amino nitrogen (FAN) (Bell & Henschke, 2005).
The free amino nitrogen portion is comprised of an array of amino acids and has been reported to make up 50-90% of the grape must YAN (Kliewer, 1969; 1970). Due to the number of amino acids contributing to FAN, the specific profile and concentration of amino acids have become an important area of research. This is mainly attributed to the complex role that amino acids play in the metabolic activities of the yeast and, subsequently, the effect that it has on the quality of the final wine (Ugliano et al., 2007). This complexity can be illustrated by the fact that not all amino acids are equally substantial in supporting the growth of the yeast, and thus, there is a preferential uptake of certain amino acids (Beltran et al., 2004). Consequently, certain amino acids are denoted as 'good' sources of nitrogen and others as 'poor'. Aside from ammonium, amino acids which are preferred by the yeast include glutamate, glutamine, aspartate, asparagine and arginine, whereas tryptophan, histidine, glycine, and lysine are considered as poor sources of nitrogen (Cooper, 1982; Beltran et al., 2004). On the other hand, proline, the most abundant amino acid (together with arginine) (Ough & Bell, 1980; Stines et al., 2000) is not considered as a source of YAN during fermentative conditions. This is due to the oxygen requirement of the first step involved in proline catabolism (Wang & Brandriss, 1987).
Other than fulfilling the biosynthetic requirement of the yeast, and thereby ensuring optimal fermentation kinetics, the oenological relevance of amino acid metabolism stems from the range of by-products that are subsequently produced. These by-products have been reported to have a significant impact on the organoleptic qualities of the final wine (Rapp & Versini, 1991). Of particular interest is the formation of higher alcohols and esters due to the presence of branched-chain (valine, leucine, and isoleucine) and aromatic (tryptophan, tyrosine, and phenylalanine) amino acids (Rapp & Versini, 1991; Hernández-Orte et al., 2002; Torrea, 2003; Vilanova et al., 2007; Smit, 2013; Rollero et al., 2018). As these amino acids are the precursor molecules for aroma compounds a direct link exists between the presence of the amino acid and the corresponding higher alcohol and ester (Rapp & Versini, 1991). However, a study conducted by Hernández-Orte, Cacho, and Ferreira (Hernández-Orte et al., 2002) found that the amino acid composition influences the concentration of other compounds for which amino acids are not the direct precursors. Examples of these include ethanol, acetic acid, as well as fatty acids. This is in support of an earlier report which found that YAN levels influence all the primary and secondary products of glycolysis which is owed to the involvement of nitrogen in regulating the transport, metabolism and accumulation of sugar by the yeast (Boulton et al., 1999). Furthermore, the nitrogen content of the must has been reported to induce de novo synthesis of monoterpenes, previously thought to only originate from the grape berry itself (Carrau et al., 2005).
Additionally, the amino acid content of the must has been found to influence the presence of various unwanted compounds, detrimental to the quality and safety of the wine. A deficiency in the sulphur-containing amino acids, cysteine and methionine, as well as an overall low level of YAN has been linked to the production of hydrogen sulphide (H2S), known to elicit a rotten egg-like aroma (Swiegers & Pretorius, 2007; Gobbi et al., 2013). Furthermore, arginine has been implicated in the production of a carcinogen, ethyl carbamate, through a spontaneous chemical reaction of ethanol with carbamyl-related compounds such as urea (released by yeast) and citrulline (released by lactic acid bacteria) (Ough et al., 1988a; Guo et al., 2016). However, the balance of other amino acids in relation to arginine is also said to play a role (Ough et al., 1988b; Ough et al., 1991). Moreover, the decarboxylation of amino acids by lactic acid bacteria, typically occurring in conditions of nitrogen excess, has been found to lead to the formation of biogenic amines (Smit et al., 2012). As these compounds are known to have potentially harmful physiological effects on human beings, they are a matter of concern for the wine industry (Landete et al., 2007).
The amino acid profile of a particular grape must is a result of a variety of factors. These include the interaction between the genetic background of the vine with the surrounding environment. In other words, an interplay of the grape variety with the climate, soil, and various viticultural practices, exists (Bell & Henschke, 2005; Garde-Cerdán et al., 2009). This knowledge has prompted the investigation of various grape compositional elements in relation to the variety, geographical origin, and vintage of the resulting wine (Soufleros et al., 2003; De Villiers et al., 2005; Camara et al., 2006; Liu et al., 2006; Serrano-Lourido et al., 2012; Geana et al., 2016). Subsequently, these compositional parameters of the grape juice matrix can be used as predictors for the abovementioned factors and link to wine authenticity. Wine has become an important commodity world-wide and therefore, ensuring that imported wines are of a particular quality, and have not been illegally adulterated, is in the interest of producers, consumers and the relevant authorities (Geana et al., 2016). However, the profiling of wines can be further complicated by the fermentation process (through the use of various conditions and strains of yeast and bacteria), aging, and storage conditions (Styger et al., 2011).
The prediction of a grape variety based on compositional parameters of the grape must is less common. This is most likely due to the minimal economical relevance. However, the accurate prediction of a grape must variety and origin based on a component of the grape juice matrix implies that the component is characteristic of that particular variety or origin. This information may aid the understanding of winemakers and viticulturists, and, subsequently, help them to make more informed decisions regarding practices and processes that could be employed to ensure the desired quality and style of the final wine.
Due to the central role of nitrogenous compounds in yeast metabolism and, consequently, the modulation of the organoleptic qualities of the resulting wine, knowledge of the amino acid profile would be advantageous. This is especially relevant in terms of the direction that nitrogen research is currently moving in, whereby the specific nitrogen demand of various strains of Saccharomyces cerevisiae (Vilanova et al., 2007) and non-Saccharomyces yeast (Rollero et al., 2018) are being investigated. Therefore, this study aimed to elucidate the amino acid profile of a number of grapevine cultivars relevant to the South African wine industry.
MATERIALS AND METHODS
Sample Collection
The amino acid profile of 738 commercial grape juices was obtained over the 2016 and 2017 harvests. Samples were collected from various grape-growing districts across the Western Cape region of South Africa. All of the white cultivars' samples were collected as settled juices and red cultivars directly after crushing. All cultivars were harvested at a ripeness level suitable for commercial winemaking, according to the cellars participating in the survey. Samples were coded upon collection and stored at -20°C until analysis.
The survey followed an unsupervised format, resulting in the collection of 13 different cultivars, seven white and six red. The cultivars collected included: Cabernet Franc (n=13), Cabernet Sauvignon (n=38) Chardonnay (n=97), Chenin Blanc (n=176), Cinsaut (n=15), Grenache Blanc (n=17), Merlot (n=29), Pinotage (n=12), Roussanne (n=15), Sauvignon Blanc (n=219), Sémillon (n=16), Shiraz (n=51), and Viognier (n=40).
Amino Acid Analysis
Amino acids analysed were: alanine (Ala), arginine (Arg), aspartic acid (Asp), γ-amino butyric acid (GABA), glutamine (Gln), glutamic acid (Glu), glycine (Gly), histidine (His), hydroxyproline (Hyp), isoleucine (Ile), leucine (Leu), lysine (Lys), methionine (Met), ornithine (Orn), phenylalanine (Phe), proline (Pro), serine (Ser), threonine (Thr), tryptophan (Trp), and valine (Val).
Determination of individual amino acids was done using the AccQ-Tag Ultra amino acid kit (Waters), according to the method described in the application note (APNT134965704, 2018). The standard solution used was purchased from Thermo Scientific and it contained 2.5 μΜ/mL of each amino acid with the exception of cysteine which was at 1.25 μΜ/mL. Additional amino acids which were included in the analysis (tryptophan, ornithine, glutamine, and γ-amino butyric acid) were prepared initially as a stock solution of 2.5 μΜ/mL each. Norvaline (Nrv) was used as Internal Standard (IS). Stock solutions of standards were diluted from 1/2 to 1/1000 for the 11-point calibration (1250 nM/mL to 1.25 nM/mL). Sample preparation for both calibration standards and samples consisted of 800 μL sample to which 200 μL IS (200 ppm Nrv) were added and vortexed. Ten μL of this mixture, 70 μL of buffer and 20 μL of derivatization reagent were thoroughly mixed, followed by incubation at 55°C for 10 min and then placed in the autosampler tray of the instrument. The instrumental analysis was performed on a Waters Acquity UPLC system with photodiode array (PDA) detector at 254 nm. Injection volume was 1 μL, eluent flow rate 0.7 mL/min, and column temperature 60°C.
Statistical Analysis
Box plots were constructed using the statistical software SPPS (IBM Corp. Released 2017. IBM SPSS Statistics for Windows, Version 25.0. Armonk, NY: IBM Corp). General discriminant analysis was performed using the statistical software package STATISTICA (version 13, TIBCO Software Inc. 2017, http://statistica.io).
RESULTS AND DISCUSSION
This study had two major aims: (i) to provide insight into the amino acid composition of a range of grape varieties, as well as (ii) to investigate the predictive ability of the amino acid profile in discriminating between the various cultivars included in the study. Therefore, the discussion will proceed by first describing the amino acid profiles by identifying the most abundant, as well as the least abundant amino acids for each variety. Subsequently, the potential significance of the respective amino acids is discussed in the context of the grapevine and fermentation. To address the second aim, the amino acid profile was first investigated for its ability to predict whether a particular variety was red or white. In addition to this, separate models for red and white cultivars were built to investigate whether the complete amino acid profile (from which subsets were selected) or proline, arginine and the proline/arginine ratio were better at identifying the specific variety.
Proline and arginine
Proline and arginine were found to be the most abundant amino acids, with an average of 697.69 mg/L for proline (range 33.22-3445.43 mg/L) and 388.35 mg/L for arginine (range 13.56-1616.56 mg/L) across all vintages, regions, and cultivars (Supplementary Tables 1-10, Supplementary Figure 1). This is in agreement with previous studies surveying the amino acid content of Vitis vinifera varieties, where these amino acids were in most cases found to be orders higher than the rest (Kliewer, 1970; Huang & Ough, 1991; Spayd & Andersen-Bagge, 1996; Stines et al., 2000). The large variation obtained is most likely due to the inclusion of different varieties and geographical origins across both vintages surveyed.
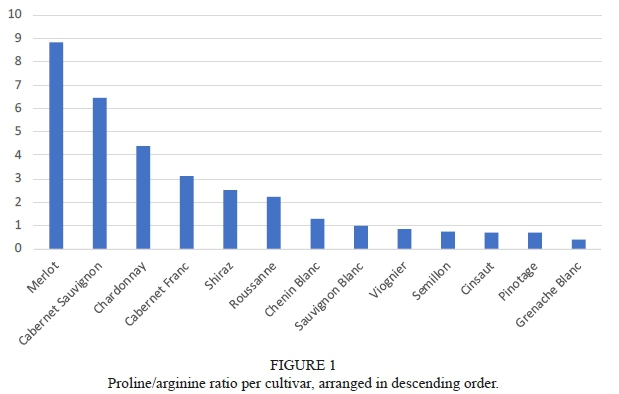
Early studies of amino acid profiles of grapevine have suggested that the proline to arginine ratio can be used as an index to discriminate between cultivars (Huang & Ough, 1991). Thus, future studies started profiling cultivars according to whether they were proline or arginine accumulators, with proline accumulators indicated by a ratio of >1 and arginine accumulators indicated by a ratio of <1. Merlot, Cabernet Sauvignon, and Chardonnay were found to be the highest proline accumulators, whereas Cinsaut, Pinotage, and Grenache Blanc were found to be the lowest proline accumulators (Figure 1). Sauvignon Blanc, on the other hand, was observed to have on average, equal concentrations of proline and arginine. These results are all similar to what has been found previously (Kliewer, 1970; Huang & Ough, 1991; Spayd & Andersen-Bagge, 1996; Stines et al., 2000; Hannam et al., 2016). However, although Merlot was found to have a high proline:arginine ratio, Huang and Ough (1991) and Spayd and Andersen-Bagge (1996) found Cabernet Sauvignon to have higher ratios than Merlot, contrary to the findings of the present study where Merlot had the highest proline to arginine ratio (proline:arginine 8.83). Interestingly, the study conducted by Huang and Ough (1991), also found a ratio of exactly one for Sauvignon Blanc in the 1987 vintage sampled. However, in the following year, Sauvignon Blanc grapes had higher arginine concentrations, possibly due to the different origin (Huang & Ough, 1991). Furthermore, Chardonnay is consistently found to be the white cultivar with the highest proline to arginine ratio (Kliewer, 1970; Huang & Ough, 1991; Spayd & Andersen-Bagge, 1996; Stines et al., 2000; Hannam et al., 2016).
Bell and Henschke (Bell & Henschke, 2005), proposed that this ratio could also be used as an indicator of the ratio of assimilable nitrogen to non-assimilable nitrogen (i.e. N compounds not readily assimilated by yeast). This rule seems to hold up for most cultivars, for example, Grenache Blanc, Pinotage and Cinsaut are all high-YAN yielding cultivars (Petrovic et al., 2019), with a proline to arginine ratio of <1 and vice versa for cultivars such as Merlot, Cabernet Sauvignon and Cabernet Franc. On the other hand, this rule does not appear to apply for Chardonnay, a cultivar that is typically found to have very high average YAN concentrations (Butzke, 1998; Nicolini et al., 2004; Hagen et al., 2008). The ratio of proline to arginine as a cultivar indicator was, however, not found to be feasible by Spayd and Andersen-Bagge (1996) due to the large variation found in the juices surveyed.
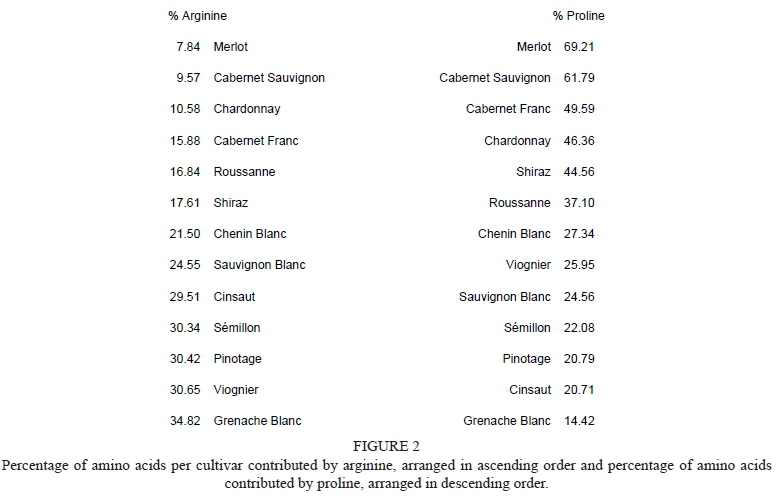
Proportionally, for the amino acids quantified in this study, proline was observed to make up from 14.4% (Grenache Blanc) to 69.21% (Merlot) and on average 35.7% of the grape juice amino acid content (Supplementary Table 3, Figure 1). Moreover, proline contributed to approximately half (49.6%) and two-thirds (61.8%) of the amino content present in Cabernet Franc and Cabernet Sauvignon juices, respectively (Supplementary Table 3). The similar proline content between Merlot, Cabernet Sauvignon and Cabernet Franc is not surprising due to the close genetic relationships exhibited between these cultivars (Myles et al., 2011). On the other hand, arginine content ranged between 7.8% for Merlot to 34.82% for Grenache Blanc (Supplementary Table 3). When arranging the percentage of arginine content from least to most and proline from most to least, in most cases the cultivars line up or are relatively close to lining up (Figure 2). Therefore, it appears that proline and arginine concentrations are, to a degree, inversely proportional to one another.
Proline and arginine metabolism in the grapevine is linked via a common intermediate, ornithine. During arginine synthesis, ornithine is formed as an intermediate from glutamate, and again when arginine is broken down through arginase. Ornithine can, however, also result in the formation of P5C (A1-pyrroline-5-carboxylate) which is a precursor of proline (Majumdar et al., 2015). Thus, due to their linked metabolism, this inverse relationship between proline and arginine makes sense.
Proline accumulation in the grape berry occurs towards the end of ripening, typically in the last 4-6 weeks before harvest (Stines et al., 1999). The reason for proline accumulation in plants is, however, a topic of debate. Most commonly, proline accumulation has been identified as a stress-response mechanism, protecting tissues against oxidative and osmotic stress. Another theory proposes that, rather than being an adaptive mechanism, the accumulation of proline is a product of the stress imposed on the plant (Ashraf & Foolad, 2007).
However, Stines et al. (1999) found that the accumulation of proline in the grape berry is independent from the stress-induced pathway and that the accumulation is essentially a part of normal fruit development. This was hypothesised due to the findings that the proline accumulation occurring in developing berries were not regulated by fluctuations in P5CS (A1-pyrroline-5-carboxylate synthetase) mRNA or protein levels associated with proline biosynthesis from glutamate, or by changes in the levels of PDH (proline dehydrogenase) - proteins which are related to the breakdown of proline. Therefore, other regulatory mechanisms were thought to be involved. However, the synthesis of proline from ornithine through the OAT (ornithine δ-aminotranferase) pathway could also not be confirmed in this study. Thus, Stines et al. (1999), does not provide conclusive evidence as to the mechanisms involved in proline accumulation during berry development, although they refute the stress-related hypothesis. Furthermore, in a later study by Stines et al. (2000), investigating the accumulation of proline and arginine in grape berries in relation to berry maturity, tissue type and cultivar, it is argued that stress-induced proline accumulation does not at all occur in grape berries (Stines et al., 2000). They support this hypothesis by studies done on partial root drying and deficit irrigation techniques employed to enhance water usage efficiency by the grapevine. They report that the levels of water stress investigated in these studies were not observed to significantly impact the levels of free proline in the berries (Mccarthy, 1997; Loveys et al., 2000). However, a literature search into this topic has shown that there are indeed studies that found increased proline accumulation due to osmotic stress, induced by water-deficit irrigation techniques (Cramer et al., 2013; Romero et al., 2015).
Therefore, the reasons for proline accumulation remain a controversy. The contradictory findings of these various studies - as well as the cultivar specific levels of proline that are observed in both this survey as well as previous investigations, may indicate that proline accumulation cannot be generalised across all cultivars. Furthermore, proline accumulation may be a more intricate interaction between the genetics of the vine and the particular set of environmental conditions, than what may have previously been thought.
Abundant amino acids
Other than proline and arginine, on average, glutamine (111.57 mg/L), tryptophan (105.67 mg/L), γ-amino butyric acid (GABA, 100.18 mg/L), and alanine (85.17 mg/L) were found to be the most abundant amino acids (Supplementary Tables 1-10). Furthermore, not including proline or arginine, these amino acids were found to be the four most abundant amino acids for each of the cultivars surveyed, appearing in varying orders of abundance. Glutamine was found to be the third most abundant amino acid in Cinsaut, Grenache Blanc, Pinotage, Sauvignon Blanc, Semillon and Viognier. In Cabernet Franc and Roussanne, tryptophan was found to be the third most prevalent, while for Cabernet Sauvignon and Merlot, it was GABA. Finally, alanine was found to be the third most predominant amino acid for Chardonnay and Chenin Blanc juices (Supplementary Figures 3 and 4).
Huang and Ough (1991) also reported glutamine to be one of the most prevalent amino acids. Glutamine is central to amino acid metabolism in the grapevine, as it is the primary form of transportable nitrogen through the phloem and into the berry, and secondly, is the precursor molecule for an array of other amino acids. Therefore, during the early stages of berry development, this amino acid is found to be the most abundant. However, during the later stages of development, there is a marked decline in concentration which is due to the conversion into other amino acids such as glutamate, proline, ornithine, and arginine (Stines et al. , 2000). In the current study, glutamine concentrations were observed to make up on average 6.1% of the amino acid content for the cultivars surveyed (Supplementary Table 3). Furthermore, on average, Merlot was observed to have the lowest glutamine concentrations (61.06 mg/L), and Pinotage the highest (216.37 mg/L) (Supplementary Table 1). Proportionally, Grenache Blanc was found to have the highest glutamine content with an average of 9.9% of the total amino acid concentration being contributing by this amino acid (Supplementary Table 3).
Alanine has also previously been identified as an amino acid occurring in high concentrations, regardless of the cultivar, origin, or vintage (Kliewer, 1970; Huang & Ough, 1991; Spayd & Andersen-Bagge, 1996; Stines et al., 1999). Chenin Blanc and Sauvignon Blanc juices from Washington from 1986 to 1990 had alanine as the third most predominant amino acid after proline and arginine (Spayd & Andersen-Bagge, 1996). Although, in the current study, glutamine was found to be, on average, the third most abundant amino acid in Sauvignon Blanc (103.19 mg/L), alanine still followed closely with an average of 101.88 mg/L (Supplementary Table 3). Furthermore, the current study found Chardonnay to be the highest alanine-containing cultivar, having an average concentration of 145.08 mg/L (Supplementary Table 3, Supplementary Figure 2). Percentage-wise, alanine was found to make up approximately 7% of the total amino acid content of the aforementioned cultivars (Chardonnay: 6.9%; Chenin Blanc: 7.1%; and Sauvignon Blanc: 7.1%) (Supplementary Table 3).
In the current survey, average GABA concentrations were found to range between 69.21 mg/L for Grenache Blanc and 136.60 mg/L for Cinsaut (Supplementary Table 4). The overall average was found to be 100.18 mg/L, making up approximately 5% of the grape juice amino acid content (Supplementary Table 3 and 4). Cabernet Sauvignon, Chardonnay, Cinsaut, Pinotage and Shiraz were all found to have average GABA concentrations of more than 100 mg/L (Supplementary Figure 2 and 3; Supplementary Table 5). GABA is a non-proteinogenic amino acid and therefore, does not play a role in the formation of biomass, but rather in the regulation of plant growth and adaption to various forms of biotic and abiotic stress. Interestingly, a study conducted by Saloua et al. (2014), found elevated levels of GABA in combination with the upregulation of genes associated with the enzyme activities of polyamine oxidases in Meski, a drought resistant species of Vitis vinifera. This correlation points to the link between polyamine homeostasis and GABA formation and the subsequent increased tolerance of the vine towards drought conditions. Specifically, GABA production can occur due to the catabolism of polyamines through the enzymatic action of diamine oxidase (Agudelo-Romero et al., 2013). It is through this catabolic process that grape berry concentrations of GABA (along with arginine) were observed to increase during ripening in a study on the metabolic profiling of the varieties Touriga Nacional, Aragones, and Trincadeira (Ali et al., 2011).
Tryptophan, found as the third most abundant amino acid in Roussanne (214.29 mg/L) and Cabernet Franc (211.11 mg/L) (Supplementary Figure 2 and 3; Supplementary Table 4), is a member of the aromatic amino acid family. This amino acid is particularly important along with the other aromatic (phenylalanine and tyrosine) and branched-chain amino acids (isoleucine, leucine, and valine) in the formation of favourable fruity and floral aromas during fermentation. A study in synthetic media has also shown that all yeast and bacteria tested were able to use tryptophan in the process of accumulation of indole, resulting in a 'plastic-like' aroma in the final product (Arevalo-Villena et al., 2010). However, the importance of tryptophan in the grapevine stems from its role in the production of auxin which is a hormone which plays a pivotal role in berry ripening (Böttcher et al., 2013).
Due to interference of the derivatization agent with tyrosine, this aromatic amino acid could not be accurately quantified and was thus not included in the calculations. Despite this, aromatic amino acids were observed to make up a larger proportion of the total amino content for each cultivar - on average 7.1% of the amino acid content - compared to 3.5% for the branched-chain amino acids (Supplementary Table 2). Proportionally, Cabernet Sauvignon and Merlot had the lowest aromatic amino acid content, with only 4.1% and 4.2%, respectively (Supplementary Table 2). These cultivars were also observed to have amongst the lowest proportions of branched-chain amino acids (Cabernet Sauvignon 2.8% and Merlot 2.6%), along with Chardonnay 2.6%. Moreover, Roussanne was found to have, on average, the highest aromatic amino acid content, in both absolute terms (264 mg/L) and proportionally (13.4%) (Supplementary Table 2).
In terms of the branched-chain amino acids, Cinsaut and Roussanne were found to have the highest proportions - 4.6% and 4.5%, respectively (Supplementary Table 2). Therefore, as Roussanne contains high concentrations of these precursor molecules (both aromatic and branched-chain amino acids), it could be identified as a cultivar with a lot of aromatic potential in terms of the production of fusel alcohols and esters. However, these positive aroma compounds are only produced when the total YAN concentration is capable of fulfilling the full biosynthetic requirement of the yeast. As Roussanne has been identified as a cultivar which has a very low total YAN content (average 132 ± 34 mg N/L) (Petrovic et al., 2019), this cultivar will most likely require nutrient supplementation in the form of DAP or complex nutrients to realise its full aromatic potential. Moreover, the pathways that result in the production of volatile compounds are more complex than previously suggested. It was shown recently that in winemaking conditions the catabolism of consumed amino acids plays a minor role in the formation of volatile compounds, with precursors required for their synthesis mainly originating from central carbon metabolism (Crépin et al., 2017; Rollero et al., 2017).
Least abundant amino acids
Ornithine (2.01 mg/L), glycine (3.28 mg/L), methionine (3.64 mg/L) and lysine (3.91 mg/L) were found to have the lowest concentrations, both in terms of the overall average, as well as per cultivar (Supplementary Table 1 and 4). This is again in agreement with what has been published previously (Huang & Ough, 1991; Spayd & Andersen-Bagge, 1996; Stines et al., 2000). The low concentration of ornithine is most likely due to its central role in nitrogen metabolism, acting as a precursor molecule for the formation of the most abundant amino acids, arginine and proline, as well as its involvement in polyamine synthesis through ornithine decarboxylase. As Saccharomyces cerevisiae, the principal yeast used for fermentation, is not able to efficiently metabolise glycine and lysine, these amino acids are considered as a poor source of nitrogen for this yeast (Garde-Cerdán et al., 2009; Jolly et al., 2017). However, these amino acids may be assimilated by some non-Saccharomyces yeasts (Rollero et al., 2018).
Cysteine, a sulfur-containing amino acid present in grape juice, could not be accurately quantified and is a shortcoming of the analytical method employed in this study. Aside from the very low concentration of this compound in the grape juice matrix (Spayd & Andersen-Bagge, 1996), this is thought to be due to the reactivity of the S-H group together with the interference of the high sugar matrix. Cysteine is particularly important in the context of winemaking as a deficiency in this amino acid, along with other S-containing amino acids may lead to off-flavour production (H2S).
Overall amino acid profile
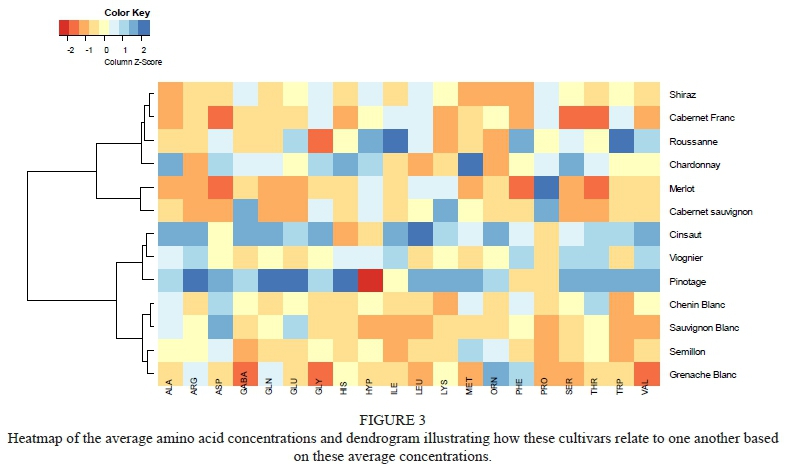
A heatmap of the relative average amino acid concentrations presents the z-score, indicating how much (in terms of standard deviations) the average amino acid concentration per cultivar deviates from the overall average across all cultivars (Figure 3). This method of representing the data provides a comprehensive overview of how the cultivars may compare to one another based on their amino acid content. Furthermore, the associated dendrogram indicates how the cultivars may relate to one another based on their amino acid profiles. Therefore, when looking at the heatmap horizontally, the amino acid profile per cultivar can be observed, whereas vertically, the relative average concentrations can be compared across cultivars for a specific amino acid. Thus, in this representation, the cultivars containing very high or very low concentrations (in comparison to the mean) can be identified. For example, the white cultivars, Grenache Blanc, Sémillon, Sauvignon Blanc, Chenin Blanc, and Viognier appear to group together based on the lower concentrations of amino acids compared to the other cultivars included in this study. Furthermore, it is clear that Merlot is the cultivar with the highest concentration of proline and that Pinotage - and to a lesser degree, Cinsaut - generally has higher concentrations of most of the amino acids compared to the other cultivars surveyed. The close genetic relationship between Pinotage and Cinsaut together with the similarity in the amino acid profile highlights the influence of the genetic make-up in determining the grape must composition.
With good reason, in the past three decades, a great deal of emphasis has been placed on ensuring that the total YAN concentration is adequate to support sufficient biomass production, thereby avoiding stuck fermentations (Bely et al., 1990a; Henschke & Jiranek, 1993; Bisson, 1999). However, more recently, the relevance of the content of the nitrogen sources in relation to one another in determining the overall style and quality of the final wine is emerging. This is due to the complex metabolic activities of the yeast where the ratio of amino acids to another will determine the flux of these nitrogenous compounds into the various metabolic pathways of the yeast, and subsequently, influence the organoleptic qualities produced (Beltran et al., 2004; Gobert et al., 2017; Rollero et al., 2018). Thus, when a grape must is supplemented with nitrogenous compounds, it is not only about increasing the nitrogen content per se, but also about how this increase alters the ratio of amino acids (and ammonia) to another.
Predictive ability of the grape must amino acid profile
The data were also used to evaluate how accurately the amino acid composition could be used to discriminate between cultivars and predict a certain cultivar. This was achieved using General Discriminant Analysis (GDA), a modelling technique involving the application of the general linear model (GLM) algorithm to the discriminant analysis function. The benefits of this include the possibility of a "best-subset" selection criteria. The optimum number of predictors are selected based on leave-one-out cross-validation. The best subset is then subsequently selected based on how many times the predictor appears in the 20 best models. Whether or not the predictor variable is statistically significant was tested by the Wilk's Lambda statistic.
Discrimination between red and white varieties
As a first step, for the discrimination between white and red grape juices, alanine (19), leucine (18), GABA (17), and proline (6) were the amino acids that achieved the best prediction (Supplementary Table 11). Numbers included in brackets are the number of times the amino acid appeared in the best 20 models. The training set included 517 samples (111 red and 406 white), i.e. 70% of the data. Thus, the models were independently validated with the remaining 30% of the data. Overall, the model predicted 82.8% of samples correctly. When looking at the misclassification table, only 66% of the red grape juice samples were correctly predicted, whereas 87% of white samples were correctly predicted (Table 1). However, the decline in the performance of the model in distinguishing between red and white samples is hypothesised to be due to the markedly lower number of red samples included in the study.
Due to the lower number of samples contributed by each of the individual red cultivars compared to the white cultivars, class membership of specific cultivars was predicted in two separate models, one for white and one for red.
Prediction of white cultivars
White cultivars: Best subset
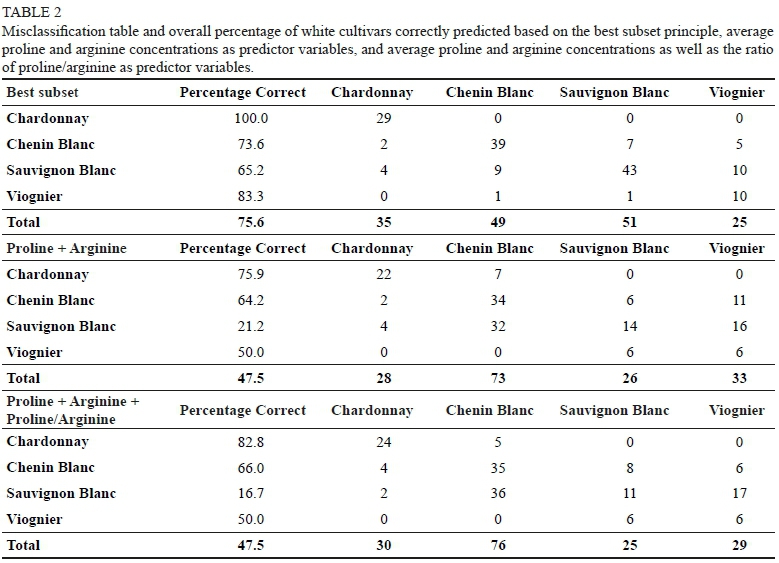
Due to the vast difference in the number of samples of white cultivars, only cultivars with more than 30 samples were included in this discriminatory analysis. Thus, Chardonnay (n=97), Chenin Blanc (n=179), Sauvignon Blanc (n=219) and Viognier (n=40) were considered. Training to test set ratios were again randomly divided into a 70/30 ratio. This meant that of the 532 samples included in the analysis, a test set of 160 samples was used to independently validate the model. Alanine (15) and proline (17) were again included in the best subset, in addition to arginine (20), methionine (20), threonine (18), and glutamic acid (9) (Supplementary Table 11). This model was able to correctly identify 75.6% of the white grape juice samples according to cultivar (Table 2). Furthermore, these results confirm the results observed in the heatmap, where Sauvignon Blanc, Chenin Blanc, and Viognier were found to be more similar to one another than any of these cultivars were to Chardonnay (Figure 3). Specifically, 100% of Chardonnay, 73.6% of Chenin Blanc, 65.2% of Sauvignon Blanc and 83.3% of Viognier samples were correctly predicted (Table 2). Sauvignon Blanc had the lowest prediction accuracy (65.2%) and was mainly misclassified as Viognier (15%) and Chenin Blanc (14%).
White cultivars: Proline and arginine
The use of proline and arginine as the only predictor variables had a markedly lower predictive ability even though these predictors were both found to be statistically significant according to the Wilk's lambda statistic (p < 0.05). The overall predictive ability of the model decreased from 76% (using the best subset) to 47.5% by using only the average concentration of proline and arginine (Table 2). The same trends were observed for this model as with the models based on the best subset, where Chardonnay was found to be the most accurately predicted cultivar (75.9%) and Sauvignon Blanc the most poorly predicted cultivar (21.2%).
When adding the ratio of proline to arginine (proline:arginine) as a predictor variable to this model, the overall performance did not change (47.5%) (Table 2), however, the predictive ability of specific cultivars did vary. Adding this ratio increased the predictive ability of Chardonnay (82.8%), however, it led to a decrease in the prediction accuracy of Sauvignon Blanc (16.7%). The prediction accuracy of Chenin Blanc was marginally improved (66%), whereas Viognier remained unchanged at 50%. Sauvignon Blanc was in both instances (where just the average concentrations of proline and arginine were used as predictor variables as well as in the case of the addition of the proline:arginine ratio), most often misclassified as Chenin Blanc. The misclassification of Sauvignon Blanc as Chenin Blanc may stem from the close genetic relationship exhibited between these cultivars (Myles et al., 2011). Furthermore, the poor prediction of Sauvignon Blanc may also be due to the large number of diverse sample types that were collected.
Therefore, using proline and arginine as the sole predictor variables may offer a small degree of differentiation between certain cultivars such as Chardonnay from Chenin Blanc, Sauvignon Blanc and Viognier, but cannot definitively be used as an indicator to discriminate between cultivars as hypothesised by Huang and Ough (1991).
Prediction of red cultivars
Red cultivars: Best subset
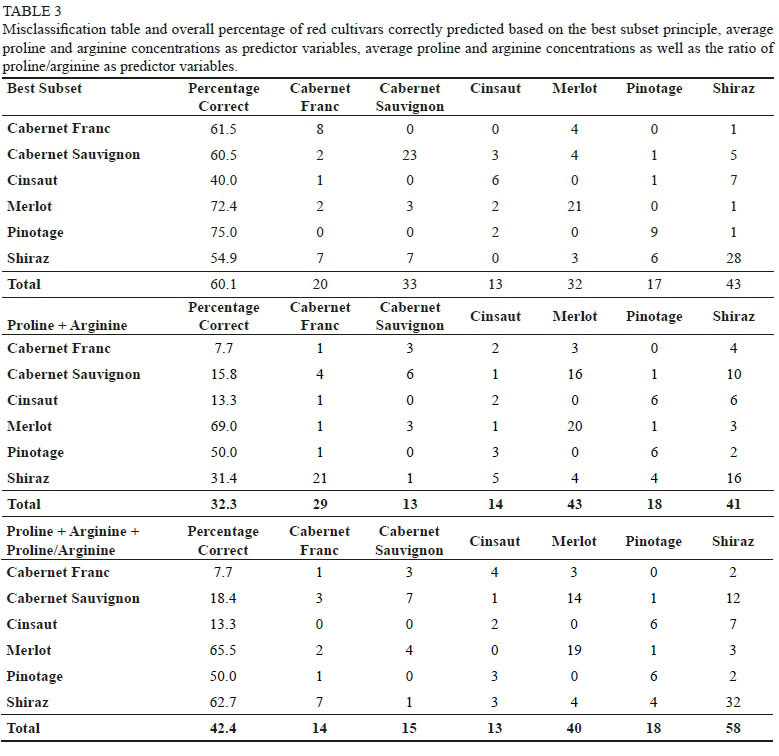
As less samples of red cultivars were collected during the survey, all red cultivars included in the amino acid survey were included in the model. Therefore, the cultivars considered included Cabernet Franc (13), Cabernet Sauvignon (38), Cinsaut (15), Merlot (29), Pinotage (12), and Shiraz (51). Overall, the model correctly predicted 60.1% of the red grape juice samples according to cultivar (Table 3). However, due to the lower number of samples, cross-validation was used instead of an independent test-set to validate the model. Pinotage was most frequently correctly identified (75%), with only 1 sample being misclassified as Shiraz and 2 as Cinsaut. The misclassification of Pinotage as Cinsaut may also stem from their close genetic (parent-offspring) relationship. Furthermore, Cabernet Franc was most frequently misclassified as Merlot, also possibly due to the close genetic (parent-offspring) relationship exhibited between these cultivars. Moreover, even though Shiraz contributed the greatest number of samples to this data set, only 54.9% of the samples were correctly predicted. In addition to this, other cultivars were most often misclassified as Shiraz. Therefore, Shiraz appears to have an amino acid profile which is quite similar to the other cultivars included in the model and thus, not easily distinguishable (Table 3).
Red cultivars: Proline and arginine
Using proline and arginine as the only predictor variables for red cultivars also led to a distinctly lower predictive ability, where the overall model was only able to correctly predict 32.3% of red grape juice samples according to cultivar (Table 3). Cabernet Franc was the most poorly predicted cultivar with only 7.7% of its samples correctly identified. Cabernet Sauvignon and Cinsaut were also very poorly predicted, with only 15.8% and 13.3% of samples correctly identified, respectively. On the other hand, 69% of Merlot samples were correctly predicted and was therefore found to be the cultivar most accurately predicted based on average proline and arginine concentrations (Table 3). This is not surprising, as this cultivar was found to have the most extreme concentrations for both of these amino acids - having the lowest arginine and the highest proline concentrations. Therefore, these two amino acids may be reasonably accurate to distinguish Merlot from other cultivars but may not be a good indicator for any of the other cultivars.
The addition of the ratio of proline to arginine increased the prediction accuracy of the model by approximately 10% to 42.4% (Table 3). Although this model was not as accurate as the same model to predict white cultivars, the addition of the ratio made a bigger impact on the overall prediction accuracy of red cultivars, whereas the overall prediction accuracy of white cultivars remained the unchanged at 47.5%. The increased performance of this model was, however, owed to the improved prediction of Shiraz samples, which increased from 31.4% (using only the average proline and arginine concentrations) to 62.7% (with the addition of the proline:arginine ratio). Interestingly, this model allowed for better prediction of Shiraz samples than the model using the best subset principal (54.9%) (Table 3). Furthermore, the prediction of Cabernet Franc, Cinsaut and Pinotage remained unchanged with the addition of the proline/arginine ratio as a predictor variable. However, the prediction accuracy of Merlot was observed to drop by 3.5% from 69% to 65.5% (Table 3).
Therefore, using proline and arginine concentrations as the sole predictor variables, as well as the addition of the ratio of these amino acids also yielded unsatisfactory results to distinguish red cultivars from one another.
CONCLUSION
The nitrogen content of the grape berry is essential for the proper development and functioning of the grapevine -whether it be an adaptive mechanism to stress (such as in the case of proline and GABA) or whether it be involved in central nitrogen metabolism and berry ripening (as in the case with glutamine and tryptophan, respectively). However, when the grapes are harvested, the nitrogen content - specifically the yeast assimilable nitrogen portion - becomes important in the context of yeast metabolism and subsequently, the fermentation process.
Therefore, the current study aimed to provide a strong foundation for nitrogen research in the context of the wine industry. This was done by providing not only the absolute values but also the proportions of various amino acids for a range of industrially relevant cultivars as this will help to provide a more comprehensive picture of the potential of the grape must in terms of both fermentation efficiency and aroma. After proline and arginine, glutamine, tryptophan, GABA and alanine were found to be the most abundant amino acids. Ornithine, glycine, methionine and lysine were found to have the lowest overall concentrations, both on average as well as per cultivar. Merlot and Cabernet Sauvignon were found to have the lowest proportions of aromatic and branched-chain amino acids, with Roussanne being found to have the highest proportion of these compounds.
Therefore, as Cabernet Sauvignon and Merlot have been found to have very low total YAN concentrations, these cultivars would in most cases require nitrogen supplementation to ensure the completion of fermentation. However, the addition of complex nutrients (which may contain varying concentrations of these branched-chain and aromatic amino acids) may be a more beneficial supplementation strategy for these cultivars compared to ammonia addition (in the form of diammonium phosphate). On the other hand, as Roussanne already has high concentrations of these precursor molecules, the addition of (cheaper) ammonium may be sufficient to ensure not only the completion of fermentation but to ensure the formation of favourable organoleptic qualities in the final wine.
In addition to this, it was investigated how characteristic the amino acid profile is of a particular group (red or white) or of a particular cultivar. This was done by examining how accurately cultivars could be predicted based on their average amino acid concentrations using general discriminant analysis (GDA) and the best subset principal. Based on this, Chardonnay showed the highest prediction accuracy with 100% of its samples correctly identified with regard to the white cultivars, and Pinotage (75%) with regard to the red cultivars. Overall, the white cultivars included in this study were more accurately distinguished from one another (75.6%) compared to the red (60.1%). This predictive ability was subsequently compared to the accuracy of predicting cultivars based on only their arginine and proline concentrations as well as the ratio between the two, based on the findings by Huang and Ough (1991), who eluded to the potential of these amino acids to distinguish between cultivars. The use of only these amino acids as well as the addition of the proline:arginine ratio as a predictor variable did not offer satisfactory discriminatory power between either white or red cultivars.
However, still the discrimination between white cultivars was found to be more accurate for the models including the use of only proline and arginine, as well as the addition of proline:arginine as predictor a variable, than it was between red cultivars. This is hypothesised to be because of the closer genetic relationships between the group of red cultivars included in this study than between the white cultivars (Myles et al., 2011).
Therefore, general discriminant analysis using the best subset principal was able to provide reasonable predictive power and thus, there is merit in using amino acid profiles to distinguish between cultivars. However, prediction accuracy seemed to depend on, to a certain degree, how related cultivars were to one another.
To our knowledge, this was the first study to use the amino acid profile of such a large number of grape juice samples to discriminate between various cultivars. The possibility of this has only been suggested by previous authors, especially for the prediction of white cultivars. Furthermore, this study tested the hypothesis of Huang and Ough (1991), who theorised that the proline and arginine concentrations as well as the ratio (proline:arginine) can be used as an indicator of cultivar.
LITERATURE CITED
Agudelo-Romero, P., Bortolloti, C., Pais, M.S., Tiburcio, A.F., Fortes, A.M., 2013. Study of polyamines during grape ripening indicate an important role of polyamine catabolism. Plant Physiol. Biochem. 67, 105-119. [ Links ]
Ali, K., Maltese, F., Fortes, A.M., Pais, M.S., Choi, Y.H., 2011. Monitoring biochemical changes during grape berry development in Portuguese cultivars by NMR spectroscopy. Food Chem. 124(4), 1760-1769. [ Links ]
APNT134965704, 2018. Amino Acid Analysis - Application Notebook, Waters Inc. [ Links ]
Arevalo-Villena, M., Bartowsky, E.J., Capone, D. & Sefton, M.A., 2010. Production of indole by wine-associated microorganisms under oenological conditions. Food Microbiol. 27(5), 685-90. [ Links ]
Ashraf, M. & Foolad, M.R., 2007. Roles of glycine betaine and proline in improving plant abiotic stress resistance. Environ. Exper. Bot. 59(2), 206216. [ Links ]
Bell, S.-J. & Henschke, P.A., 2005. Implications of nitrogen nutrition for grapes, fermentation and wine. Aust. J. Grape Wine Res. 11(3), 242-295. [ Links ]
Beltran, G., Novo, M., Rozès, N., Mas, A., Guillamón, J.M., 2004. Nitrogen catabolite repression in Saccharomyces cerevisiae during wine fermentations. FEMS Yeast Res 4(6), 625-632. [ Links ]
Bely, M., Sablayrolles, J.M. & Barre, P., 1990a. Automatic detection of assimilable nitrogen deficiencies during alcoholic fermentation in oenological conditions. J. Ferm. Bioeng. 70(4), 246-52. [ Links ]
Bely, M., Sablayrolles, J.M. & Barre, P., 1990b. Description of alcoholic fermentation kinetics : Its variability and significance. Am. J. Enol. Vitic. 41(4), 319-24. [ Links ]
Bisson, L.F., 1999. Stuck and Sluggish Fermentations. Am. J. Enol. Vitic. 50(1), 107-119. [ Links ]
Böttcher, C., Burbidge, C.A., Boss, P.K., Davies, C., 2013. Interactions between ethylene and auxin are crucial to the control of grape (Vitis vinifera L.) berry ripening. BMC Plant Biol. 13(222), 1-14. [ Links ]
Boulton, R.B., Singleton, V.L., Bisson, L.F., Kunkee, R.E., 1999. Principles and Practices of Winemaking. Springer, US. [ Links ]
Butzke, C.E., 1998. Survey of Yeast Assimilable Nitrogen Status in Musts from California, Oregon, and Washington. Am. J. Enol. Vitic. 49(2), 220224. [ Links ]
Camara, J., Alves, Μ. & Marques, J., 2006. Multivariate analysis for the classification and differentiation of Madeira wines according to main grape varieties. Talanta. 68(5), 1512-21. [ Links ]
Carrau, F.M., Medina, K., Boido, E., Farina, L., Gaggero, C., Dellacassa, E., Versini, G., Henschke, P.A., 2005. De novo synthesis of monoterpenes by Saccharomyces cerevisiae wine yeasts. FEMS Microbiol. Lett. 243(1), 107-115. [ Links ]
Cooper, T.G., 1982. Nitrogen Metabolism in Saccharomyces cerevisiae. In: Strathern, J.N., Jones, E.W., Broach, J.R. (Eds.). The Molecular Biology of the Yeast Saccharomyces: Metabolism and Gene Expression. Cold Spring Harbor Laboratory Press, Cold Spring Harbor, NY. pp. 39-99. [ Links ]
Cramer, G.R., Van Sluyter, S.C., Hopper, D.W., Pascovici, D., Keighley, T., Haynes, P.A., 2013. Proteomic analysis indicates massive changes in metabolism prior to the inhibition of growth and photosynthesis of grapevine (Vitis vinifera L.) in response to water deficit. BMC Plant Biol. 13(49), 1-22. [ Links ]
Crépin, L., Truong, N.M., Bloem, A., Sanchez, I., Dequin, S. & Camarasa, C., 2017. Management of Multiple Nitrogen Sources during Wine Fermentation by Saccharomyces cerevisiae. Appl. Environ. Microbiol. 83(5), 1-21. [ Links ]
Garde-Cerdán, T., Lorenzo, C., Lara, J.F., Pardo, F., Ancín-Azpilicueta, C., Salinas, M.R., 2009. Study of the Evolution of Nitrogen Compounds during Grape Ripening. Application to Differentiate Grape Varieties and Cultivated Systems. J. Agric. Food Chem. 57(6), 2410-2419. [ Links ]
Geana, E. I., Popescu, R., Costinel, D., Dinca, O. R., Ionete, R. E., Stefanescu, I., Artem, V. & Bala, C. 2016. Classification of red wines using suitable markers coupled with multivariate statistic analysis. Food Chem. 192, 1015-1024. [ Links ]
Gobbi, M., Comitini, F., D'Ignazi, G., Ciani, M., 2013. Effects of nutrient supplementation on fermentation kinetics, H2S evolution, and aroma profile in Verdicchio DOC wine production. Eur. Food Res. Technol. 236(1), 145154. [ Links ]
Gobert, A., Tourdot-Maréchal, R., Morge, C., Sparrow, C., Liu, Y., Quintanilla-Casas, B., Vichi, S., Alexandre, H., 2017. Non-Saccharomyces Yeasts Nitrogen Source Preferences: Impact on Sequential Fermentation and Wine Volatile Compounds Profile. Front. Microbiol. 8, 1-13. [ Links ]
Guo, X.-W., Li, Y.-Z., Guo, J., Wang, Q., Huang, S.-Y., Chen, Y.-F., Du, L.-P., Xiao, D.-G., 2016. Reduced production of ethyl carbamate for wine fermentation by deleting CAR1 in Saccharomyces cerevisiae. J. Ind. Microbiol. Biotechnol. 43(5), 671-679. [ Links ]
Hagen, K.M., Keller, M., Edwards, C.G., 2008. Survey of Biotin, Pantothenic acid, and Assimilable Nitrogen in Winegrapes from the Pacific Northwest. Am. J. Enol. Vitic. 59(4), 432-436. [ Links ]
Hannam, K.D., Neilsen, G.H., Neilsen, D., Midwood, A.J., Millard, P., Zhang, Z., Thornton, B., Steinke, D., 2016. Amino Acid Composition of Grape (Vitis vinifera L.) Juice in Response to Applications of Urea to the Soil or Foliage. Am. J. Enol. Vitic. 67(1), 47-55. [ Links ]
Henschke, P.A. & Jiranek, V., 1993. Yeasts-metabolism of nitrogen compounds in Wine Microbiology and Biotechnology. Harwood Academic Publishers, Amsterdam. pp 77-164. [ Links ]
Hernández-Orte, P., Cacho, J.F., Ferreira, V., 2002. Relationship between Varietal Amino Acid Profile of Grapes and Wine Aromatic Composition. Experiments with Model Solutions and Chemometric Study. J. Agric. Food Chem. 50(10), 2891-2899. [ Links ]
Huang, Z. & Ough, C.S., 1991. Amino Acid Profiles of Commercial Grape Juices and Wines. Am. J. Enol. Vitic. 42(3), 261-267. [ Links ]
Jolly, N.P., Augustyn, O.P.H., Pretorius, I.S., 2017. The Role and Use of Non-Saccharomyces Yeasts in Wine Production. S. Afr. J. Enol. Vitic. 27(1), 15-39. [ Links ]
Kliewer, W.M., 1969. Free Amino Acids and Other Nitrogenous Substances of Table Grape Varieties. J. Food Sci. 34(3), 274-278. [ Links ]
Kliewer, W.M., 1970. Free Amino Acids and Other Nitrogenous Fractions in Wine Grapes. J. Food Sci. 35(1), 17-21. [ Links ]
Landete, J.M., Ferrer, S., Pardo, I., 2007. Biogenic amine production by lactic acid bacteria, acetic bacteria and yeast isolated from wine. Food Control 18(12), 1569-1574. [ Links ]
Liu, L., Cozzolino, D., Cynkar, W.U., Gishen, M. & Colby, C.B., 2006. Geographic classification of Spanish and Australian tempranillo red wines by visible and near-infrared spectroscopy combined with multivariate Analysis. J. Agric. Food Chem. 54(18), 6754-9. [ Links ]
Loveys, B.R., Dry, P.R., Stoll, M., Mc Carthy, M.G., 2000. Using Plant Physiology to Improve the Water Use Efficiency of Horticultural Crops. Acta Hortic. 537, 187-197. [ Links ]
Majumdar, R., Minocha, R., Minocha, S.C., 2015. Ornithine: at the crossroads of multiple paths to amino acids and polyamines. In: J.P.F. D'Mello (ed). Amino acids in higher plants. CABI, Wallingford. pp 156176. [ Links ]
Mccarthy, M.G., 1997. The effect of transient water deficit on berry development of cv. Shiraz (Vitis vinifera L.). Aust. J. Grape Wine Res. 3(3), 2-8. [ Links ]
Myles, S., Boyko, A.R., Owens, C.L., Brown, P.J., Grassi, F., Aradhya, M.K., Prins, B., Reynolds, A., Chia, J.-M., Ware, D., Bustamante, C.D., Buckler, E.S., 2011. Genetic structure and domestication history of the grape. PNAS 108(9), 3530-3535. [ Links ]
Nicolini, G., Larcher, R., Versini, G., 2004. Status of yeast assimilable nitrogen in Italian grape musts and effects of variety, ripening and vintage. Vitis 43(2), 89-96. [ Links ]
Ough, C.S. & Bell, A.A., 1980. Effects of Nitrogen Fertilization of Grapevines on Amino Acid Metabolism and Higher-Alcohol Formation during Grape Juice Fermentation. Am. J. Enol. Vitic. 31(2), 122-123. [ Links ]
Ough, C.S., Crowell, E.A., Gutlove, B.R., 1988. Carbamyl Compound Reactions with Ethanol. Am. J. Enol. Vitic. 39(3), 239-242. [ Links ]
Ough, C.S., Crowell, E.A., Mooney, L.A., 1988. Formation of Ethyl Carbamate Precursors During Grape Juice (Chardonnay) Fermentation. I. Addition of Amino Acids, Urea, and Ammonia: Effects of Fortification on Intracellular and Extracellular Precursors. Am. J. Enol. Vitic. 39(3), 243249. [ Links ]
Ough, C.S., Huang, Z., Mooney, L.A., 1991. Amino Acid Uptake by Four Commercial Yeasts at Two Different Temperatures of Growth and Fermentation: Effects on Urea Excretion and Reabsorption. Am. J. Enol. Vitic. 42(1), 26-40. [ Links ]
Petrovic, G., Kidd, M., Buica, A., 2019. A statistical exploration of data to identify the role of cultivar and origin in the concentration and composition of yeast assimilable nitrogen. Food Chem. 276, 528-537. [ Links ]
Rapp, A. & Versini, G., 1991. Influence of nitrogen compounds in grapes on aroma compounds of wines. Developments in Food Science 37, Elsevier, Amsterdam. pp 1659-1694. [ Links ]
Rollero, S., Mouret, J.R., Bloem, A., Sanchez, I., Ortiz-Julien, A., Sablayrolles, J.M., Dequin, S. & Camarasa, C., 2017. Quantitative 13C-isotope labelling-based analysis to elucidate the influence of environmental parameters on the production of fermentative aromas during wine fermentation. Microb. Biotechnol. 10(6), 1649-62. [ Links ]
Rollero, S., Bloem, A., Ortiz-Julien, A., Camarasa, C., Divol, B., 2018. Fermentation performances and aroma production of non-conventional wine yeasts are influenced by nitrogen preferences. FEMS Yeast Res. 18(5), 1-11. [ Links ]
Romero, P., Munoz, R.G., Fernández-Fernández, J.I., del Amor, F.M., Martínez-Cutillas, A., García-García, J., 2015. Improvement of yield and grape and wine composition in field-grown Monastrell grapevines by partial root zone irrigation, in comparison with regulated deficit irrigation. Agric. Water Manage. 149, 55-73. [ Links ]
Saloua, H., Charlotte, G., Trotel-Aziz, P., Sandra, V., Rabenoelina, F., fabienne, B., Philippe, E., Clement, C., Ferchichi, A., Aziz, A., 2014. Drought stress tolerance in grapevine involves activation of polyamine oxidation contributing to improved immune response and low susceptibility to Botrytis cinerea. J. Exp. Bot. 66, 1-13. [ Links ]
Serrano-Lourido, D., Saurina, J., Hernández-Cassou, S. & Checa, A., 2012. Classification and characterisation of Spanish red wines according to their appellation of origin based on chromatographic profiles and chemometric data analysis. Food Chem. 135(3), 1425-31. [ Links ]
Smit, A.Y., 2013. The impact of nutrients on aroma and flavour production during wine fermentation. PhD Thesis, Stellenbosch University, Private Bag X1, 7602 Matieland (Stellenbosch), South Africa. [ Links ]
Smit, A.Y., Engelbrecht, L., du Toit, M., 2012. Managing Your Wine Fermentation to Reduce the Risk of Biogenic Amine Formation. Front. Microbiol. 3, 1-10. [ Links ]
Soufleros, E.H., Bouloumpasi, E., Tsarchopoulos, C. & Biliaderis, C.G., 2003. Primary amino acid profiles of Greek white wines and their use in classification according to variety, origin and vintage. Food Chem. 80(2), 261-73. [ Links ]
Spayd, S.E. & Andersen-Bagge, J., 1996. Free Amino Acid Composition of Grape Juice From 12 Vitis vinifera Cultivars in Washington. Am. J. Enol. Vitic. 47(4), 389-402. [ Links ]
Stines, A.P., Naylor, D.J., H0j, P.B., van Heeswijck, R., 1999. Proline Accumulation in Developing Grapevine Fruit Occurs Independently of Changes in the Levels of A1-Pyrroline-5-Carboxylate Synthetase mRNA or Protein. Plant Physiol. 120(3), 923-931. [ Links ]
Stines, A.P., Grubb, J., Gockowiak, H., Henschke, P.A., H0J, P.B., Heeswijck, R., 2000. Proline and arginine accumulation in developing berries of Vitis vinifera L. in Australian vineyards: Influence of vine cultivar, berry maturity and tissue type. Aust. J. Grape Wine Res. 6(2), 150-158. [ Links ]
Styger, G., Prior, B. & Bauer, F.F., 2011. Wine flavor and aroma. J. Ind. Microbiol. Biotechnol. 38(9), 1145-59. [ Links ]
Swiegers, J.H. & Pretorius, I.S., 2007. Modulation of volatile sulfur compounds by wine yeast. Appl. Microbiol. Biotechnol. 74(5), 954-960. [ Links ]
Torrea, D., 2003. Production of volatile compounds in the fermentation of chardonnay musts inoculated with two strains of Saccharomyces cerevisiae with different nitrogen demands. Food Control 14(8), 565-571. [ Links ]
Ugliano, M., Henschke, P.A., Herderich, M.J., Pretorius, I.S., 2007. Nitrogen management is critical for wine flavour and style. Australian & New Zealand Wine Industry Journal 22(6), 24-30. [ Links ]
Vilanova, M., Ugliano, M., Varela, C., Siebert, T., Pretorius, I.S., Henschke, P.A., 2007. Assimilable nitrogen utilisation and production of volatile and non-volatile compounds in chemically defined medium by Saccharomyces cerevisiae wine yeasts. Appl. Microbiol. Biotechnol. 77(1), 145-157. [ Links ]
De Villiers, A., Majek, P., Lynen, F., Crouch, A., Lauer, H. & Sandra, P., 2005. Classification of South African red and white wines according to grape variety based on the non-coloured phenolic content. Eur. Food Res. Technol. 221(3-4), 520-8. [ Links ]
Wang, S.S. & Brandriss, M.C., 1987. Proline utilization in Saccharomyces cerevisiae: sequence, regulation, and mitochondrial localization of the PUT1 gene product. Mol. Cell. Biol. 7(12), 4431-4440. [ Links ]
Submitted for publication: February 2019
Accepted for publication: March 2019
* Corresponding author: E-mail address: abuica@sun.ac.za
Acknowledgements:

