


Services on Demand
Article
 English (pdf)
 Article in xml format
 Article references
Indicators

Related links
-
 Cited by Google
 -
 Similars in Google
Share

 Permalink
South African Journal of Enology and Viticulture
On-line version ISSN 2224-7904
Print version ISSN 0253-939X
S. Afr. J. Enol. Vitic. vol.39 n.2 Stellenbosch 2018
http://dx.doi.org/10.21548/39-2-3203
ORIGINAL RESEARCH ARTICLES
Sorting in Combination with Quality Scoring: A Tool for Industry Professionals to Identify Drivers of Wine Quality Rapidly
J. BrandI, II, *; M. KiddIII; L. van AntwerpenIV; D. ValentinV; T. NaesVI; H.H. NieuwoudtII
IDepartment of Viticulture and Oenology, Stellenbosch University, Private Bag X1, Matieland (Stellenbosch) 7602, South Africa
IIInstitute for Wine Biotechnology, Department of Viticulture and Oenology, Stellenbosch University, Private Bag X1, Matieland (Stellenbosch) 7602, South Africa
IIICentre for Statistical Consultation, Department of Statistics and Actuarial Sciences, Stellenbosch University, Private Bag X1, Matieland (Stellenbosch) 7602, South Africa
IVGraham Beck Winery, R60, Robertson, 6705, South Africa
VCentre des Sciences du Goût et de l'Alimentation, AgroSup Dijon, CNRS, INRA, University of Bourgogne, Franche-Comté, F-2100, Dijon, France
VINofima AS, Raw Material and Process Optimisation, Oslovegen 1, P.O. Box 210, N-1431, As, Norway
ABSTRACT
Quality plays an important role in the criteria directing wine product development. The evaluation of sensory characteristics associated with wine quality, as perceived by industry professionals, is therefore important. We investigated the suitability of the free-sorting sensory evaluation method, in combination with wine quality scoring using a 20-point scoring system, to determine the drivers of quality. Eight commercial South African Sauvignon Blanc wines were assessed by a panel of 24 wine industry professionals. Free sorting with a verbalisation step to describe the groups, followed by quality scoring using score sheets routinely used in the wine industry, was performed. A multivariate sensory map was constructed using DISTATIS to explain the similarities and differences amongst the set of wines. Correspondence analysis (CA) was applied to the group descriptors, and CA deviates were calculated. Pearson's correlation coefficients between CA deviates and the quality scores were calculated to identify the drivers of quality. Significant differences in quality were observed between the wines. The sensory attributes "passion fruit", "green pepper", "peas", "asparagus" and "green" were frequently cited by the panel for the wines that received the highest average quality scores, and these attributes were identified as drivers of quality. In this study, a procedure is presented that combines sorting and quality scoring to investigate the relationship between sensory attributes and quality scores to identify the drivers of wine quality. Industry professionals and research environments can use this procedure to determine drivers of wine quality in a single evaluation session.
Key words: Rapid sensory analysis, sorting, quality scoring, drivers of quality, DISTATIS, Sauvignon Blanc wine, industry professionals
INTRODUCTION
Sensory characteristics are important intrinsic factors that influence the perceived quality of wine and play a crucial role in product development. During the blending process of wine production, for example, the sensory drivers of quality can be decisive factors guiding the process. Identifying the consumer target market and target price for a product depends largely on intrinsic characteristics such as colour, taste, mouthfeel, odour, aroma and flavour which contribute to the sensory dimension of the quality. As a result, industry experts, such as winemakers and brand managers, routinely conduct evaluations of wine quality, an activity that is especially important for high-quality wines. During these evaluations wines are typically rated for quality only and description are rarely provided. Occasionally, during informal tasting group social or training events, words or phrases describing the sensory characteristics are provided additionally. Several studies have been conducted to better understand the dimensions of wine quality and improve the methods used. The aim is to evaluate the effectiveness of the methods used by the wine industry and to propose new strategies to measure wine quality (Botonaki & Tsakiridou, 2004; Verdú Jover et al., 2004; Parr et al., 2006; Charters & Pettigrew, 2007; Torri et al., 2013; Sáenz-Navajas et al., 2015, 2016; Valentin et al., 2016). It is clear that wine quality assessment requires extensive attention and optimisation.
Quality assessment of wine
Quality is an abstract concept that is difficult to define (Ziethalm et al., 1988). Various methods have been proposed and tested in the last 10 to 15 years to measure wine quality. The majority of these methods focused on the perception of quality by the consumer. A few examples are papers by Botonaki and Tsakiridou (2004) and Charters and Pettigrew (2007).
Botonaki and Tsakiridou (2004) used self-administered questionnaires to obtain insights into Greek consumers' attitudes towards quality attributes by taking their general knowledge of the Greek quality certification system and "destination of origin" into account. Consumers' willingness to pay more for quality certified wines was also investigated. Verdú Jover et al. (2004) proposed and validated a 21-point scale to measure the dimensions of wine quality by proposing two different scales for intrinsic and extrinsic quality measurements. It was concluded that the methods were suitable to evaluate wine quality using both novice consumers and connoisseurs (expert consumers). Charters and Pettigrew (2007) used qualitative data obtained from questionnaires and focus groups to understand the complexity and dimensions of the quality perception of Australian consumers based on their level of involvement with the product. From these studies, it became clear that consumers' quality perception is a multi-dimensional concept and is a crucial measurement, since the translation of consumer demands into product specification leads to the development of products accepted by the consumers (Bredahl et al., 1998; Verdú Jover et al., 2004).
Measuring quality as perceived by consumers is not always possible, due to logistical matters such as cost implications and the phase of production when the quality measure is needed, for example during product development. In such cases, experts' opinions of product quality can be used as a first measure. Few studies have investigated the perception of quality by wine industry experts. Parr et al. (2006) compared a 20-point scale to a 100-point scale. Both scales are routinely used in the industry for judging at wine competitions. No significant differences were found in the data obtained from the two scales concerning product variation or judge variability. Lattey et al. (2009) used a 20-point scale to capture the quality perceptions of Australian winemakers and compared these to consumers' acceptance of the wines. It was shown that the winemakers and consumers used different criteria when evaluating quality. Interestingly, wines that obtained higher average consumer liking scores also obtained higher average quality scores from the experts. Sáenz-Navajas et al. (2013) came to a similar conclusion when the effect of consumers' culture and their levels of expertise on the sensory drivers of the quality of red wines were investigated. These authors concluded that experts and consumers do not rate quality the same, and reported that the quality rating was dependent on the level of expertise of the judge.
Torri et al. (2013) adapted the nine-point hedonic liking scale and proposed a quality scale ranging from "very poor quality" to "excellent quality" to assess wine quality using experts (oenologists and wine producers) as sensory judges. The experts' quality measurements were compared to the consumers' liking of the products. Both groups' abilities to differentiate between wines using a rapid sensory profiling method, projective mapping (Napping), were tested. The results showed that consensus amongst the consumers was low regarding perceived differences and similarities between wines and was driven by liking. The authors postulated that experts use a common language to describe samples based on their previous experiences of high-quality products and thus differentiate between products based on quality.
Sáenz-Navajas et al. (2016) used an unstructured line scale to assess the effect of tasting conditions referred to global perception of all modalities simultaneously versus isolating the modalities. The three modalities, namely visual, orthonasal (odour) and in-mouth perception (flavour, taste and mouthfeel) were evaluated separately. Quality perception was found to be dependent on the evaluation conditions. It was concluded that the global quality rating was based on the perceived quality during tasting as well as cognitive information obtained during technical training of the winemaking process, rather than the sum of the in-mouth, odour and visual perception of the sample. For example, white wine with a yellow colour was believed to be of lower quality than white wine with a green tint due to the cognitive information namely the technical knowledge that winemakers have of the production process rather than the perception of the wine during tasting. Lastly, it was concluded that the olfactory properties (the "nose") of the wines had a stronger and more important influence on the overall global quality than the visual and in-mouth perceptions.
In another study the relationship between wine quality and colour in Pinot Noir wine was investigated (Valentin et al., 2016). These authors used a 10-point scale anchored at "poor" and "good" to assess overall wine quality. In addition, sensory attributes describing the "nose", the "palate" (including "balance" and "structure") and "typicality" were measured in the same session after the quality rating. During the final assessment the colour of the wines were evaluated by rating "colour/hue", "colour intensity" and "brightness", to relate wine quality to colour. It was found that wine colour was not a major contributor towards Pinot Noir wine quality, while the perceived "balance" and "structure" of the wines were important. The perceived "balance" and "structure" were correlated with chemical parameters such as pH, ethanol, sugar content, astringency and acidity. Presenting wines in clear glasses as opposed to black glasses lead to higher quality scores.
From literature, it is clear that wine quality is a complex and abstract concept. It has many dimensions and can be approached from different angles, for example from a consumer viewpoint or an industry professional perspective. The methods used previously in research to measure quality were selected based on the specific research question asked and the aspects of quality measured. When measuring quality, a complex and abstract concept, it is essential to choose a method that is fit-for-purpose. It is rarely necessary or practical to evaluate all the dimensions of quality and from both the perspectives of the consumers and industry professionals. Testing the quality perception from a consumer viewpoint can be used to direct product development and supplement the development of a marketing strategy knowing what the target consumer want. Where an expert's initial quality assessment during product development, from a production perspective, can be useful as, for example, a benchmarking tool. In this study the sensory dimension of quality as perceived by industry professionals was studied. Considering the methodologies discussed in literature, the 20-point scale was chosen for this study for two reasons. (1) This method is familiar to the South-African wine industry professional and (2) no proof could be found that other methodologies will provide better results, e.g. Parr et al. (2006) found no significant differences between results when using the 20-point and 100-point scales.
It is, however of interest for wine industry professionals to, in addition to quality scoring, describe the sensory characteristics of the evaluated samples due to the fact that quality is based partially on those characteristics.
Rapid sensory profiling methods for alcoholic beverages
In addition to quality assessment, industry professionals can describe the intrinsic sensory properties of wine products, due to constant practice gained from frequent participation in informal and formal wine tasting events, as a result of their work experience. During informal tastings winemakers, discuss wines amongst themselves providing a few words to describe each wine, not following a specific sensory method or applying statistical data analysis to their descriptions. When guided during sensory evaluation sessions industry professional can describe wines using formal sensory analysis methods, for example rapid methods such as sorting. Since the late 1990's and early 2000's, several rapid sensory profiling methods were proposed, as recently reviewed (Valentin et al., 2012; Varela & Ares, 2012). A number ofthese methods were tested, adapted and developed specifically for profiling of wine and alcoholic beverages using industry experts as sensory judges. These methods include check-all-that-apply (CATA) and it's variants "pick-k attributes" (McCloskey et al., 1996; Chollet & Valentin, 2000); pivot profile© (PP) proposed by Thuillier et al. (2015); projective mapping (PM) including Napping® (Pages, 2003, 2005; Perrin et al., 2008; Perrin & Pages, 2009; Torri et al., 2013) and sorting (Piombino et al., 2004; Ballester et al., 2005; Ballester et al., 2008; Lelièvre et al., 2008, 2009; Bécue-Bertaut & Lê, 2011; Parr et al., 2015; Honoré-Chedozeau et al. 2017).
CATA is referred to as a verbal-based method (Valentin et al., 2012) and sensory judges select terms from a predetermined list to describe the test samples. CATA variants were successfully used to discriminate between wine samples (Chollet & Valentin, 2000). However, the number of terms on the lists must be carefully considered to prevent the list from being too long and tedious to use, or too short thereby excluding terms crucial to represent the sensory judges' perception of the products accurately. During CATA, samples are presented to the judges in a monadic way, i.e., one at a time. Obtaining a global, intuitive picture in one's mind of how the samples relate to each other is, however, difficult and for most judges impossible.
Another method, PP (proposed by Thuillier et al. 2015) was used to profile wine using industry experts as sensory judges. Wine samples are evaluated in pairs, one test sample and one reference called the pivot sample. Each wine is compared to the same pivot, thereby allowing for interpretation of differences between samples relative to a common reference. The main drawback of this methods is the choice of the pivot. Nevertheless, Lelièvre-Desmas et al. (2017) stated that: "the choice of the pivot has less influence than the within-set similarity between samples". This method, however, requires verbal expression of sensory perceptions, which can be difficult and is not an intuitive task.
Projective mapping (PM) techniques rely on the ability of the sensory judges to identify similarities and differences between samples in an intuitive manner prior to naming the sensory attributes (Pages, 2003, 2005; Perrin et al., 2008; Perrin &Pagès 2009; Torri et el., 2013). This is an easier task than verbalising sensory attributes as the first step which is the case for CATA and PP. The first step of a PM requires sensory judges to place samples on a surface, often an A2 or A3 sheet, in such a way that similar samples are placed close to each other and different samples far apart. During the second step, the sensory properties of each sample are described by assigning a few sensory words next to each sample to explain its position on the sheet.
The free sorting sensory method is based on the psychological theory that human beings routinely organise their environments intuitively and as part of daily life, by categorising objects according to similarity and dissimilarity (Neisser, 1987; Rosch, 1973). During the free sorting task, sensory judges receive all the samples simultaneously. They are asked to group similar products together and organise the groups in such a way that dissimilar samples appear in separate groups. They are allowed to create as many groups as they see fit to explain the similarities and dissimilarities of the samples presented to them. In order to obtain more information about the odour, aroma, taste and mouthfeel attributes responsible for the groupings, a verbalisation step is included and performed after sorting of the samples. Typically, judges are asked to write down the three to five attributes that best describe each group of wines in the verbalisation step (Faye et al., 2004; Chollet et al., 2011).
Research has shown that product descriptions using rapid methods generated results comparable to DA results (Valentin et al., 2012; Varela & Ares, 2012). Rapid methods are therefore suitable for the profiling purposes. Cartier et al. (2006) showed that sorting rendered similar results to descriptive analysis (DA) in a study where consumers were used as sensory judges. Industry experts are frequently used to perform sorting tasks as well. It is interesting to note that Ballester et al. (2008) reported that consumers and experts did not sort wines precisely the same. Experts distinguished between different cultivars better than consumers did by sorting the wines clearly into separate groups, suggesting that sorting performed by experts could provide results even more similar to DA than sorting performed by consumers.
Sorting is seen as an intuitive, rapid sensory analysis method, and it is faster to perform than DA and other techniques that involve panel training. It is, therefore, more cost-effective and time efficient. Sorting has been applied successfully to investigate the sensory characteristics of wine to investigate product similarities and differences. A number of studies have successfully used sorting to profile wines using industry professionals as sensory judges (Piombino et al., 2004; Ballester et al., 2005; Abdi et al., 2007; Parr et al., 2007; Campo et al., 2008; Bécue-Bertaut & Lê, 2011; Valentin et al., 2012; Varela & Ares, 2012).
Sorting was therefore the chosen method to describe the sensory characteristics of wine in combination with quality scoring to determine drivers of quality. The aim of this study was to develop a "ready-to-use" procedure for industry professionals to explore the sensory dimensions of quality, since quality is partially based on sensory characteristics. The proposed methodology consists of a descriptive step, sorting and a quality scoring step conducted during a single sensory evaluation session. The 20-point scoring method with which the industry professionals were familiar, was used. This study is the first, to our knowledge, where free sorting in combination with quality scoring has been proposed for this task.
MATERIALS AND METHODS
Wines
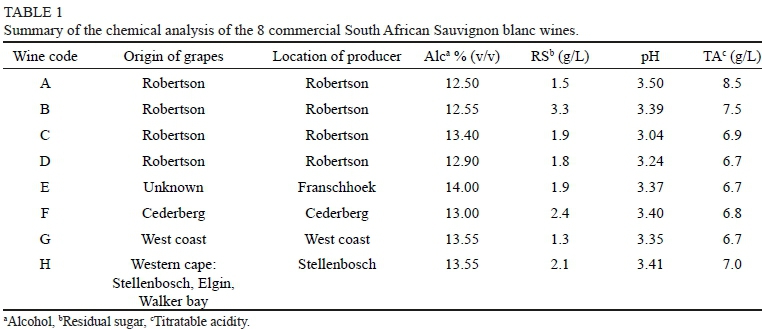
Eight commercial South African Sauvignon Blanc wines from the 2014 vintage and from different production regions were subjected to sensory evaluation (Table 1). All the wines were commercially available at the time of analysis and were certified by the South African Wine and Spirits Board.
Wines were chosen by industry professionals that regularly serve on Sauvignon Blanc tasting panels, including competition judging. The wines represented premium quality and unwooded South African Sauvignon Blanc wines. The industry professionals who selected the wines did not serve as judges during the evaluation of the wines tested in this study.
Panel
The sensory panel consisted of 24 judges, all wine industry professionals, of whom 67% were male and 33% female. The judges were between the ages of 23 and 60 (average age: 35, median of ages: 34). The participants attended regular tasting events as part of their occupation. All the judges, except two individuals, had more than five years' experience as tasters in the wine industry. No training was provided before the sensory analysis, and the judges were not paid for their participation.
Methodology
The sensory evaluation was conducted in a well-ventilated, odour free and temperature-controlled tasting room of a local wine cellar. Wines were presented at an ambient temperature of 20°C in standardised international tasting glasses (ISO NORM 3591, 1977). Glasses were coded with random three-digit codes and covered with Petri dishes. Judges received 25 mL of each wine in a different order according to a Williams Latin square design. Participants were not allowed to communicate with each other during the session, and only received information at the end of the session. Evaluation of the wines was conducted during a single session in a two-step process with a 10 min break in between. During the first step, a free sorting task with verbalisation, as described by Chollet et al. (2011), was performed to investigate similarities and differences between the sensory profiles of the wines. Judges had to freely describe their groups of wines using three to five words. They were requested not to use phrases, negative forms or intensity words; for example, phrases such as "not fruity" and "very fruity" were not permitted. Judges were not informed during the sorting task that quality scoring would follow. Quality scoring of the wines was performed in the second step.. Quality was scored separately for three different criteria, namely the appearance score out of 3 "the nose" score out of 7; and "the palate" score out of 10.
The criteria used for the evaluation of the appearance were clarity, colour depth and hue. The "nose" was explained to judges as orthonasal odour. "The palate" of the wine was defined as (1) the flavour, including retronasal aroma and the perception of basic tastes (sweet, sour, bitter) and (2) mouthfeel (concerning astringency, body) and (3) the length of the aftertaste.
The sum of the three individual scores was computed and represented the overall quality score out of 20. The 20-point quality score scale was chosen to score quality since professionals commonly use this in the South African wine industry. The judges were, therefore, familiar with the method due to their work experience gained from judging at wine competition and other wine evaluation panels. Furthermore, since no training was provided to the judges, the assumption was made that the judges had the ability to use the quality scale in a similar way and were familiar with using the 20-point scale. It was noted in literature that in most cases experts score wine quality similarly (Torri et al., 2013; Sáenz-Navajas et al., 2016) therefore justifying the above mentioned assumption.
Statistical analysis and visualisation of data
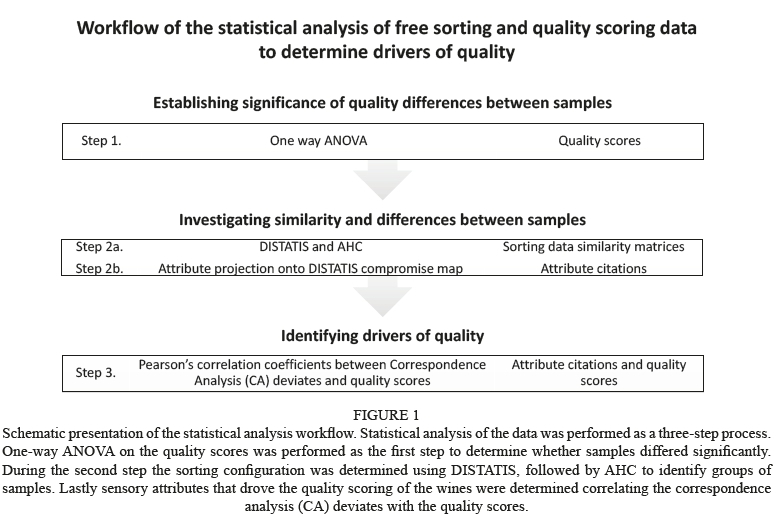
The analysis of the sensory data was conducted in three steps. Significant quality differences were identified as the first step, secondly similarities and differences between samples were investigated and lastly drivers of quality were identified.
Establishing significance of quality differences between samples
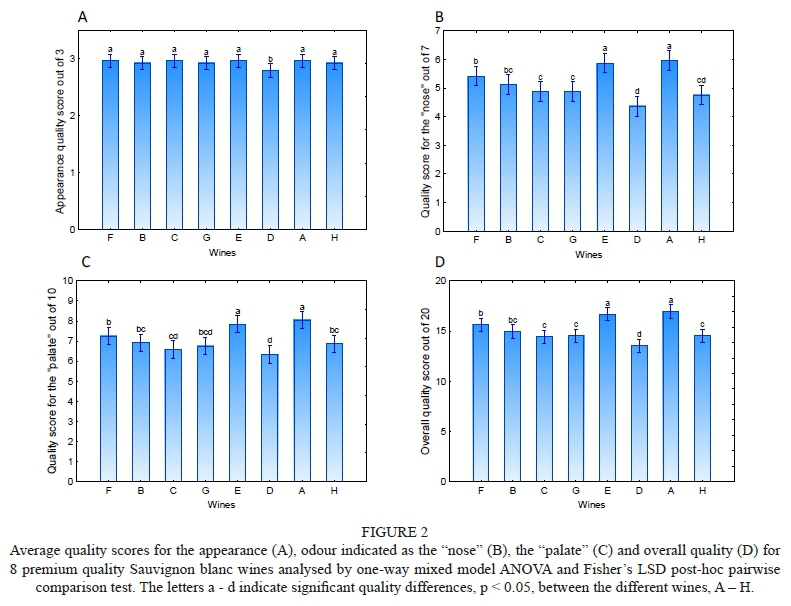
The first step of the data analysis process (Fig. 1) entailed the significance testing of the quality scores by means of one-way ANOVA using Statistica 13 (www.statsoft.com, Statsoft Inc.). Four separate ANOVA's were performed, respectively for the appearance, the "nose", the "palate" and overall quality. Pairwise comparisons were calculated, using the Fisher's LSD post-hoc test when the ANOVA results were significant.
Investigating similarities and differences between wines from the sorting configurations
Individual distance matrices showing the grouping of the wines by each judge in the sorting task was compiled. DISTATIS (Abdi et al., 2007) was performed directly on the distance matrices of the individual judges using R version 3.4.0 DistatisR (www.R-project.org), as shown in step 2a (Fig. 1). DISTATIS is a statistical method that takes many similarity or distance matrices, into account when analysing the similarity relationships between samples. It provides a visual representation where samples that appear close to each other on the plot are similar. Therefore, wines that were sorted into the same groups by many of the judges will appear close to each other and wines that were not grouped together will appear far from each other on the DISTATIS plot where the wine samples are represented. This plot is called the DISTATIS compromise map. DISTATIS has the advantage over other similar techniques that differences between the individual judges' data are represented on the compromise map by means of a confidence ellipse drawn around each sample (Abdi et al., 2007). In this study, the compromise map was used to: (1) analyse the data to investigate differences and similarities between wine samples and (2) to analyse the differences between the individual judges' data complimented by STATIS analysis performed in PanelCheck V1.4.2 (www.panelcheck.com, Nofima).
Agglomerative hierarchical cluster (AHC) analysis was performed using Statistica 13 (www.statsoft.com, Statsoft Inc.). AHC, using Ward's linkages and Euclidean distances, was applied to the coordinates of the first two dimensions (Dim1 and Dim2) of the DISTATIS compromise map to visualise grouping of wine samples due to similarity. Differences between the sorting data of the individual judges were visualised by means of the confidence ellipses on the DISTATIS compromise map, as well as a STATIS analysis performed in PanelCheck V1.4.2 (www.panelcheck.com, Nofima).
Investigating similarity and differences between samples from the descriptors used to describe groups
The descriptors generated to describe each group of wines in the verbalisation phase were captured by constructing a contingency table (Step 2b, Fig. 1). The attributes were reduced by combining similar descriptors that were used by less than 20% of the panel. When no synonyms for a particular descriptor could be identified, that descriptor was not used for further data analysis, similar to the strategy used by Campo et al., 2008 and Chollet et al., 2011. An example of similar descriptors was "grass", "cut grass" and "fresh green" notes. Two sensory research scientists and one industry professional reduced the descriptors independently, and discussed the outcomes of the descriptor reductions. The criteria for disagreement on descriptor reduction was to reach consensus through discussion. Where consensus could not be reached through discussion the opinion of a fourth person, a researcher in oenology and viticulture who frequently worked in collaboration with the sensory team was acquired. The industry professional was a member of the tasting group who performed the sensory analysis but did not take part in this experiment as a judge. The number of times a descriptor was used to describe a wine was counted. This was done for all the descriptors for all the wines for the reduced set of descriptors. The sum of the citations over all the judges for each descriptor for each wine, was compiled with the wines in the rows and the attributes in the columns of the contingency table. The number of judges who cited an attribute for a wine was tabulated at the intersection between the row of that wine and column of that attribute.
Pearson's correlation coefficients between the attributes and the DISTATIS product coordinates were calculated using the contingency table and the data of the first two dimensions of the DISTATIS analysis. Two Pearson's correlation coefficients were thus calculated for each descriptor; one between each attribute frequencies and the coordinates of the first dimension, and the second between the attribute frequencies and the coordinates of the second dimension. These correlation coefficients were projected as the x- and y-coordinates of the descriptors onto the DISTATIS compromise map to obtain a plot representing the similarity information from the sorting exercise as well as the descriptors assigned to the groups (Faye et al., 2004; Cartier et al., 2006, Abdi et al., 2007). Pearson's correlations coefficients and projections onto the DISTATIS space were executed using Microsoft Excel (Microsoft Corporation, wwwmicrosoft.com) and XLSTAT 2017 (www.xlstat.com, Addinsoft).
Identifying drivers of quality
During step three of the data analysis the drivers of quality were identified (Fig. 1). For this purpose, correspondence analysis (CA) was performed on the contingency table that contained the descriptors used to describe the groups that were created during the free sorting step. CA was conducted to obtain a descriptor-based sensory space which represents the relationship between the sensory characteristics of the samples. This space was used to correlate to the sensory characteristics to the perceived quality. Standardized deviates (also called Pearson residuals) were calculated for each descriptor from the formula provided below. These deviates indicate the magnitude of deviation from independence between wines and descriptors. Negative deviates indicate less occurrence of a descriptor with a wine as would be expected under independence, and positive deviates more occurrence of a descriptor with a wine as expected under independence. The mathematical equation used to calculate standardised CA deviates was:
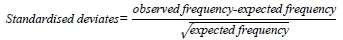
Pearson's correlation coefficients between the standardised CA deviates of attributes and quality scores could therefore be used to indicate the sensory drivers of quality. A positive correlation between a descriptor's standardized deviates and the quality score would indicate that the descriptor tend to co-occur more with better quality wines and less with worse quality wines. Attributes corresponding to Pearson's correlation coefficients larger than 0.7 were considered as drivers of quality. Statistica 13 (Statsoft Inc., www.statsoft.com) was used to perform CA, calculate standardised CA deviates and Pearson's correlation coefficients between the standardised CA deviates and quality scores.
RESULTS AND DISCUSSION
Quality differences between premium Sauvignon Blanc wines
Significant differences, at a 95% confidence level, between the wines in terms of the "nose", the "palate", the appearance and overall quality were obtained from the one-way ANOVA results. Among the set of wines used in this study, wines A and E were scored the highest and wine D the lowest for overall quality. The same trend was seen for the quality related to the "nose", although no significant difference between wines D and H was found. The quality differences related to the "palate" also showed the same trend, with the difference that wines C, G, and D did not differ significantly from each other and wine H was rated higher than wines C and D for the quality perceived on the "palate". Only one wine, wine D, was scored significantly lower than the other wines for appearance (Fig. 2). Wine colour was therefore not considered as an important contributor to the overall quality differences between wines. Similar findings by Valentin et al. 2016, showed that wine colour was not a major contributor toward Pinot Noir wine quality as measured on a 10-point scale. In the present research, more wines differed significantly from each other in terms of quality related to the "nose", than for quality related to the "palate" (Fig. 2). Interestingly, Sáenz-Navajas et al. 2016 observed that olfactory quality perception, which relates to the quality of the "the nose" of the wine, was found to be the most important aspect of overall wine quality. In summary, Wines A and E scored the highest for overall quality; wines F and B did not score significantly different from each other, as was the case for wines B and G, while wine F scored higher than wine G (Fig. 2D).
Panel consensus and differences between individual judges' sorting data
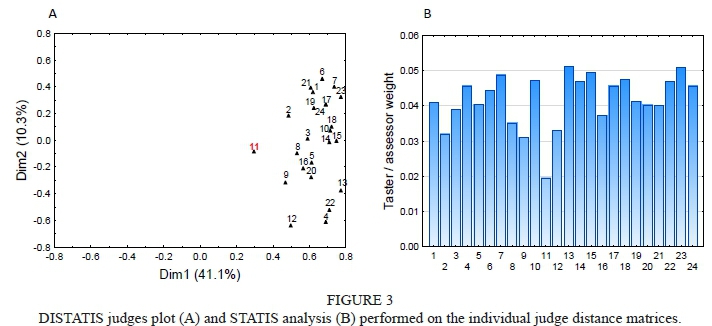
The consensus among the individual judges was investigated by inspection of the DISTATIS plot that showed the judge configuration (Fig. 3A). It is evident that the panel consensus was good. This is in line with the findings from the study by Torri et al. (2013) who inferred that the good consensus observed between experts' description of wines could be ascribed to their use of a common language that stemmed from experience gained from evaluating good quality wines. In the present study, judge 11 could be considered as an outlier. This was confirmed by performing a STATIS Principal Component Analysis (PCA) shown in Fig. 3B. It is clear that this judge's calculated weight (Fig. 3B) was lower than that of the other judges. The data of Judge 11 were not removed from the final data analyses, since analyses performed with and without this judge's data provided the same results (data analysis excluding judge 11 is not shown).
Differences and similarities between the wines through investigation of sorting groups
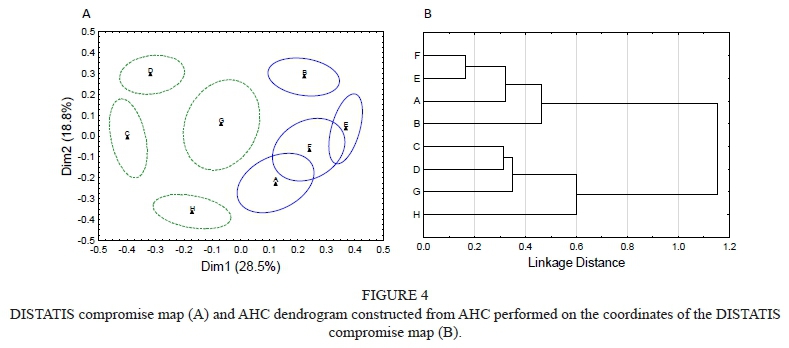
The sorting results visualised by agglomerative hierarchical cluster analysis (AHC) of the DISTATIS graph, consisting of the first two dimensions of the DISTATIS analysis, showed clear differences between some wines as well as similarities between others. It could be seen from the DISTATIS graph (Fig. 4A) and AHC dendrogram (Fig. 4B) that the wines could be divided into two groups along Dim1 and Dim2 with wines C, D, G and H forming one group and wines B, E, F and A another group. Furthermore, wines A and E, with the highest overall quality scores show overlapping confidence ellipses, also with wine F which has the third highest overall quality score, even if not different from wines B. Therefore, these wines were more similar to each other than wines B, C, D, G and H with lower overall quality scores. Quality seems to be either dependant on the sensory profiles of the wines or industry professionals intuitively sorted according to quality even though judges were not asked to sort wines according to quality. In fact, the judges did not know that they would score the quality of the wines until after the sorting task was completed. This is in-line with literature since Sáenz-Navajas et al. (2016) also reported that wine industry experts sorted according to quality. Therefore, the relationship between quality and the sensory attributes used to describe the sorting groups was investigated.
Aroma and flavour profile differences driving Sauvignon Blanc quality
The Pearson's correlation coefficients calculated between the CA deviates and quality scores (Table 2) indicated that the following attributes could be interpreted as drivers of quality: "passion fruit" associated with the quality of "the nose"; "asparagus" associated with taste quality and "peas" and "green pepper"' associated with the quality of "the nose", "palate" and overall quality. The correlation coefficients were > 0.7 and p values < 0.05. Correlation coefficients for "tropical", "apple" and "grass" were less than -0.8 (Table 2), with a significant p-value, p < 0.05. This indicated that these attributes were less associated with quality wines compared to when these attributes would be chosen randomly. In other words, these attributes were not associated with high quality wines.
In order to visualise all the information obtained and summarise the data analysis conducted the Pearson's correlation coefficients between the DISTATIS coordinates, Dim1 and Dim2, and the attribute citation were projected onto the DISTATIS compromise map (Fig. 5). To visualise the overall quality scores in an intuitive way, the size of the data markers representing the wines were adjusted. Large data markers represent high overall quality scores and smaller data markers lower scores. Attributes identified as drivers of quality were coloured blue and attributes negatively associated with quality were coloured red.
From the visualisation of the differences in the sensory characteristics, specifically odour, aroma and flavour (Fig. 5), it can be concluded that wines E and F were perceived similarly and attributes such as "peas", "green beans", "asparagus", "green", passion fruit" and "grapefruit" were cited frequently for these samples. Wine A was perceived as having a general green notes with similar attributes cited frequently as for wine E and F. The differences between wine A and, E and F were due to the fact that "green pepper" was used by all the assessors to describe wine A and "passion fruit" was cited frequently for wine F and E.
Wines that were generally perceived as having a green character with attributes such as "green pepper", "peas", "green beans" and "asparagus" were scored high for quality.
These wines, specifically wine A, F and E were, in addition to the green notes mentioned above, positively correlated with attributes such as "passion fruit", "grapefruit", "cat pee" and "tomato leaf" indicating that many of the judges cited these aromas for those wines. More specifically "cat pee" was cited frequently for wine A, "tomato leaf" for wines A and F and "passion fruit" for wine F and E and "grapefruit" for wine A, F and E. It is interesting to note that these wines were negatively correlated with notes such as "pineapple" for wine B and E, "fruit salad" for wine A and F and "tropical" for wine B and E. It appeared if green notes in general are associated with high quality South African Sauvignon Blanc wines, with "grass" as the exception for this sample set. The fact that "grass" was not associated with high-quality could be due to the overpowering effect of the "green pepper" notes in the high-quality wines masking the "grass" in those wines and might not have been perceived by the judges. Another possibility could be that judges choose to use the term "green" by considering that the "grass" note was included in the more general "green" description. The possibility is not ruled out that some bias may have been introduced in the judges' evaluations due to the specific sensory methodology used, or during the attribute combination step in the descriptor clean-up. Different criteria for combining attributes could be considered, for example, combining attributes belonging to the same attribute family rather than based on citation frequencies. This is the first report where "grass" was negatively correlated with notes such as "green pepper" and "asparagus". Generally grass notes for New World Sauvignon Blanc wines such as Australian and New Zealand wines are associated with high quality (Parr et al., 2006). "Grass" is frequently combined with "green pepper" and other green notes. In order to draw conclusions on the association of the "grass" note with the quality of Sauvignon Blanc wines further investigation, where a larger number of South African Sauvignon Blanc wines are included and different sensory methods for profiling are used, is needed. Wines with general tropical fruit characteristics, "fruit salad" and "apple" were scored lower for quality, while wines with "passion fruit" notes were scored higher.
Figure 5 provides researchers and industry professionals with a sensory map or graph to identify the drivers of wine quality by visualising sensory attributes and quality, with a single graph. This plot can be used as a final visualisation tool, but the necessary quality control steps, to ensure that the wines differ significantly in quality should still be conducted on the data. The following steps are recommended as quality control steps: (1) evaluate judge consensus by interpreting the confidence ellipses on the DISTATIS graph; (2) conduct ANOVA to ensure that quality differences between wines are significant; and (3) identify drivers of quality by computing correlation coefficients instead of only inspecting the final graph containing all the information. Clustering can be used to identify groups of samples, but inspection of the DISTATIS graph only to identify groups, might in many cases be sufficient.
Relationship between Sauvignon Blanc "palate" quality and taste, mouthfeel and chemical analysis
Taste and mouthfeel attributes, anticipated to be drivers of the "palate" quality score, were only cited by a few judges. The frequencies at which these attributes were cited were not high enough to include these attributes in the statistical data analysis, since less than 20% of the panel cited similar taste and mouthfeel attributes. Taking the technical information and chemical analysis of the wines (Table 1) into consideration, it could be seen through inspection that the quality of the wines was not dependant on, or correlated with the chemical values of pH, titratable acidity (TA), residual sugar (RS) or alcohol. Wines A and E were perceived as the highest quality wines, with no significant difference between the two. Wine A had an alcohol content of 12.5% v/v and wine E 14.0% v/v, spanning the minimum and maximum range for the set of samples. These two wines were also different with regards to TA content with wine A having 8.5 g/L, the highest of all the wines, and wine E 6.7 g/L, the second lowest of all the wines. The wine with the lowest residual sugar content (1.3 g/L), wine G, and the wine with the highest (3.3 g/L), wine B, did not differ significantly with regards to quality either. From these observations it seemed as if retronasal perception related to the flavour of the wines played the most important role in the perception of the "palate" quality rather than taste perception such as sweet and sour and the perception of alcohol burn. It was noted by Sáenz-Navajas et al. (2016) that the concepts of wine taste and mouthfeel quality are build only in context with wine odour and aroma quality. This means that the quality of a wine as perceived on the palate is mostly based on flavour and balance of the wine rather than the perception of the individual basic tastes (sweet, sour and bitter) and moutfeel sensations (astringency and alcohol burn).
CONCLUSIONS
Both the quality assessment and description of the sensory characteristics at smaller cellars are conducted as a tasting accompanied by a discussion of opinions. In cases where formal sensory analysis is used in combination with quality scoring, methods based on quantitative descriptive analysis (Stone & Sidel, 2004; Lawless & Heymann, 2010) such as descriptive analysis (DA), that involves extensive panel training is used.
The procedure presented in this article can be useful for the South African wine industry to obtain fast, objective scientific sensory data for relating sensory characteristics to quality. This procedure can be used in-house by cellars to relate quality parameters to intrinsic sensory properties like odour, aroma, flavour, taste and mouthfeel characteristics. However, taste and mouthfeel attributes were not identified as drivers of quality during this study. Colour was not a major role player in overall quality. It might therefore be sufficient to only score overall quality instead of the appearance, the "nose" and the "palate" quality separately. When quality as perceived specifically on the "palate" is required a different strategy should be investigated.
The most time-consuming part of this method was the reduction of the number of attributes through combination of similar attributes. Further research is needed to identify and address possible biases introduced with this step. We propose the combination of attributes belonging to the same descriptor family as an alternative when specific detail is not required.
The method could be used in a similar way to preference mapping (McFie & Thomson, 1988; Van Kleef et al., 2006; Lawless & Heymann, 2010) constructing sensory maps where liking data, obtained from consumers, are combined with profiling data. As opposed to classical preference mapping where quantitative descriptive analysis (QDA) data is used for profiling, sorting data could be used as profiling step to determine drivers of liking. It has been shown that both consumers and wine industry professionals have the ability to profile wines using sorting (Bester 2011). However, it should be kept in mind that the quality perceptions of wine by industry professionals do not necessarily correlate with consumer preference, liking and acceptance. It is therefore recommended that complementary consumer studies are used for marketing studies and testing consumer perception. This should be used during product development and to acquire analytical sensory data on quality and profiling of wines.
This type of data will correspond better to wine competition data than consumer perceptions since wine experts are used as judges during competition tastings. Another application could be to relate both quality data, from professionals and liking data, from consumers to intrinsic sensory properties using a similar procedure to the one presented in this article. The results obtained could be useful for benchmarking, product development and marketing where it is often crucial to relate quality perception of a product to the intrinsic, sensory characteristics like odour, aroma and flavour perception.
This procedure is particularly suited for industry applications for a number of reasons. Tasting groups consisting of industry professionals are common. Sorting is a relatively easy task that does not require sensory training and can be performed by experts as well as novices. A single graph can provide information regarding the quality and sensory characteristics of the products. It is a fast, low cost, objective scientific method and the results are easy to interpret providing key information useful for product development and marketing.
This method could be equally useful in research, as a rapid sensory tool, where the differences between wines in terms of quality or liking are needed to supplement research in oenology and viticulture.
LITERATURE CITED
Abdi, H., Valentin, D., Chollet, S. & Chrea, C., 2007. Analyzing assessors and products in sorting tasks: DISTATIS, theory and applications. Food Qual. Prefer. 18, 627-640. [ Links ]
Ballester, J., Dacremont, C., Le Fur, Y. & Etievant, P., 2005. The role of olfaction in the elaboration and use of the Chardonnay wine concept. Food Qual. Prefer. 16, 351-359. [ Links ]
Ballester, J., Patris, B., Symoneaux, R. & Valentin, D., 2008. Conceptual vs. perceptual wine spaces : Does expertise matter? Food Qual. Prefer. 19, 267-276. [ Links ]
Bécue-Bertaut, M. & Lê, S., 2011. Analysis of multilingual labelled sorting tasks: Application to a cross-cultural study in wine industry. J. Sens. Stud. 26, 299-310. [ Links ]
Bester, I., 2011. Classifying South African Chenin Blanc wine styles. MSc thesis, Stellenbosch University, Private Bag X1, 7602 Matieland (Stellenbosch), South Africa. [ Links ]
Botonaki, A. & Tsakiridou, E., 2004. Consumer response evaluation of a Greek quality wine. Acta Agricola Scandinavia, Section C, Food Economics. 1, 91-98. [ Links ]
Bredahl, L., Grunert, K. G. & Fertin, C., 1998. Relating consumer perceptions of pork quality to physical product characteristics. Food Qual. Prefer. 9, 273-281. [ Links ]
Campo, E., Do, B. V., Ferreira, V. & Valentin, D., 2008. Aroma properties of young Spanish monovarietal white wines: A study using sorting task, list of terms and frequency of citation. Austr. J. Grape Wine Res. 14, 104-115. [ Links ]
Cartier, R., Rytz, A., Lecomte, A., Poblete, F., Krystlik, J., Belin, E. & Martin, N., 2006. Sorting procedure as an alternative to quantitative descriptive analysis to obtain a product sensory map. Food Qual. Prefer. 17, 562-571. [ Links ]
Charters, S. & Pettigrew, S., 2007. The dimensions of wine quality. Food Qual. Prefer. 18, 997-1007. [ Links ]
Chollet, S. & Valentin, D., 2000. Le degré d'expertise a-t-il une influence sur la perception olfactive? Quelques éléments de response dans le domaine du vin. L'Année Psychologique. 100, 11-36. [ Links ]
Chollet, S., Lelièvre, M., Abdi, H. & Valentin, D., 2011. Sort and beer: Everything you wanted to know about the sorting task but did not dare to ask. Food Qual. Prefer. 22, 507-520. [ Links ]
Faye, P., Brémaud, D., Durand-Daubin, D., Courcoux, P., Giboreau, A. & Nicod, A., 2004. Perceptive free sorting and verbalization tasks with naive subjects: an alternative to descriptive mappings. Food Qual. Prefer. 15, 781-791. [ Links ]
Honoré-Chedozeau, C., Lelièvre-Desmas, M., Ballester, J., Chollet, S. & Valentin, D., 2017. Knowledge representation among assessors through free hierarchical sorting and a semi-directed interview: Exploring Beaujolais wines. Food Qual. Prefer. 57, 17-31. [ Links ]
Lattey, K. A., Bramley, B. R. & Francis, I. L., 2009. Consumer acceptability, sensory properties and expert quality judgements of Australian Cabernet Sauvignon and Shiraz wines. Austr. J. Grape & Wine Sci. 16, 189-202. [ Links ]
Lawless, H.T. & Heymann, H., 2010 (2nd ed). Sensory evaluation of food. Principles and Practices. Springer, New York, USA. [ Links ]
Lelièvre, M., Chollet, S., Abdi, H. & Valentin, D., 2008. What is the validity of the sorting task for describing beers? A study using trained and untrained assessors. Food Qual. Prefer. 19, 697-703. [ Links ]
Lelièvre, M., Chollet, S., Abdi, H. & Valentin, D., 2009. Beer-trained and untrained assessors rely more on vision than on taste when they categorize beers. Chemosens. Percept. 2, 143-153. [ Links ]
Lelièvre-Desmas, M., Valentin, D. & Chollet, S., 2017. Pivot profile method: What is the influence of the pivot and product space? Food Qual. Prefer. 61, 6-14. [ Links ]
McCloskey, L.P., Sylvan, M. & Arrhenius, S.P., 1996. Descriptive analysis for wine quality experts determining appellations by Chardonnay wine aroma. J. Sens. Stud. 11, 49-67. [ Links ]
McFie H. J. H., & Thomson D. M. H. 1988. Preference mapping and multidimensional scaling. In: J. R. Piggott (ed.), Sensory Analysis of Foods. Elsevier Applied Science, New York, pp. 381-409. [ Links ]
Neisser, U., 1987. Concepts and conceptual developments: ecological factors and intellectual factors in catergorization. Cambridge University Press. New York, USA [ Links ]
Pages, J., 2003. Recueil direct de distances sensorielles: application à l'évaluation de dix vins blancs de Val de Loire. Science des Aliments. 23, 679-888. [ Links ]
Pages, J., 2005. Collection and analysis of perceived product inter-distances using multiple factor analysis: application to the study of 10 white wines from the Loire Valley. Food Qual. Prefer. 16, 642-664. [ Links ]
Parr, W. V, Green, J. A. & White, K. G., 2006. Wine judging, context and New Zealand Sauvignon Blanc Évaluation de vins, contexte et Sauvignon Blanc Néo-Zélandais. Eur. Rev. Appl. Psychol. 56, 231-238. [ Links ]
Parr, W. V., Green, J. A., White, K. G. & Sherlock, R. R., 2007. The distinctive flavour of New Zealand Sauvignon Blanc: Sensory characterisation by wine professionals. Food Qual. Prefer. 18, 849-861. [ Links ]
Parr W. V., Ballester J., Peyron D., Grose C. & Valentin D., 2015. Perceived minerality in Sauvignon wines: Influence of culture and perception mode. Food Qual. Prefer. 41, 121-132. [ Links ]
Perrin, L. & Pagès, J., 2009. Construction of a product space for from the Ultra-flash profiling method: application to ten red wines from the Loire Valley. J. Sens. Stud. 24, 372-395. [ Links ]
Perrin, L., Symoneaux, R., Maître, I., Asselin, C., Jourjon, F. & Pages, J., 2008. Comparison of three sensory methods for use with the Napping® procedure: case of ten wines from the Loire Valley. Food Qual. Prefer. 19, 1-11. [ Links ]
Piombino, P., Nicklaus, S., Fur, Y. Le, Moio, L. & Le Quéré, J., 2004. Selection of products presenting given flavor characteristics: an application to wine. Am. J. Enol. Vitic. 55, 27-34. [ Links ]
Rosch, E., 1973. Natural categories. Cognitive Psychol. 7, 328- 350. [ Links ]
Sáenz-Navajas, M.-P., Avizcuri, J.-M., Ballester, J., Fernandez-Zurbano, P., Ferreira, V., Peyron, D. & Valentin, D., 2015. Sensory-active compounds influencing wine experts' and consumers' perception of red wine intrinsic quality. LWT - Food Science and Technology, 60, 400-411. [ Links ]
Sáenz-Navajas, M., Miguel, J., Federico, J., Ferreira, V., Fernández-Zurbano, P. & Valentin, D., 2016. Understanding quality judgements of red wines by experts: Effect of evaluation condition. Food Qual. Prefer. 48, 216-227. [ Links ]
Sáenz-Navajas, M.-P., Ballester, J., Pecher, C., Peyron, D. & Valentin, D., 2013. Sensory drivers of intrinsic quality of red wines: Effect of cultures and level of expertise. Food Res. Int. 54, 1506-1518. [ Links ]
Stone, H. & Sidel, J., 2004 (3rd ed). Sensory Evaluation Practices. CA: Academic Press Inc., San Diego, USA. [ Links ]
Thuillier, B., Valentin, D., Marchal, R. & Dacremont, C. (2015). Pivot© profile: A new descriptive method based on free description. Food Qual. Prefer. 42, 66-77. [ Links ]
Torri, L., Dinnella, C., Recchia, A., Naes, T., Tuorila, H. & Monteleone, E., 2013. Projective Mapping for interpreting wine aroma differences as perceived by naïve and experienced assessors. Food Qual. Prefer. 29, 6-15. [ Links ]
Valentin, D., Chollet, S., Lelièvre, M. & Abdi, H., 2012. Quick and dirty but still pretty good: A review of new descriptive methods in food science. Int. J. Food Sci. Tech. 47, 1563-1578. [ Links ]
Valentin, D., Parr, W. V, Peyron, D., Grose, C. & Ballester, J., 2016. Colour as a driver of Pinot Noir wine quality judgments: An investigation involving French and New Zealand wine professionals. Food Qual. Prefer. 48, 251261. [ Links ]
Van Kleef, E, Van Trijp, H. C. & Luning P. 2006. Internal versus external preference analysis: An exploratory study on end-user evaluation. Food Qual. Prefer. 17, 387-399. [ Links ]
Varela, P. & Ares, G. 2012. Sensory profiling, the blurred line between sensory and consumer science. A review of novel methods for product characterization. Food Res. Int. 48, 893-908. [ Links ]
Verdú Jover, A. J., Lloréns Montes, F. J. & Fuentes Fuentes, M. del M., 2004. Measuring perceptions of quality in food products: the case of red wine. Food Qual. Prefer. 15, 453-469. [ Links ]
Ziethalm, V. A., Berry, L. L. & Parasuraman, A., 1988. Communication and control processes in the delivery of service quality. J. Mark. 52, 35-48 [ Links ]
Submitted for publication: September 2017
Accepted for publication: August 2018
Acknowledgments: The authors would like to express their sincere gratitude to Winetech, for funding project IWBT13/02, and to THRIP, for funding project Tp14080888680. We would like to thank the tasting group, "Wein Freunde", in Robertson, South Africa for their participation as sensory judges
* Corresponding author: E-mail address: jeanne@sun.ac.za

