


Services on Demand
Article
 English (pdf)
 Article in xml format
 Article references
Indicators

Related links
-
 Cited by Google
 -
 Similars in Google
Share

 Permalink
South African Journal of Enology and Viticulture
On-line version ISSN 2224-7904
Print version ISSN 0253-939X
S. Afr. J. Enol. Vitic. vol.39 n.1 Stellenbosch 2018
http://dx.doi.org/10.21548/39-1-2670
ORIGINAL RESEARCH ARTICLES
Influence of acetaldehyde induction on monomeric and polymeric polyphenols in wine using the polyphenol/protein-binding model
Xuehui Wang; Xiaoyu Wang*; Yanyun Zhu; Mengmneg Ren; Chengrui Tian
College of Food Engineering and Nutritional Science, Shaanxi Normal University, Xi'an 710062, China
ABSTRACT
Polyphenols make a substantial contribution to the sensory properties of wine, and their evolution is affected by the acetaldehyde present during fermentation and ageing. In this work, five typical monomelic phenolic standards and three different polymeric flavanol fractions separated from wine were tested for polyphenol/protein binding by means of circular dichroism measurement and fluorescence spectrum assay in the presence or absence of acetaldehyde, and the formation of new oligomeric compounds linked by ethyl bridges was observed through HPLC-MS analyses. The results show that the protein-binding ability of these monomers was in the order of gallic acid > caffeic acid > quercetin > (+)-catechin > (-)-epicatechin, while acetaldehyde exerted a stronger effect on (+)-catechin and (-)-epicatechin monomers. Moreover, different wine fractions had different responses when reacted with proteins with the participation of acetaldehyde, while the polymeric proanthocyanidins produced the largest value (84.67%) of the salivary protein precipitation index and the strongest fluorescence-quenching effect.
Keywords: Polyphenols, acetaldehyde, protein, monomer, red wine
INTRODUCTION
The evolution of the taste of red wines during fermentation and ageing is thought to involve the function of acetaldehyde, which results from yeast metabolism and ethanol oxidation (Saucier et al., 1997; Danilewicz, 2003). Acetaldehyde can link oxygen with the wine phenolics, especially when it acts as a catalytic compound adjusting the reaction between phenolics generating macromolecule polymers to altering the astringency and stabilising colour, ultimately helping to change the organoleptic properties of red wine (Mateus et al., 2003; Sheridan & Elias, 2015).
There are a variety of polyphenols in grapes and wine that are particularly important in viticulture and oenology. The condensation reactions of polyphenols occur with the formation of acetaldehyde. Acetaldehyde can capture a proton, thereby becoming a carbocation, which can react with monomelic phenols in wine and start the process of forming ethylidene bridges, while at the same time producing a new family of vinyl-dimer or vinyl-trimer polymers (Fournand et al., 2006; He et al., 2010). There are distinct responses among different phenols to acetaldehyde-induced polymerisation. Previous studies have researched (+)-catechin-acetaldehyde condensation products and found that, when catechin was incubated with acetaldehyde, it yielded four products, binding with C6-C6, C8-C8, and C6-C8 (R and S) bonds (Saucier et al., 1997). During winemaking and ageing, the great diversity of catalytic reactions induced by acetaldehyde could generate more stable compounds with different physical and chemical features that change the organoleptic properties of wine colour and flavour (Boulton, 2001; Zhang et al., 2016). In particular, the wine astringency was shown to be lower than that unmodified by acetaldehyde (Vidal et al., 2004). To promote the yields of acetaldehyde and their beneficial effects, the micro-oxygenation (MOX) technique has been widely applied in the wine industry (Gómez-Plaza & Cano-López, 2011; Kontoudakis et al., 2011).
To the best of our knowledge, phenolic compounds generally improve the sensory properties and oral mouthfeel perceptions of red wine through several reactions, such as the incorporation of anthocyanins into the tannin structure, which could decrease the perceived astringency and increase colour stability (Joaquín-Cruz et al., 2015). These compounds are divided into monomeric, oligomeric and polymeric phenols, depending on the degree of polymerisation (DP) (Sun et al., 1998). It is well known that the monomeric phenols comprise mainly flavanols, stilbenes and phenolic acids, specifically including (+)-catechin, (-)-epicatechin, epigallocatechin, quercetin, gallic acid, caffeic acid, p-coumaric acid and so on (Ren et al., 2016). It is easier to conduct qualitative or quantitative research with all of these monomeric phenols because they have a relatively smaller molecular weight. Moreover, the degree of polymerisation of polyphenols is associated with the wine's perceived features. We know that monomeric and polymeric flavan-3-ols induce both bitterness and astringency but, according to previous reports, the monomeric flavan-3-ols increase the wine's bitterness faster than its astringency. In contrast, the oligomeric and polymeric proanthocyanidin fractions increase the astringency more rapidly than the wine's bitterness (Gawel, 1998; Kennedy & Jones, 2001).
To study the effect of polyphenols on astringency in wine, sensory analysis was the most commonly used method before some of the more appropriate physical-chemical methods were proposed. Recent studies have attempted to mimic the physiological environment and apply the in vitro model of protein/polyphenol to explore the interaction of phenolic compounds and proteins. For example, when referring to the mechanism of astringency perception, it is generally accepted that the interactions between salivary proteins and tannin play a significant role in astringency (Lee et al., 2012). In previous studies, sodium dodecyl sulphate polyacrylamide gel electrophoresis (SDS-PAGE) was commonly used to evaluate the intensity of astringency, and the salivary protein precipitation index (SPI) is an index evaluating the precipitation abilities of phenolic compounds with protein (Gambuti et al., 2011). The bovine serum albumin (BSA) was commonly used as an alternative to human serum albumin (HSA) in science research, and conservative substitutions of BSA are found among different amino acids, therefore it is convenient to use to research many features of proteins, such as binding constants and binding sites. However, the SDS-PAGE method is more suitable for the interaction of polymeric phenolics with proteins than that of monomeric phenolics. Taking this into account, five monomeric phenols derived from three different classes of main phenol families were studied by means of circular dichroism (CD) and fluorescence spectroscopy techniques. These sensitive and efficient spectroscopic methods are frequently used to explore the various aspects of protein structure and their interaction with small-molecule phenolic compounds (Gorji et al., 2015). In addition, HPLC-MS has also been applied to detect the influence of acetaldehyde induction on polyphenols in red wine. This research further explored the effect of acetaldehyde on momomeric and polymeric phenols.
MATERIALS AND METHODS
Reagents
The standards of (+)-catechin, (-)-epicatechin, gallic acid, caffeic acid, quercetin, BSA, p-dimethylaminocinnamalde-hyde (DMACA), Folin-Ciocalteu reagent and Waters C18 Sep-Pak columns were obtained from Sigma-Aldrich (St. Louis, MI, USA). Acetaldehyde, formic acid (MS grade), acetonitrile and formic acid (HPLC grade) were purchased from Fisher Scientific (Fairlawn, NJ, USA). The SDS-PAGE kit was purchased from Shanghai Solarbio Bioscience Technology Co., Ltd. (Shanghai, China).
Red wine samples
Five millilitres of red wine sample (Cabernet Sauvignon, Xi'an, 2012) was evaporated at 30 °C and dissolved in 0.067 mol/L phosphate-buffered solution (PBS) to 20 mL (pH=7). Next, 20 mL of the wine sample was fractionated utilizing Waters C-18 Sep-Pak cartridges with the elution of 10 mL of distilled water, 25 mL of ethyl acetate and 15 mL of metha-nol producing F1 (phenolic acids), F2 (monomeric flavan-3-ols and oligomeric proanthocyanidins) and F3 (polymeric proanthocyanidins), respectively, according to the previously reported method. All the fractions were evaporated to dry-ness (T < 35 °C), dissolved in 10 mL of methanol, and stored at -18 °C until used for further experiments.
Fluorescence spectrum assays
The fluorescence-quenching ability of five types of monomeric phenols and three fractions of red wine were evaluated with a 970 CRT fluorescence spectrum photometer (Shanghai, China). The fluorescence was excited at a wavelength of 280 nm and recorded at an emission wavelength from 285 to 450 nm. The scan speed was 600 nm min-1, and the emission slits were 10 nm 0.2 mL of each monomeric phenol's working fluid (1.0 χ 10-5 molL-1, solubility in methanol) reacted with 3 mL of 1.0χ10-6 mol/L BSA for 5 min at room temperature. A prepared 2.12 χ 10-2 mol/L acetaldehyde solution was then mixed with each monomeric polyphenol working fluid. After reacting at room temperature for two days, 0.2 mL of the mixed solution was added to 3 mL of BSA, and the fluorescence spectra were scanned as described above.
CD spectroscopy
Far-UV CD spectra were measured with a Chirascan CD Spectrophotometer (Applied Photophysics Ltd, United Kingdom) at a wavelength range from 178 to 260 nm. The instrument was flushed with nitrogen at a flow rate of 10 L/ min, the spectral bandwidth was set to 1 nm, and the scan time per point was set to 4 s. The CD spectra of three fractions of wine and five monomeric phenols combined with BSA were recorded before and after acetaldehyde induction.
HPLC-MS assays
HPLC-MS analyses were performed on a 4000QTrap MS/ MS system from Applied Biosystems (Foster City, Calif., USA) equipped with an electrospray ionisation (ESI) interface and a HPLC system comprising a binary LC-20AD pump, a SIL-20AHT autosampler, and a column oven (Shi-madzu, Tokyo, Japan).
When the monomers were incubated with acetaldehyde at 25°C, at pH 3.2, the pH was adjusted by the addition of 1 N of HCl and 20 uL of the mixture was injected into the Shim-pack XR-ODS column (75χ3 mm i.d. 2.2 um). The flow rate was 1 mL/min, with a mobile phase consisting of 0.1% formic acid in water (A) and acetonitrile (B). The time programme was achieved after washing and reconditioning the column, and the separation was adapted as follows: linear gradients: 5% B for 15 min, 70% B for 3 min, and a column temperature of 30.0°C. The ESI interface was used in the positive ion mode with the following settings: temperature (TEM) 500°C; curtain gas (CUR), nitrogen, 10 psi; nebuliser gas (GS1), air, 50 psi; heater gas (GS2), air, 50 psi; ion spray voltage 5 000 V. Data were collected and recorded in full-scan mode over a mass range of m/z 50 to 1 500.
Total phenols and total flavanols of different fractions of wine samples
The total phenol (TP) content of the three wine fractions was measured by the previously described Folin-Ciocalteu method. The absorbance was measured at 765 nm, and the resulting values were expressed in gallic acid equivalents (GAE) using units of mg/L. The total flavanol (TFA) content of the samples was determined by spectral analysis, as previously described (Meng et al., 2012). The absorbance was measured at 640 nm, and the total flavanol content was calculated through a calibration curve using catechin as the standard, with the results expressed as catechin equivalents (CTE).
SDS-PAGE assays
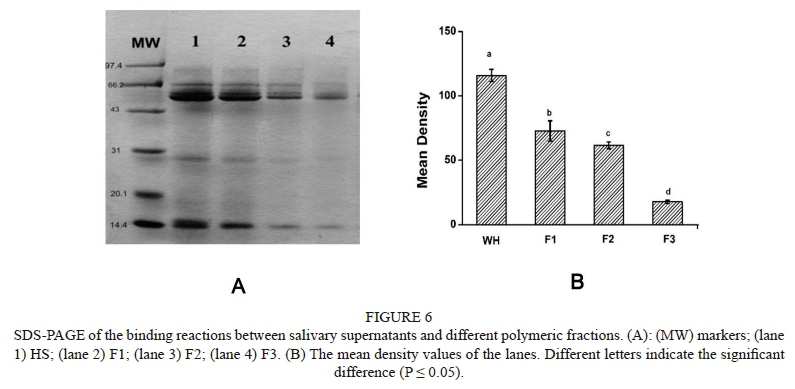
Saliva was collected from four healthy volunteers between 10:00 and 11:00; the volunteers were not permitted to consume any beverages or food before saliva collection. These human saliva samples were mixed and centrifuged to remove any insoluble material. The obtained supernatant was referred to as human saliva (HS). Then, 300 uL of HS and 150 uL of sample were allowed to interact for 5 min at 25°C, before being centrifuged at 10 000 g for 10 min. The supernatant was added to an equal volume of 2 x electrophoresis sample buffer (1 mol/L Tris-HCl, 4% SDS, 20% glycerol, 0.2 mol/L DTT, 0.1% bromophenol blue, pH 6.8), heated at 100°C for 5 min, and then analysed by SDS-PAGE (the stacking gel and resolving gel were run at 100 V and 120 V respectively). The gel was stained and destained as described by Gambuti et al. (2011). The percentage of reduction in the optical density of the two bands (at 55 kDa and 15 kDa) was obtained after interacting with the wine samples, and the SPI (salivary protein precipitation index) was calculated to evaluate the precipitation abilities of phenolic compounds with HS.
Statistical analysis
The results of total phenols and total flavanols are expressed as the mean ± standard deviation of three repetitions. Oneway analysis of variance (ANOVA) was performed to verify significant differences at P ≤ 0.05 using DPS 7.05.
RESULTS
Interaction of monomeric phenols and BSA
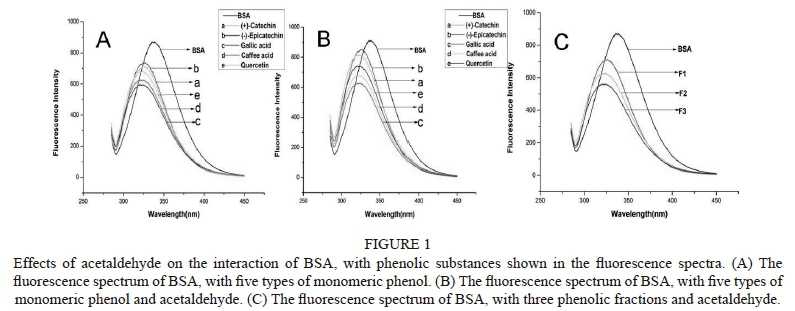
The fluorescence intensity of BSA in the presence of different monomeric phenols is shown in Fig. 1A. These excita-tion spectra were characterised by a shoulder centred at approximately 285 nm to 450 nm and an emission maximum of approximately 345 nm. The maximum fluorescence intensity of BSA was 876.68 and, with the addition of monomeric phenols, there was a noticeable decrease in the fluorescence intensity, indicating that monomeric phenols had a quenching effect on BSA. In addition, the fluorescence intensity decreased in the order of gallic acid > caffeic acid > quercetin > (+)-catechin > (-)-epicatechin.
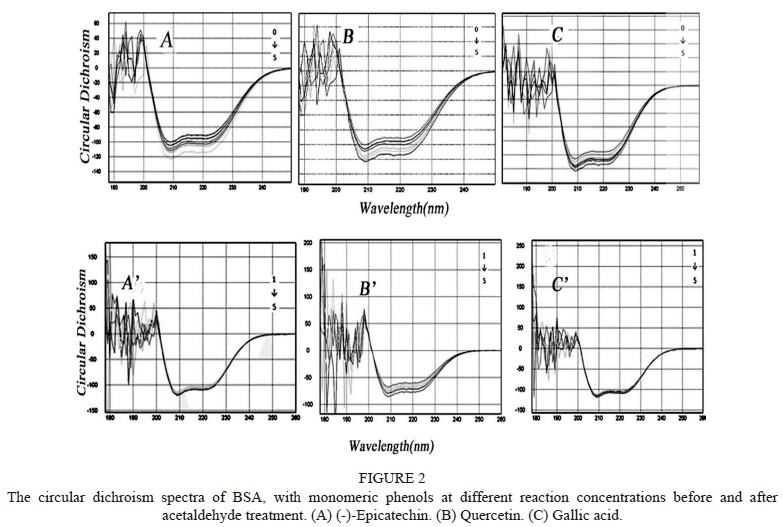
The far-UV CD spectra of BSA and the different concentrations of monomeric phenols are shown in Fig. 2. The region from 178 nm to 250 nm is the far-UV area, which was always used to investigate the secondary structure of protein (Pelton & McLean, 2000). Moreover, the CD spectrum of BSA exhibited characteristic features of the typical α-helix and β-sheet structure (Cliff et al., 2007). After the complex-ation of monomeric phenol with BSA, the far-UV CD spectra were similar to those of native BSA, but possessed a more markedly cotton structure (an α-helix structure with two negative minima at approximately 208 and 212 nm; there was a positive maximum at approximately 192 nm; the ß-sheet structure had a positive CD spectral band at approximately 185 nm to 200 nm and a negative one at 216 nm), and the CD spectra changed by phenolic acid monomers (gallic acid) more significantly than flavanol monomers( (-)-epicatechin).
Influence of acetaldehyde on monomeric phenols
The results of the acetaldehyde treatment showed that the intensity sequence of fluorescence-quenching ability was in accordance with that before acetaldehyde treatment. A comparison of the results of the CD spectra assays before and after the addition of acetaldehyde produced an equivalent order of the influence of monomeric phenol on the secondary structure of BSA. Nevertheless, the peak values of the spectra illustrate that the interaction of (+)-catechin with BSA was most strongly affected by the acetaldehyde. An unexpected finding was that the quenching effect of monomeric phenol on BSA was inhibited by acetaldehyde, but the CD spectra showed a more obvious cotton effect on the secondary structure of BSA after the acetaldehyde treatment. However, it is still not clear how acetaldehyde influenced the interaction of monomeric phenol with BSA.
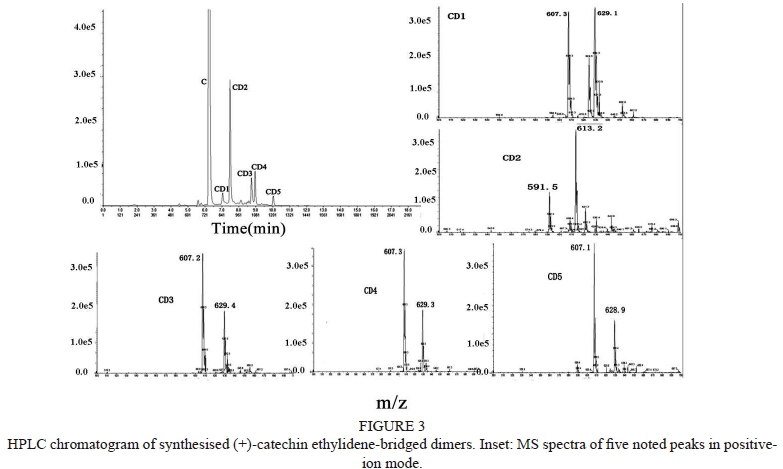
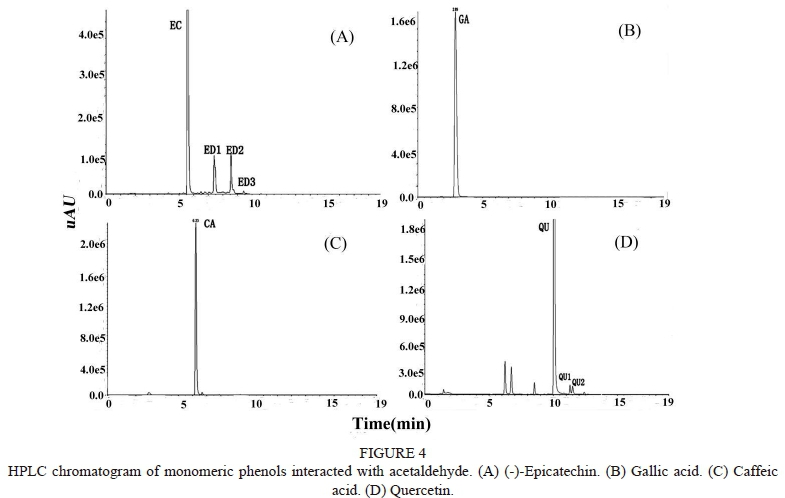
These results were further demonstrated by HPLC-MS, as presented in Fig. 3 and Fig. 4. Three, five, zero, zero and two types of new compounds formed when (-)-epicatechin, (+)-catechin, gallic acid, caffeic acid and quercetin were incubated with acetaldehyde respectively. The identification of phenolic compounds with a low molecular weight was done by comparing their retention times and mass spectra features with data reported in the literature (Noureddine et al., 1999). The figure for (+)-catechin represented typical HPLC chro-matograms, showing that the first peak was (+)-catechin, the five others (CD1, CD2, CD3, CD4 and CD5) were potentially condensed products of (+)-catechin and acetaldehyde, and the newly formed compounds eluted later than their (+)-catechin precursor, indicating that they were less polar and/or larger molecules. The results obtained indicate that these products are oligomeric compounds consisting of monomeric phenol units [(-)-epicatechin, (+)-catechin and quercetin] bridged by ethyl groups.
As shown in Fig. 3, distinct (+)-catechin derivatives, CD1, CD3, CD4 and CD5, were formed and gave a mass signal at m/z 607 and m/z 629, which corresponds to a molecular weight of 606; however, the molecular weight of CD2 was 590, indicating that CD2 was not the isomer of catechin-ethyl dimer.
Taking the interaction of acetaldehyde with (-)-epicat-echin, for example, fractions ED1, ED2 and ED3 formed when (-)-epicatechin was incubated with acetaldehyde and gave a signal at m/z 607 and m/z 629, which also corre-sponds to a molecular weight of 606 and thus a structure in which two (-)-epicatechin units are linked by an ethyl bridge.
When gallic acid and caffeic acid were incubated with acetaldehyde, their HPLC chromatograms showed that no new compounds were formed. As shown in Fig. 4B and Fig. 4C, the only peaks found were that of gallic acid at 2.89 min and caffeic acid at 6.23 min.
Investigation of three phenolic fractions incubated with acetaldehyde
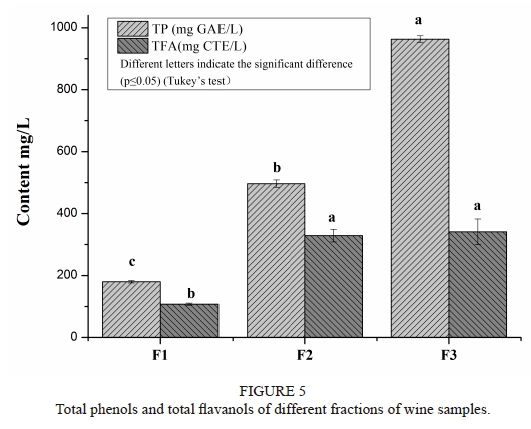
Fig. 5 presents the total phenolic (TP) content and total flavanols (TFA) of the three fractions. The results clearly show that F3 possessed the highest TP and TFA values (963.19 ± 10.72 mg GAE/L and 341.13 ± 41.52 mg CTE/L respectively), while F1 had the lowest values of both TP and TFA (179.93 ± 3.97 mg GAE/L and 107.48 ± 3.46 mg CTE/L respectively).
There was a clear decrease in the optical density of all these three fractions, and the SPI values were obtained. As expected, these fractions showed different binding capacities, with F3 possessing the highest SPI with an average level of 87.15%. In addition, it was clear that, after interacting with HS, the optical density value of F3 was significantly small, as shown in Fig. 6.
The fluorescence emission spectra and the CD spectra of BSA in the presence of acetaldehyde were assessed, along with three types offractions at 30°C. The CD spectra displayed a palpable cotton effect and a clear flute; moreover, these characteristics were most obvious in F3, which indicated that F3 had a greater effect on the structure of BSA. There was a noticeable decrease in the fluorescence intensity as a result of binding to F1, F2 and F3. In comparison with other fractions, F3 exhibited a significantly stronger quenching of the fluorescence of BSA, as displayed in Fig. 1C. These results are in agreement with the findings of SDS-PAGE, namely that the affinity with proteins is in the order of F3 > F2 > F1.
DISCUSSION
Polyphenols are crucial substances that contribute to wine astringency and whose polymerisation reactions in wine ageing are chiefly induced by acetaldehyde. Many beneficial reactions may alter the perception of astringency and improve wine quality.
Acetaldehyde has been identified as one of the most important electrophiles with direct or indirect effects on the type of ethylidene catalytic reaction acting on monomeric and polymeric phenols (Wollmann & Hofmann, 2013). Our results on fluorescence spectroscopy and CD spectra show that acetaldehyde had a significant influence on the interaction of protein and polyphenol. Combined with the HPLC-MS assays of five types of monomeric phenols interacting with acetaldehyde, it was found that acetaldehyde could not only provide ethyl bridges and produce a new polyphenol family under the conditions of winemaking and ageing (25°C and pH 3.2), but also induce reactions among flavanol monomers ((+)-catechin, (-)-epicatechin) more easily than phenolic acid monomers (gallic acid, caffeic acid). Therefore, according to previous investigations (Escribano-Bailón et al. 1996; Drinkine et al., 2005), the major oligomers formed comprised two diastereomers of flavanol units linked by an ethyl bridge through their C-8 positions. This finding indicates that acetaldehyde is involved in the chain reactions and generates oligomeric (vinyl-dimers and vinyl-trimers) and polymeric proanthocyanidins, which could alter wine features such as astringency and colour.
Monomeric phenols constitute an important portion of the phenolic constituents of wine, and these monomeric phenols must have a complex evolution process owing to the induction of acetaldehyde during wine ageing. As described in a previous report (Li et al., 2009), flavan-3-ols are the predominant monomeric phenols in wine, and (+)-catechins and (-)-epicatechins are the main flavanol-3-ol components. However, our results on CD spectral and fluorescence quenching show that the quenching ability of (-)-epicatechin and (+)-catechin was weaker than that of gallic acid and caf-feic acid. This result is in accordance with previous reports that have mentioned that the higher the content of gallic acid and caffeic acid in wine, the stronger the binding ability with salivary proteins in the oral cavity (Rudnitskaya et al., 2010; Saenz-Navajas et al., 2012; Gonzalo-Diago et al., 2014). The results of the acetaldehyde treatment show that acetaldehyde played a more significant role in (+)-catechin and (-)-epicatechin monomers than in gallic acid and caffeic acid monomers. Therefore, the flavan-3-ol substances exist mainly as oligomers and polymers in wine. This conclusion further proves that the abundant existence of gallic acid and caffeic acid, and even other phenolic acid monomers, could result in stronger binding with salivary proteins and possibly generate stronger astringent properties.
For the reasons given above, the flavonoid monomers ((+)-catechin and (-)-epicatechin) were influenced more greatly by acetaldehyde than the phenolic acid monomers, which is why flavonoids exist in wine as oligomers and polymers (Oszmianski & Sapis, 1989; Kovac et al., 2012). Moreover, the degree of polymerisation of polyphenols is associated with the perceived features of the wine. The different properties of monomeric and polymeric phenolics were evident among the three fractions, as our results show that, in contrast to F1 (phenolic acids) and F2 (monomeric flavan-3-ols and oligomeric proanthocyanidins), the F3 (polymeric proanthocyanidins) produced the highest TP and TFA values and salivary protein precipitation index. At the same time, in the presence of acetaldehyde, polymeric proanthocyanidins exhibited the greatest binding capacity with BSA, which was shown in the CD and fluorescence spectra. In summary, polymeric proanthocyanidins contribute greatly to red wine; in other words, a wine will display an intense affinity effect with human salivary protein in the presence of a higher content of polymeric proanthocyanidins.
There is a commonly accepted view that protein/polyphenol interactions cause the perception of astringency (Soares et al., 2017). In past investigations, proline-rich proteins (PRPs) and tannins were widely used to study the astringency perception at the molecular level (Wróblewski et al., 2001). In the latter study, a simplex protein (BSA) was selected to mimic the physiological environment in vitro. Moreover, circular dichroism and fluorescence spectroscopy techniques were used to study many features of protein, such as its binding affinity and binding constant. In the polyphe-nol/protein-binding model, monomeric phenolic solutions had no fluorescence emission under the conditions of the experimental concentration, while BSA solutions exhibited intense fluorescence emission, with a peak at 345 nm when excited at the appropriate wavelength (280 nm), and phenolic compounds played the role of quenchers to reduce the maximum fluorescence intensity of BSA. This behaviour of BSA concurs with the results of fluorescence-quenching studies described in the literature (Eswaran et al., 2015). The results demonstrate that there was a difference in the peak value of the fluorescence intensity among different polyphenols owing to the distinct affinity. This result could help to illustrate the contributions of different polyphenols to wine taste. In any case, apart from organoleptic evaluation, a polyphenol/ protein-binding model is indeed a good method to further explore the complex perception mechanisms.
CONCLUSIONS
The results obtained in this work indicate that acetaldehyde could give rise to the polymerisation reactions of polyphenols. Specifically, (+)-catechin and (-)-epicatechin mono-mers were influenced by acetaldehyde more significantly than gallic acid monomers, despite having the strongest protein-affinity effect. In addition, the polymeric flavanols resulting from acetaldehyde induction possessed the highest values of TP, TFA and SPI, and exhibited the most intense affinity with proteins under the acetaldehyde-mediated influence, implying that polymeric proanthocyanidins to a large extent determine the fate of wine. In conclusion, acetalde-hyde plays a vital role in the entire process of polyphenol and wine evolution.
LITERATURE CITED
Boulton, R., 2001. The copigmentation of anthocyanins and its role in the color of red wine: A critical review. Am. J. Enol. Vitic. 52, 67-87. [ Links ]
Cliff, M.A., King, M.C. & Schlosser, J., 2007. Anthocyanin, phenolic composition, colour measurement and sensory analysis of BC commercial red wines. Food Res. Int. 40(1), 92-100. [ Links ]
Danilewicz, J.C., 2003. Review of reaction mechanisms of oxygen and proposed intermediate reduction products in wine: Central role of iron and copper. Am. J. Enol. Vitic. 54, 73-85. [ Links ]
Drinkine, J., Glories, Y. & Saucier, C., 2005. (+)-Catechin-aldehyde condensations: Competition between acetaldehyde and glyoxylic acid. J. Agric. Food Chem. 53, 7552-7558. [ Links ]
Escribano-Bailón, T., Dangles, O. & Brouillard, R., 1996. Coupling reactions between flavylium ions and catechin. Phytochem. 41, 1583-1592. [ Links ]
Eswaran, J., Sivalingam, K., Viswanatha, V.P., Nattamai, S.P.B. & Nalla-samy, D., 2015. Synthesis, characterization, DNA/protein binding and in vitro cytotoxic evaluation of new Ru(III) complexes containing aroylhydra-zone ligands: Does hydrogen bonding influence the coordination behavior of hydrazones? Inorg. Chim. Acta 429, 148-159. [ Links ]
Fournand, D., Vicens, A., Sidhoum, L., Souquet, J.M., Michel M.A. & Cheynier, V., 2006. Accumulation and extractability of grape skin tannins and anthocyanins at different advanced physiological stages. J. Agric. Food Chem. 54, 7331-7335. [ Links ]
Gambuti, A., Rinaldi, A., Lisanti, M.T., Pessina, R. & Moio, L., 2011. Partial dealcoholisation of red wines by membrane contactor technique: Influence on colour, phenolic compounds and saliva precipitation index. Eur. Food Res. Technol. 233, 647-655. [ Links ]
Gawel, R., 1998. Red wine astringency: A review. Aust. J. Grape Wine Res. 4, 74-95. [ Links ]
Gómez-Plaza, E. & Cano-López, M., 2011. A review on micro-oxygen-ation of red wines: Claims, benefits and the underlying chemistry. Food Chem. 125, 1131-1140. [ Links ]
Gonzalo-Diago, A., Dizy, M. & Fernández-Zurbano, P., 2014. Contribution of low molecular weight phenols to bitter taste and mouthfeel properties in red wines. Food Chem. 154, 187-198. [ Links ]
Gorji, E.G., Rocchi, E., Schleining, G., Bender-Bojalil, D., Furtmüller, P.G. & Toca-Herrera, J.L., 2015. Characterization of resveratrol-milk protein interaction. J. Food Eng. 167, 217-225. [ Links ]
He, J., Carvalho, A.R., Mateus, N. & Freitas, V., 2010. Spectral features and stability of oligomeric pyranoanthocyanin-flavanol pigments isolated from red wines. J. Agric. Food Chem. 58, 9249-9258. [ Links ]
Joaquín-Cruz, E., Dueñas, M., García-Cruz, L., Salinas-Moreno, Y., Santos-Buelga, C. & García-Salinas, C., 2015. Anthocyanin and phenolic characterization, chemical composition and antioxidant activity of chagalapoli (Ardisia compressa K.) fruit: A tropical source of natural pigments. Food Res. Int. 70, 151-157. [ Links ]
Kennedy, J.A. & Jones, G.P., 2001. Analysis of proanthocyanidin cleavage products following acid-catalysis in the presence of excess phloroglucinol. J. Agric. Food Chem. 49, 1740-1746. [ Links ]
Kontoudakis, N., González, E., Gil, M., Esteruelas, M., Fort, F. & Canals, J.M., 2011. Influence of wine pH on changes in color and polyphenol composition induced by micro-oxygenation. J. Agric. Food Chem. 59, 1974-84. [ Links ]
Kovac, V., Bourzeix, M., Heredia, N. & Ramos, T., 2012. Etudes des cat-echins et proanthocyanidols de raisins et vins blancs. J. Food Eng. 87, 245-249. [ Links ]
Lee, C.A., Ismail, B. & Vickers, Z.M., 2012. The role of salivary proteins in the mechanism of astringency. J. Food Sci. 77, 381-387. [ Links ]
Li, H., Wang, X.Y., Li, Y., Li, P.H., Wang, H., 2009. Polyphenolic compounds and antioxidant properties of selected China wines. Food Chem. 112, 454-460. [ Links ]
Mateus, N., Carvalho, E., Carvalho, A.R., Melo, A., González-Paramás, A.M. & Santos-Buelga, C.V., 2003. Isolation and structural characterization of new acylated anthocyanin-vinyl-flavanol pigments occurring in aging red wines. J. Agric. Food Chem. 51, 277-282. [ Links ]
Meng, J.F., Fang, Y.L., Qin, M.Y., Zhuang, X.F. & Zhang, Z.W., 2012. Varietal differences among the phenolic profiles and antioxidant properties of four cultivars of spine grape (Vitis davidii Foex) in Chongyi County (China). Food Chem. 134, 2049-2056. [ Links ]
Noureddine, E., Fulcrand, H., Véronique C.A. & Moutounet, M., 1999. Competition between (+)-catechin and (-)-epicatechin in acetaldehyde-induced polymerization of flavanols. J. Agric. Food Chem. 47, 2088-2095. [ Links ]
Oszmianski, J. & Sapis, J.C., 1989. Fractionation and identification of some low molecular weight grape seed phenolics. J. Agric. Food Chem. 37, 1293-1297. [ Links ]
Pelton, J.T. & McLean, L.R., 2000. Spectroscopic methods for analysis of protein secondary structure. Anal. Biochem. 277, 167-176. [ Links ]
Ren, M., Wang, X., Tian, C., Li, X., Zhang, B., Song, X. & Zhang, J., 2016. Characterization of organic acids and phenolic compounds of cereal vinegars and fruit vinegars in China. J. Food Process. Pres. 58, 93-97. [ Links ]
Rudnitskaya, A., Nieuwoudt, H.H., Muller, N., Legin, A., Du, T.M. & Bauer, F.F., 2010. Instrumental measurement of bitter taste in red wine using an electronic tongue. Anal. Bioanal. Chem. 397, 3051-60. [ Links ]
Saenz-Navajas, M.P., Avizcuri, J.M., Ferreira, V. & Fernandebano, P., 2012. Insights on the chemical basis of the astringency of Spanish red wines. Food Chem. 134, 1484-93. [ Links ]
Saucier, C., Guerra, C., Pianet, I., Laguerre, M. & Glories, Y., 1997. (+)-Cat-echin-acetaldehyde condensation products in relation to wine-ageing. Phy- tochem. 46, 229-234. [ Links ]
Sheridan, M.K. & Elias, R.J., 2015. Exogenous acetaldehyde as a tool for modulating wine color and astringency during fermentation. Food Chem. 177, 17-22. [ Links ]
Soares, S., Brandao, E., Mateus, N. & De Freitas, V., 2017. Sensorial properties of red wine polyphenols: Astringency and bitterness. Crit. Rev. Food Sci. Nutr. 57, 937-948. [ Links ]
Sun, B., Leandro, C., Ricardo-da Silva, J.M. & Spranger, I., 1998. Separation of grape and wine proanthocyanidins according to their degree of polymerization. J. Agric. Food Chem. 46, 1390-1396. [ Links ]
Vidal, S., Francis, L., Noble, A., Kwiatkowski, M., Cheynier, V. & Waters, E., 2004. Taste and mouth-feel properties of different types of tannin-like polyphenolic compounds and anthocyanins in wine. Anal. Chim. Acta 513, 57-65. [ Links ]
Wollmann, N. & Hofmann, T., 2013. Compositional and sensory characterization of red wine polymers. J. Agric. Food Chem. 61, 2045-2061. [ Links ]
Wróblewski, K., Muhandiram, R., Chakrabartty, A. & Bennick, A., 2001. The molecular interaction of human salivary histatins with polyphenolic compounds. Eur. J. Biochem. 268, 4384-4397. [ Links ]
Zhang, B., He, F., Zhou, P.P., Liu, Y. & Duan, C.Q., 2016. The color expression of copigmentation between malvidin-3-O-glucoside and three phenolic aldehydes in model solutions: The effects of pH and molar ratio. Food Chem. 199, 220-228. [ Links ]
Submitted for publication: July 2017
Accepted for publication: March 2018
Acknowledgments: This work was supported by the National Nature Science Foundation (Project 31301526), the Scientific Research Project of Shaanxi (Project 2017NY-149), and the Expenses for Universities' Basic Scientific Research of Central Authorities (Project GK201402041)
* Corresponding author: E-mail address: wangxiaoyu@snnu.edu.cn

