


Services on Demand
Article
 English (pdf)
 Article in xml format
 Article references
Indicators

Related links
-
 Cited by Google
 -
 Similars in Google
Share

 Permalink
South African Journal of Enology and Viticulture
On-line version ISSN 2224-7904
Print version ISSN 0253-939X
S. Afr. J. Enol. Vitic. vol.39 n.1 Stellenbosch 2018
http://dx.doi.org/10.21548/39-1-2621
ORIGINAL RESEARCH ARTICLES
The effect of grape temperature at pressing on phenolic extraction and evolution in Méthode Cap Classique wines throughout winemaking
M. MafataI, II; A. BuicaI; W.J. du ToitI; F.P. van JaarsveldII, *
IDepartment of Viticulture and Oenology, Stellenbosch University, Private Bag X1, Matieland 7602, South Africa
IIPost-Harvest & Wine Technology, ARC Infruitec-Nietvoorbij, Private Bag X5026, Stellenbosch 7599, South Africa
ABSTRACT
Phenolic compounds are important quality indicators of wine. Their composition in wine is determined by various factors, including grape variety, terroir, viticultural practices and oenological practices. There is very little extraction of colour compounds and, generally, very little phenolic content is expected and desired during traditional sparkling wine (TSW) vinification. Since phenolics are thought to reduce ageing capacity (Zoecklein, 2002), and are linked to browning in TSW (Ibern-Gómez et al., 2000), winemakers try to keep phenolic concentrations low throughout winemaking. This study investigated the effect of grape temperature at pressing on the phenolic extraction in Méthode Cap Classique (MCC) wines and the evolution of the phenolics throughout winemaking. MCC wines were made by the traditional method over two vintages (2014 and 2015) using Chardonnay and Pinot Noir grapes harvested from two regions (Robertson and Darling) and stored at 0°C, 10°C, 25°C and 30°C. MCCs made from grapes stored at lower temperatures (0°C and 10°C) were found to have lower total phenolic content, colour intensity and total hydroxycinnamates than wines made from grapes stored at higher temperatures (25°C and 30°C). This shows that there was greater phenolic extraction at higher temperatures. No changes in the phenolic content were observed throughout winemaking.
Keywords: Méthode Cap Classique, traditional sparkling wine, phenolic compounds, Chardonnay, Pinot Noir, temperature
INTRODUCTION
The grape cultivar, clone, viticultural practices and vinification all affect the composition and concentration of phenolic compounds in wine (Singleton et al., 1983; Spigno et al., 2007; Kerslake et al., 2013). The phenolic composition and concentration of the grape berry are good indicators of what ultimately goes into the wine itself. Traditional sparkling wine (TSW) winemakers do not desire a high phenolic content, as high phenolic levels are thought to have negative effects on the processing of sparkling wine (Zoecklein, 2002). Early harvesting when the phenolic maturity is low, light pressing of the grapes and a lack of skin contact are used to obtain juice with low phenolic concentrations (Zoecklein, 2002). Due to these viticultural and vinification practices, the phenolic content of TSWs comprises mainly non-flavonoids (Andrés-Lacueva et al., 1996; Ibern-Gómez et al., 2000).
TSWs have a lower phenolic concentration compared to table wines (Zoecklein, 2002; Chamkha et al., 2003). Grape-derived phenolic compounds can be categorised into two main groups, namely non-flavonoids (hydroxybenzoic/ phenolic acids and hydroxycinnamates) with lower molecular weight and flavonoids (anthocyanins, flavan-3-ols and tannins) with higher molecular weight (Fernandéz de Simon et al., 1992; Pozo-Bayón et al., 2003; Monagas et al., 2005). Non-flavonoids are located throughout the berry, but are more concentrated in the flesh and hence are extracted into the juice upon pressing during TSW vinification (Ribéreau-Gayon, 1982).
Two studies on the evolution of phenolics throughout TSW winemaking found differing results. A study on cava TSW made using Spanish cultivars showed a decrease throughout winemaking, and the total phenolic content was higher than that of champagne made from Chardonnay and Pinot Noir cultivars (Martínez-Lapuente et al., 2013). The phenolic concentrations of champagne were lower than those reported for cava and in addition showed no change throughout winemaking (Chamkha et al., 2003). These differences may have been due to the differences in grape cultivars used. These studies used high-performance liquid chromatography diode-array detection (HPLC-DAD) to quantify total and individual proanthocyanidins, flavonols and hydroxycinnamates and found that the total hydroxycinnamates were the highest in concentration (Gil-Muñoz et al., 1999; Chamkha et al., 2003; Martínez-Lapuente et al., 2013). It has been shown that, when grapes used for TSW elaboration are chilled at 10°C, phenolic extraction into juice during the first days of processing is decreased (Gil-Muñoz et al., 1999). Studies on TSW have focused primarily on the foaming capability and volatile composition of the wines, and very little on their phenolic content. Studies on the phenolic content and phenolic evolution of the South African TSW, MCC, throughout TSW winemaking have yet to be published.
The aim of this study was to investigate the effect of grape temperature at pressing on the phenolic extraction and phenolic evolution of nine-months' bottle-aged MCC wines made from a blend of whole-bunch-pressed Chardonnay and Pinot Noir grapes harvested over two vintages (2014 and 2015) and two farms (Darling and Robertson).
MATERIALS AND METHODS
Vinification and sampling
Chardonnay and Pinot Noir grapes were harvested in the early morning at Robertson and Darling in 2014 and 2015 and transported on the day to the ARC Infruitec-Nietvoorbij experimental cellar, Stellenbosch, South Africa (Mafata, 2017). For each region and for each cultivar, two tons of grapes were divided into four batches and stored in temperature-controlled rooms, at 0°C, 10°C, 25°C and 30°C, until they had acclimatised to the set temperature. According to the cellar's winemaking protocol, the grapes received no SO2 addition. Digital temperature probes were inserted in and between grapes to ascertain that the grapes had reached and maintained the set temperature.
Each batch was further divided into three repeats, the grapes were whole-bunch pressed at 1.0 to 1.5 bar into 90 L drums, and 50 mg/L SO2 was added. The juice was stored overnight at 14°C to acclimatise to the fermentation temperature, inoculated with 0.3 g/L Saccharomyces cerevisiae IOC18-2007 (CDS Vintec, Stellenbosch, South Africa) yeast, and 0.5 g/L diammonium phosphate (DAP) was added. The wines were left to ferment at 14°C and fermentation was tracked by measuring the pressure in the bottle. Once the fermentation was finished, the wines were racked and 50 mg/L SO2 was added. The base wines were clarified using 0.75 g/L bentonite, cold stabilised at 0°C for two weeks and racked once more. Corresponding Pinot Noir and Chardonnay treatments were then blended in a 50/50 ratio and allowed to stand for a further week before being sweetened to 24 g/L with cane sugar, inoculated with a 4% liqueur de tirage made up of the same yeast as for the first fermentation, bottled under nitrogen gas and capped with a crown capper. The second fermentation was tracked by measuring the pressure in the bottle, with one bottle per treatment being sacrificed at each test. Fermentation was considered to have ended once the pressure stabilised. The wines were shelved horizontally and allowed to mature in the bottle for a further seven months. The wines were riddled and disgorged at Simonsig Cellar, Stellenbosch, South Africa. Liqueur d'expédition/Liqueur de dosage was not added and the final brut wines were recapped. A schematic of the MCC winemaking protocol, indicating stages at which samples were taken, is provided in Fig. 1.
Diagram of MCC winemaking protocol using Chardonnay (CH) and Pinot Noir (PN) grapes. The right pane shows the six stages sampled for chemical analyses. Wines sampled before (CH_BW and PN_ BW) and after (CHBWpCS and PN_BW-pCS) cold stabilisation, two months in the bottle (T2M), and the final wines nine months in the bottle (T9M).
Oenological parameters
The sugar content of the juice at room temperature (after temperature treatment) was analysed using a PR-30a (alpha) digital refractometer (ATAGO, Thailand). Wines were analysed for pH and titratable acidity (TA) on a Tim868 auto-titrator using American Chemical Society (ACS)-grade reagents from Hanna Instruments (Pty) Ltd (Rhode Island, USA). Free and total sulphur dioxide (SO2) concentrations were analysed according to the Ripper method using ACS-grade reagents (Vahl & Converse, 1980). The alcohol concentration was analysed on an Anton Paar Alcolyzer Wine M/ME. Residual sugar (RS) and volatile acidity (VA) were analysed on degassed samples at Koelenhof Winery, Stellenbosch, South Africa using Fehling's method and distillation respectively.
Phenolic analysis
The analysis was adapted from Somers and Ziemelis (1985). All analyses were performed in triplicate. Prior to analysis, the sparkling wines (T2M and T9M) were degassed under vacuum. All samples were centrifuged at 13 000 rpm in 2 mL micro-centrifuge tubes for 10 minutes and the supernatant was decanted. The supernatant was acidified with a 1 M hydrochloric acid (HCl) solution (using 32 % HCl from SigmaAldrich) and allowed to stand for three hours. The absorbance was read on a Multiskan GO 151002586 spectrophotometer (Thermo Fisher Scientific, USA), at 420 and 520 nm for the non-acidified samples and at 280, 320 and 520 nm for the acidified samples. All spectral measures were converted to 10 mm path-length absorbance units. Ultrapure water was obtained using a Millipore water purification system. The quantification of the total phenolics (TP) was based on a standard curve of 200, 100, 50, 25 and 10 mg/L of gallic acid (Sigma-Aldrich). Concentrations were expressed in mg/L gallic acid equivalents (mg/L GAE) using the absorbance of acidified samples at 280 nm. Total hydroxycinnamates (TH) were calculated as the absorbance at 320 nm acidified/at low pH (A320 - 2.5). The colour intensity (CI) and colour hue (CH), at actual wine pH (not acidified) and SO2 level, were calculated as follows: CI = A520 + A420 CH = A420 /A520.
Statistical analysis
Multivariate analysis (principal component analysis, PCA) was performed on the phenolics data and oenological parameters using XLStat (Version 2016, Addinsoft, New York, USA) in order to find statistical relationships between temperature treatments and the measured data. Univariate analyses (analysis of variance, ANOVA) were performed using the GLM procedure of SAS software (Version 9.4; SAS Institute Inc., Cary, USA). Fisher's least significant difference was calculated at the 5% level (p < 0.05) to compare treatment means.
RESULTS AND DISCUSSION
Vinification and oenological parameters
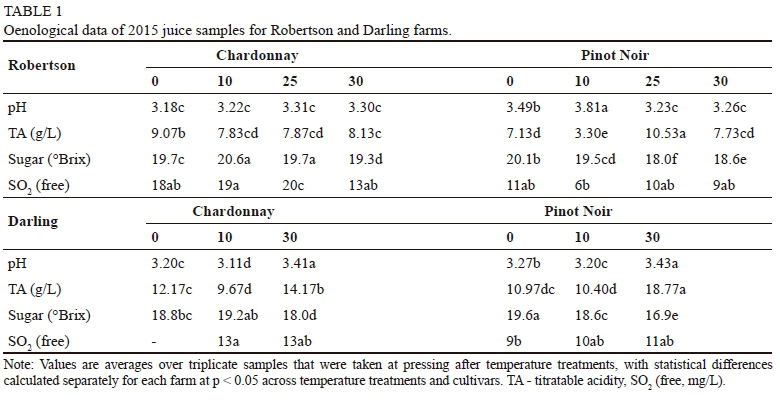
Sugar measurements of the grape juice were taken at room temperature after the grapes were temperature treated. Grapes at 25°C and 30°C resulted in lower berry sugar concentrations (Table 1) compared to grapes at 0°C and 10°C for both farms and both vintages, with the exception of the Robertson 25°C treatment of 2014 (Table A1). The differences in berry sugar concentration between treatments may have been due to the conversion of sugar to alcohol as a result of the activity of native yeast during storage at higher temperatures, since no SO2 was added to the grapes prior to storage. All parameters (Tables 1, A2 and A3) were within the ranges reported in the literature (Ganss et al., 2011; Zoecklein, 2002).
The juice fermented to dryness for both alcoholic fermentations, with the exception of the 25°C treatments during 2015, which were irretrievably stuck during the first fermentation and hence excluded from the final analysis. The average pressure in the bottle was 6.4 bars, with no differences in the final pressure across treatments.
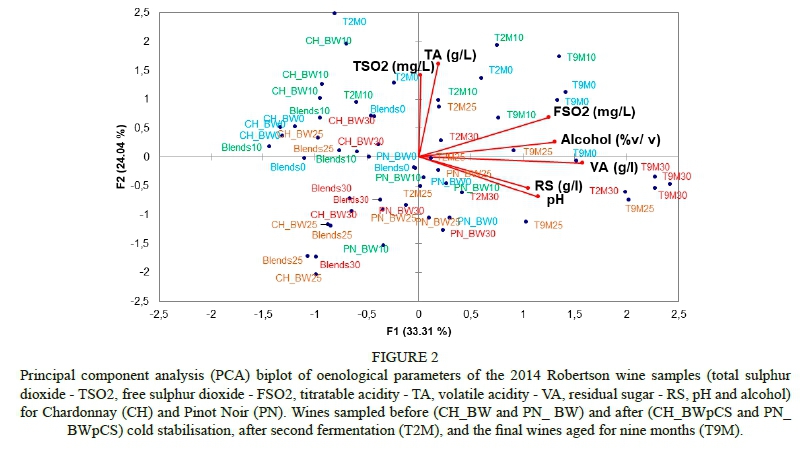
The first two components of the PCA accounted for over 50% of the variation in the oenological parameters for both farms and over both vintages (Figs 2, A1, A2 and A3), and samples of wines in the final two stages of winemaking (T2M and T9M) grouped with alcohol, VA and RS (Fig. 2).
The increase in alcohol was proportional to the berry sugar content and to the sugar addition at the second fermentation. For both vintages and both farms there were no significant differences in the oenological parameters across treatments (Fig. 2), with the exception of the VA of the higher temperature treatments being higher than that of the lower temperature treatments. All wines were fermented to dryness, hence the final MCCs were brut wines with less than 8 g/L.
Phenolic analysis of 2014 vintage
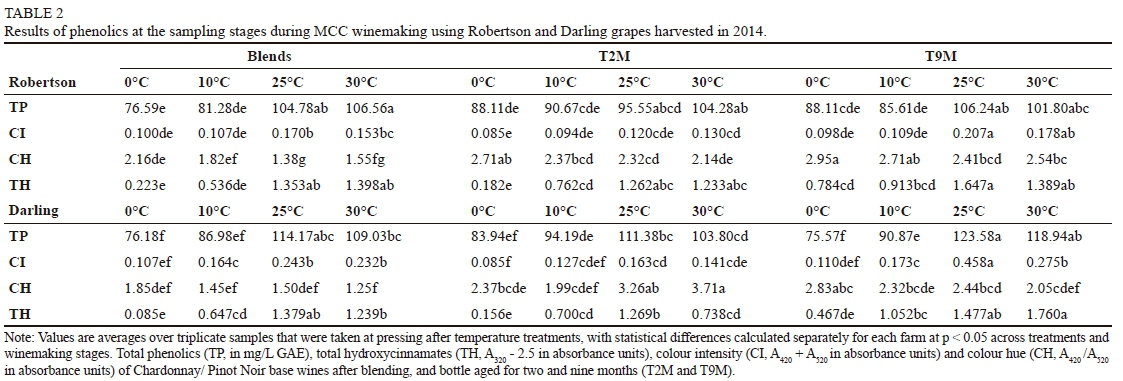
Since the hydroxycinnamates were shown to be the highest contributors to the TP and play a role in the stability and evolution of TSW (Ibern-Gómez et al., 2000), the total hydroxycinnamates (TH) were measured (at 320 nm)
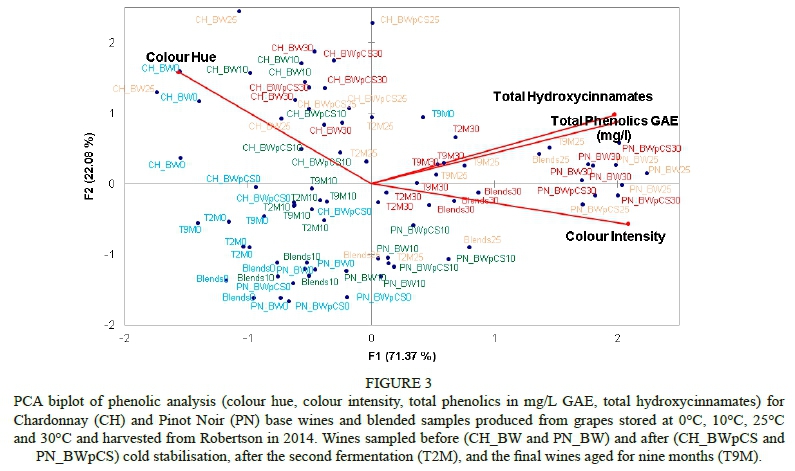
The first two components of the PCA explained the variance in the phenolic data of the wines from both Robertson (Fig. 3, 93%) and Darling (Fig. B1, 86%). The treatments at higher temperatures (25°C and 30°C) grouped together, and so did the treatments at lower temperatures (0°C and 10°C), with good repeatability between the biological repeats. From the blended base wines to the final MCCs, the higher temperature treatments were significantly higher in TP, CI and TH compared to the lower temperature treatments (Table 2). The total phenol content was lower than the 176 to 195 mg/L GAE range reported for champagne in the literature (Chamkha et al., 2003). The hue of the lower temperature treatments was higher than that of the higher temperature treatments throughout all sampling stages, due to its lower absorption at 520 nm caused by less phenolic extraction from the Pinot Noir grapes stored at lower temperatures. From the blended base wines to the final MCCs there were no statistically significant differences in the total phenolics (Table 2), similar to the findings from the study by Gil-Muñoz et al. (1999). Prior to blending, the Pinot Noir base wines had the same grouping according to temperature, as mentioned previously, but the Chardonnay samples did not (Table B1). No consistent patterns were observed in the Chardonnay phenolic measurements in relation to the treatments. There was a statistically significant increase in the CH from the base wine blends to the final wine (T9M) in the 2014 samples (Table 2), implying a loss of absorption at 520 nm, which may have been due to the adsorption of anthocyanins to yeast cell walls (Vasserot et al., 1997).
Phenolic analysis of 2015 vintage
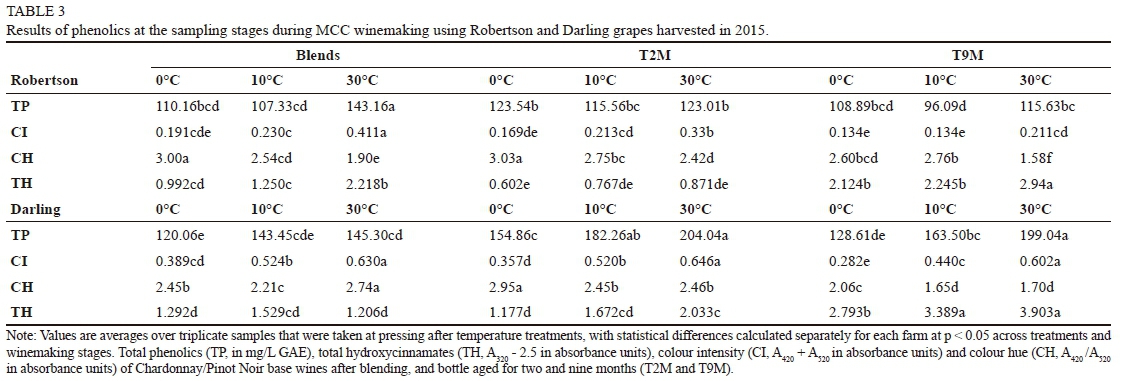
The same patterns as for the 2014 data were observed for 2015, but the second vintage had higher phenolic levels (Tables 3 and B2, Fig. 3). The variation between the remaining three treatments in the 2015 phenolics data of Robertson (Fig. B2, 86%) and Darling (Fig. 4, 81%) was yet again due to the treatments. The 30°C treatments again had higher TP, CI, and TH than the treatments at lower temperatures (0°C and 10°C). With the exclusion of the 25°C treatments, the data showed a gradual increase in TP, CI and TH and a decrease in CH with greater temperature. The average total phenol content was lower than the range (176 mg/L to 195 mg/L GAE) found in the literature (Chamkha et al., 2003), but higher than in 2014.
The Chardonnay base wines again had significantly higher CH levels than the Pinot Noir base wines due to the absorbance at 520 nm. Unlike the 2014 data, the Chardonnay base wines of 2015 were affected by the treatments and hence had the same patterns in phenolics as the samples after blending, i.e. an increase in TP, TH and CI with higher temperature treatments.
There was a statistically significant decrease in the CH from blends to T9M in the 2015 samples (Table 3), which is the opposite of what was observed in 2014. This decrease in CH may have been due to increased absorbance at 420 nm, implying browning of the wine. Browning was not investigated in this study, but it has previously been investigated in the ageing on lees of cava (Ibern-Gómez et al., 2000). The total phenolics and total hydroxycinnamates were higher in 2015 than in the 2014 samples. Hydroxycinnamates oxidise more than other phenolics and are the major component of the phenolic content of TSW (Ibern-Gómez et al., 2000; Chamkha et al., 2003). Although measured only indirectly through colour hue, browning in the 2014 samples may not have occurred due to the lower phenolic content.
There were no significant differences in phenolics from the blends to the final MCCs (Fig. 4, Table 3) for both vintages, similar to what has been found in the literature on cava (Gil-Muñoz et al., 1999), but different to studies on champagne (Stefenon et al., 2013) and Spanish TSW (Martínez-Lapuente et al., 2013), which found a decrease in phenolics after the second fermentation. It has previously been shown that the higher the temperature, the greater the phenolic extraction in dried grape pomace at between 25°C and 60°C (Spigno et al., 2007).
As mentioned previously, grapes stored at 25°C and 30°C had a higher berry sugar concentration (Table 1) than grapes stored at 0°C and 10°C. If the hypothesis is that this may have been due to the activity of native yeast species converting the sugar to ethanol, then this means that the chemical environment resulted in greater phenolic extraction from the berries due to greater solubility. It may have also been due to greater enzyme activity at higher temperatures, which in turn leads to cells breaking and the subsequent extraction of phenolics into the juice (Roubelakis-Angelakis & Kliewer, 1986).
CONCLUSIONS
This study showed that the temperature of grapes at pressing, achieved through overnight storage, has an effect on the extraction of phenolics. Grapes stored at a lower temperature (0°C and 10°C) had a lower phenolic content than grapes stored at higher temperatures (25°C and 30°C) for both vintages. The high storage temperatures (25°C and 30°C) allowed for better extraction of the phenolics into the juice. The total phenolics, colour intensity and total hydroxycinnamates were higher in wines made from grapes stored at higher temperatures. Hence, there is greater extraction of phenolics at higher temperature than at lower temperatures, which is not desired by TSW winemakers. Similar to what was found in a study on champagne, the phenolic content did not change throughout winemaking, showing the stability of the phenolics during TSW winemaking. The phenolic levels reported here are lower than in champagne and were stable throughout winemaking. South African MCC winemakers may not need to chill grapes before processing, but may do so in the case of lower quality grapes or grapes harvested from warm climatic regions in order to ensure smoother processing of the wines. It would be of great advantage to have a control experiment in which MCCs are made from grapes that were processed immediately after harvest to compare to results with MCCs from treated grapes. An investigation into the influence of phenolics on the browning of MCCs and sensory differences due to this would be of great interest.
LITERATURE CITED
Andrés-Lacueva, C., López-Tamames, E., Lamuela-Raventós, R.M., Buxaderas, S. & De la Torre-Boronat, M.C., 1996. Characteristics of sparkling base wines affecting foam behavior. J. Agric. Food Chem. 44, 989-995. [ Links ]
Chamkha, M., Cathala, B., Cheynier, V. & Douillar, B., 2003. Phenolic composition of champagnes from chardonnay and pinot noir vintages. J. Agric. Food Chem. 51, 3179-3184. [ Links ]
Fernandéz de Simon, B., Pérez-Ilzarbe, J., Hernández, T., Gómez-Cordovés, C. & Estrella, I., 1992. Importance of phenolic compounds for the characterization of fruit juices. J. Agric. Food Chem. 40, 1531-1535. [ Links ]
Ganss, S., Kirsch, F., Winterhalter, P., Fischer, U. & Schmarr, H.G., 2011. Aroma changes due to second fermentation and glycosylated precursors in Chardonnay and Riesling sparkling wines. J. Agric. Food Chem. 59, 2524-2533. [ Links ]
Gil-Muñoz, R., Gómez-Plaza, E., Martínez, A. & López-Roca, J.M., 1999. Evolution of phenolic compounds during wine fermentation and postfermentation: Influence of grape temperature. J. Food Comp. Anal. 12, 259-272. [ Links ]
Ibern-Gómez, M., Fernandé-Lacueva, C., Lamuela-Raventós, R.M., Buxaderas, S., Singleton, V.L. & De la Torre-Boronat, M.C., 2000. Browning of cava (sparkling wine) during aging in contact with lees due to the phenolic composition. Am. J. Enol. Vitic. 51, 29-36. [ Links ]
Kerslake, F.L., Jones, J.E., Close, D.C. & Dambergs, R.G., 2013. Bunch exposure effects on the quality of Pinot noir and Chardonnay fruit and base wines for cool climate sparkling wine production. Presented at the Ciência e Técnica Vitivinícola, Proc. 18th Intern. Symp. GiESCO, July 2013, Porto, Portugal. pp. 471 - 477. [ Links ]
Mafata, M., 2017. The effect of grape temperature on the phenolic extraction and sensory perception of Méthode Cap Classique wines. Thesis, Stellenbosch University, Private Bag X1, 7602 Matieland (Stellenbosch), South Africa. [ Links ]
Martínez-Lapuente, L., Guadalupe, Z., Ayestarán, B., Ortega-Heras, M. & Pérez-Magariño, S., 2013. Sparkling wines from alternative red and white varieties. Am. J. Enol. Vitic. 64(1), 39-49. [ Links ]
Monagas, M., Bartolomé, B. & Gómez-Cordovés, C., 2005. Updated knowledge about the presence of phenolic compounds in wine. Cr. Rev. Food Sci. Nutr. 45, 85-118. [ Links ]
Pozo-Bayón, M.A., Hernández, M.T., Martín-Álvarez, P.J. & Polo, M.C., 2003. Study of low molecular weight phenolic compounds during the aging of sparkling wines manufactured with red and white grape varieties. J. Agric. Food Chem. 51, 2089-2095. [ Links ]
Ribéreau-Gayon, P., 1982. The anthocyanins of grapes and wines. In: Markakis, P. (ed). Anthocyanins as food colors. Academic Press, New York. pp. 209 - 244. [ Links ]
Roubelakis-Angelakis, K.A. & Kliewer, W.M., 1986. Effects of exogenous factors on phenylalanine ammonia-lyase activity and accumulation of anthocyanins and total phenolics in grape berries. Am. J. Enol. Vitic. 37, 275-280. [ Links ]
Singleton, V.L. & Trousdale, E., 1983. White wine phenolics: Varietal and processing differences as shown by HPLC. Am. J. Enol. Vitic. 34, 37-34. [ Links ]
Somers, T.C. & Ziemelis, G., 1985. Spectral evaluation of total phenolic components in Vitis vinifera: Grapes and wines. J. Sci. Food Agric. 36, 1275-1284. [ Links ]
Spigno, G., Tramelli, L. & De Faveri, D.M., 2007. Effects of extraction time, temperature and solvent on concentration and antioxidant activity of grape marc phenolics. J. Food Eng. 81(1), 200-208. [ Links ]
Stefenon, C.A., Bonesi, C. de M., Marzarotto, V., Barnabé, D., Spinelli, F.R., Webber, V. & Vanderlinde, R., 2014. Phenolic composition and antioxidant activity in sparkling wines: Modulation by the ageing on lees. Food Chem. 145, 292-299. [ Links ]
Vahl, J.M. & Converse, J.E., 1980. Ripper procedure for determining sulphur dioxide in Wine: Collaborative study. J. Assoc. Off. Anal. Chem. 63, 194-199. [ Links ]
Vasserot, Y., Caillet, S. & Maujean, A., 1997. Study of anthocyanin adsorption by yeast lees. Effect of some physicochemical parameters. Am. J. Enol. Vitic. 48, 433-437. [ Links ]
Zoecklein, B., 2002. A review of méthode champenoise production. Virginia Cooperative Extension, Publication No. 463-017. [ Links ]
Submitted for publication: September 2017
Accepted for publication: November 2017
Acknowledgments: The authors wish to thank the Groote Post, Graham Beck and Charles Fox farms, as well as winemakers Mr Pieter Ferreira, Mr Hannes Meyer and Mr Craig Paulsen, without whom this project would not have been possible.
* Corresponding author: E-mail address: Vjaarsveldf@arc.agric.za

