


Services on Demand
Article
 English (pdf)
 Article in xml format
 Article references
Indicators

Related links
-
 Cited by Google
 -
 Similars in Google
Share

 Permalink
South African Journal of Enology and Viticulture
On-line version ISSN 2224-7904
Print version ISSN 0253-939X
S. Afr. J. Enol. Vitic. vol.38 n.2 Stellenbosch 2017
http://dx.doi.org/10.21548/38-2-2079
ORIGINAL RESEARCH ARTICLES
Application of volatile compound analysis for distinguishing between red wines from Poland and from other European countries
A. StójI, * ; T. CzerneckiI; D. DomagalaII; Z. TargońskiI
IDepartment of Biotechnology, Human Nutrition and Food Commodity Science, Faculty of Food Sciences and Biotechnology, University of Life Sciences, Skromna 8, 20-704 Lublin, Poland
IIDepartment of Applied Mathematics and Computer Science, Faculty of Production Engineering, University of Life Sciences, Gleboka 28, 20-612 Lublin, Poland
ABSTRACT
Authenticity and the geographical origin of wines are terms of great importance for consumers and producers. This work is focused on distinguishing between red wines from Poland and from other European countries, notably France, Italy and Spain. To achieve this goal, we determined aroma compounds in wines from different countries by headspace solid-phase microextraction/gas chromatography-mass spectrometry. The content of hexan-1-ol in Polish wines was significantly higher (about twice as high) than in French, Italian and Spanish wines. Linear discriminant analysis (LDA) showed that 3-(methylsulfanyl) propane-1-ol, hexan-1-ol, ethyl phenylacetate and ethyl 2-hydroxy-4-methylpentanoate were the most discriminant variables for distinguishing between wines from Poland and from other European countries. Hierarchical cluster analysis (HCA) revealed that Polish wines were separated thoroughly from the other wines based on ethyl phenylacetate, hexan-1-ol, ethyl 2-hydroxy-4-methylpentanoate, (E)-3-hexen-1-ol, 2-phenylethanol and 3-(methylsulfanyl)propan-1-ol, which is important for preventing possible frauds.
Key words: Aroma compounds, HS-SPME, GC-MS, Polish red wines, geographical origin, authenticity
INTRODUCTION
A significant increase in viticulture and winemaking has been observed in Poland in recent years, mainly due to numerous changes in the European regulations and in complementary Polish legislation. The most crucial change for Poland was the inclusion of the country in the coldest A zone of viticulture in 2005. Moreover, amendments to the 2008 regulations set smaller producers of wine in Poland (less than 1000 hl per annum) free from warehouse taxation. Despite the cold climate in Poland, it is possible to produce high-quality wines from grape varieties that are more resistant to frost and adapted to the Polish climate. The most commonly grown red grape varieties are Regent, Rondo and Pinot Noir (Wilk, 2011). Rondo and Regent, both new grape varieties originally from Germany, are known as multispecies hybrids. The hybrids were obtained by crossing two or three species of Vitis, Zarya severa x Saint Laurent and (Silvaner x Mueller Thurgau) x Chambourcin, respectively. Pinot Noir is an old French variety (http://www.vivc.de/). Grapevine cultivation and winemaking take place in certain regions, mainly in western and south-eastern parts of Poland (Jelen et al., 2011).
Aroma compounds belong to several chemical classes, such as alcohols, esters, acids, aldehydes, ketones, terpenes and others. There are hundreds of volatile compounds in wines. Aroma formation is influenced by several factors: grape variety, climate, soil, region, cultivation, yeast, oenological techniques and ageing (Du et al., 2012; Coetzee & Du Toit, 2015).
Solid phase microextraction (SPME) has largely been used for the extraction of aroma compounds in recent years. Compared to traditional techniques, like liquid-liquid extraction (LLE) and solid-phase extraction (SPE), it offers many advantages, such as simplicity, high sensitivity and repro-ducibility, does not require solvents and needs low sample volumes. Moreover, it is fast, inexpensive and can easily be automated (Welke et al., 2012a). This technique was developed by Pawliszyn and co-workers in 1989 (Marengo et al., 2001). In the SPME, an immobilised stationary phase in the form of fibre is immersed directly in the liquid sample (direct immersion, DI) or is exposed in the headspace above the sample (headspace, HS). The headspace extraction technique (HS-SPME) is used almost exclusively because of the specificity of wine matrices - presence of sugars, proteins, lipids and others compounds (Jelen et al., 2012). The polydimethylosiloxane (PDMS) and polyacrylate (PA) coatings extract analytes via absorption, while polydimeth-ylosiloxane-divinylbenzene (PDMS/DVB), carboxen-poly-dimethylosiloxane (CAR/PDMS) and divinylbenzene-car-boxen-polydimethylosiloxane (DVB/CAR/PDMS) do so via adsorption. Initially, analyte molecules get attached to the fibre surface. Whether they migrate to the bulk of the fibre or remain on its surface depends on the magnitude of the analyte diffusion coefficient in the fibre (Cámara et al., 2006; Metafa & Economou, 2013).The SPME is usually combined with gas chromatography and mass spectrometry (GC-MS) for the analysis of aroma compounds in wines (Goldner et al., 2011; Trani et al., 2016).
Multivariate analysis techniques are employed for data processing and enable the classification of wines according to their geographical origin. Linear discriminant analysis (LDA) and hierarchical cluster analysis (HCA) are frequently applied for this purpose (Marengo et al., 2001; Jurado et al., 2008; Zióhkowska et al., 2016). In LDA, a classification model is built step by step; at each step, all variables are revised and the most discriminant variable is selected. Then the variable is included and the processing re-starts. This technique maximises the variance between categories and minimises the variance within the category. In turn, HCA evaluates similarity between objects based on their distances in n-dimensional space. The objects are aggregated according to similarity. The cluster describes a group of objects that are more similar to each other than to objects outside the group (Cabredo-Pinillos et al., 2008; Jurado et al., 2008).
Authenticity and the geographical origin of wines are very important for consumers and wine producers. The characterisation and classification of wines protect consumers from illegal procedures and eliminate unfair producers (Stój, 2011). The analysis of volatile compounds combined with statistical techniques is often used as a tool for the identification of the geographical origin of wines. Several studies have focused on the discrimination of wines from different regions and grape varieties within one country and among countries based on aroma compounds. Jurado et al. (2008) and Sáenz et al. (2010) correctly differentiated wines from several Spanish denominations of origin. Römisch et al. (2009) found that it was easy to discriminate South African wines from East European wines, but the separation of wines between Hungary, the Czech Republic and Romania was more difficult because of the small geographical distances between these countries. Zióhkowska et al. (2016) differentiated white and red wines according to grape variety and geographical origin, and reported that discrimination was much worse when SPME-GC-MS rather than SPME-MS data were used. Perestrelo et al. (2014) observed two clearly defined clusters: a group constituted of wines from Madeira Island and another one consisting of wines from the Azores and Canary Island, which are located close to each other. Zhang et al. (2013) successfully characterised the differences in aroma and sensory composition of Merlot wines from different geographic origins in China.
To date, no studies have been done on Polish red wines in the context of their authenticity, identification of wine area, and discrimination between Polish wines and those produced in other countries. Each wine-producing country has some defined "wine regions", characterised by a rather homogeneous climate and soil characteristics, and by the presence of dominant varieties and typical wines (Römisch et al., 2009). This work is focused on distinguishing between red wines from Poland and from other European countries, regardless of the growing region, grape variety and winemaking techniques in the countries. Italy, France and Spain are the largest producers of wine in the world, while Poland is a country with only marginal production on a global scale. The relatively high price of Polish wines can create an environment in which wines originating from other countries will be sold under a Polish brand. In this study, we determined aroma compounds in wines from different countries by means of HS-SPME/GC-MS and processed data using the LDA and HCA techniques.
MATERIALS AND METHODS
Wine samples
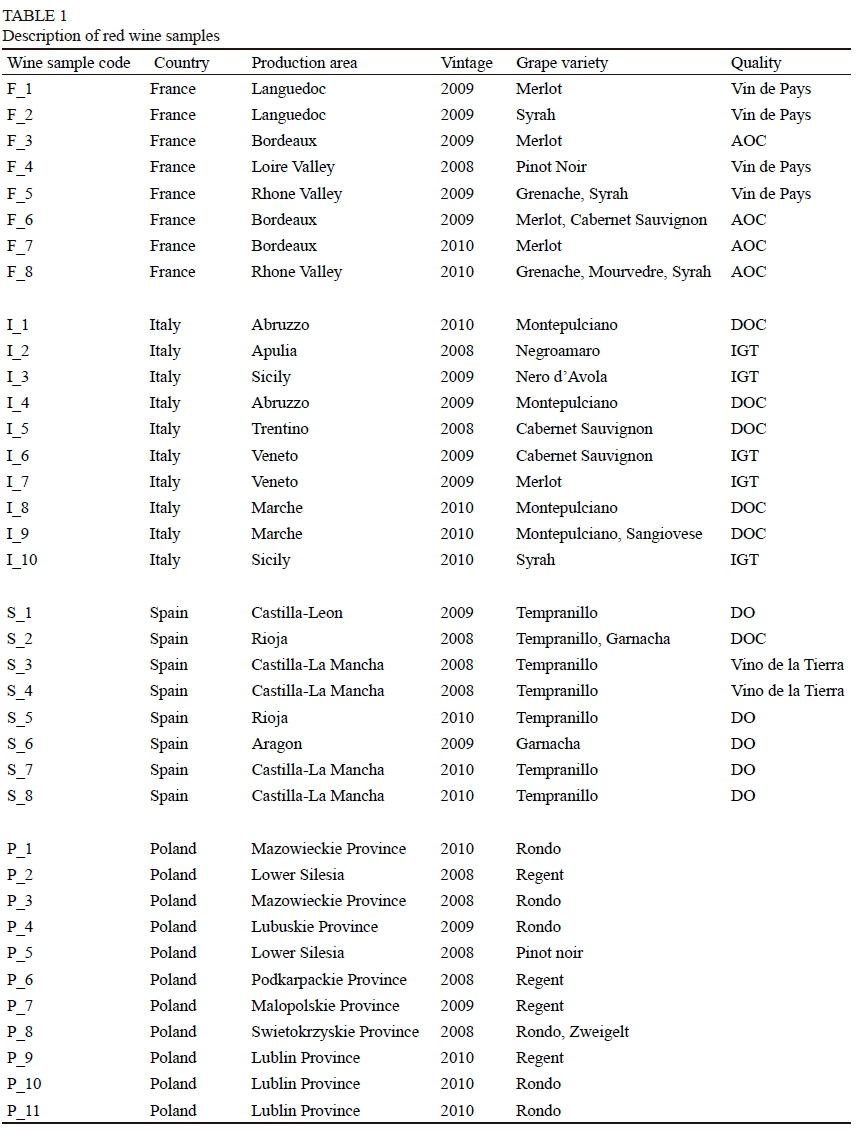
The method was applied to 37 commercial red wines originating from different countries: France (eight samples), Italy (10 samples), Spain (eight samples) and Poland (11 samples). The wines of the 2008, 2009 and 2010 vintages were produced in different regions in the countries from various varieties of Vitis vinifera. Details of the wines are shown in Table 1. All wines were bottled at the place of production. To protect proprietary interests, winery identities are not reported. The wines were selected in consultation with wine experts with the aim to obtain wine representative of each region. French, Italian and Spanish wines had a denomination of origin or were regional wines. In Poland there were no indications of the wine quality of the 2008, 2009 and 2010 vintages.
Chemicals
All chemicals used were of analytical grade. Sodium chloride and hydrochloric acid were purchased from POCh Company (Gliwice, Poland). Sodium chloride was oven dried overnight at 200°C before use. Hydrochloric acid was previously dissolved in water at a concentration of 78 g/L. The internal standard, 4-hydroxy-4-methyl-2-pentanone, was obtained from Sigma-Aldrich Company (Poznan, Poland). The internal standard was previously prepared in water at a concentration of 7 mg/L. A mixture of n-alkanes (C7 to C30) for the calculation of the linear retention indices (LTPRI) was supplied by Supelco (Bellefonte PA, USA).
HS-SPME
A fibre holder and four types of fibres were used: 85 μm polyacrylate (PA), 85 μm carboxen-polydimethylosiloxane (CAR/PDMS),65μmpolydimethylosiloxane-divinylbenzene (PDMS/ DVB) and 50/30 divinylbenzene-carboxen-polydimethylosiloxane (DVB/CAR/PDMS) (Supelco, Bellefonte PA, USA). The fibres were preconditioned according to the manufacturer's specifications. The following were placed in a 7 mL glass vial: 0.9 g of NaCl, 3 mL of wine, 50 μL of HCl, 100 μL of 4-hydroxy-4-methyl-2-pentanone (as internal standard) and a magnetic stirring bar. The vial was tightly capped with a PTFE-silicone septum (Supelco, Bellefonte PA, USA). The wine sample was incubated at 29°C for 10 min under continuous stirring at 400 rpm prior to extraction. The fibres were exposed to the headspace (HS) at 29°C for 30 min under continuous stirring. All wines were extracted in triplicate. After extraction, the fibres were removed from the vial and thermally desorbed in the GC injection port for 2 min at 200°C, in splitless mode. Prior to each analysis, the fibres were cleaned by inserting them into the auxiliary GC injection port for 5 min at an appropriate temperature for each fibre. All wines were injected three times using one injection per vial.
GC/MS
The samples were analysed using a GCMS-QP2010 gas chromatograph coupled to a quadrupole mass spectrometer (Shimadzu, Kyoto, Japan). Chromatographic separations were done by using a CP-WAX 57CB capillary column with the following characteristics: 25 m, 0.32 mm ID x 0.2 μπι film thickness, 100% polyethylene glycol (Agilent, Santa Clara CA, USA). The carrier gas was helium at a flow rate of 1.8 mL/min. The column oven temperature program was: initial temperature 38°C for 6 min, 38°C to 102°C at a rate of 3°C/min, 102°C to 200°C at a rate of 7°C/min, then held for 3 min, and then 200°C to 210°C at a rate of 6°C/min, held for 1 min. The total run time was 47 min. An electron ionisation source was used, with a source temperature of 200°C and electron energy of 70 eV. Mass spectral data were collected over a range of 30 to 300 m/z in full scan mode (scan time 0.4 s). Data were acquired by using GCMSsolution software v. 2. The identification of volatile compounds was achieved on the basis of their mass spectra and linear retention index. Mass spectrometric information of each chromatographic peak was compared to the NIST 05 mass spectral library. A mixture of n-alkanes (C7 to C30) diluted in hexane (Supelco, Bellefonte PA, USA) was loaded onto the SPME fibre and injected under the above temperature program to calculate the linear temperature-programmed retention indices (LTPRI) of each extracted compound. Experimental LTPRI were compared to retention indices reported in the literature. Semi-quantitative data on the aroma compounds were calculated by relating the peak area of volatiles to that of the internal standard. The concentration of the volatiles was expressed as μg/L.
Statistical analysis
The data analysis was conducted using the Statistica 10.0 software package (StatSoft, Krakow, Poland). Analysis of variance (ANOVA) was applied to test if there were any statistically significant differences between French, Italian, Spanish and Polish wines. The non-parametric Kruskal-Wallis test was applied for the compounds for which assumptions of analysis of variance were not fulfilled. Multiple comparisons were made in order to determine between which countries the differences were statistically significant. Linear discriminant analysis was conducted based on Wilk's lambda criterion to find volatile compounds that may be used to discriminate the four wine groups based on country of origin. Subsequently, the wines were classified based on the results of the discriminant analysis. In order to verify that the test wines could be divided into groups by taking into account the compounds selected in the discriminant analysis, hierarchical cluster analysis was performed as well. The wines were grouped using the Ward distance matrix formed on the basis of the Euclidean distance.
RESULTS AND DISCUSSION
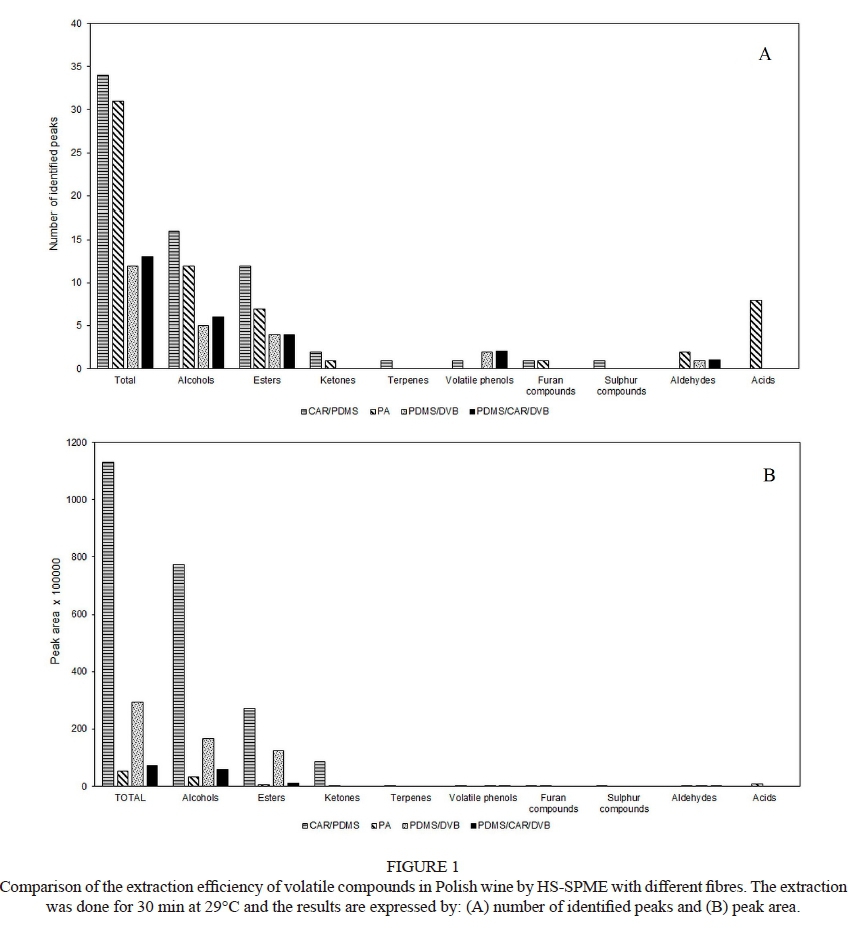
Volatile substances belong to several groups of chemical compounds differing mainly in terms of polarity. Four commercial SPME fibres differing in the polarity and thickness of the stationary phase were tested to find which fibre extracted as many volatile compounds as possible. The fibres were: 85 μm polyacrylate (PA), 85 μΓη carboxen-polydimethylosiloxane (CAR/PDMS), 65 μm polydimethylosiloxane-divinylbenzene (PDMS/DVB) and 50/30 divinylbenzene-carboxen-polydimethylosiloxane (DVB/CAR/PDMS). The results of the coating comparison under the same experimental conditions obtained for Polish wine of the Rondo variety (P_1) are shown in Fig. 1. Using CAR/PDMS coating, it was possible to achieve the largest number of identified chromatographic peaks (a total of 34 peaks: 16 alcohols, 12 esters, two ketones, one terpene, one volatile phenol, one furan compound and one sulphur compound) and their total chromatographic area. The PA coating extracted a large number of volatile compounds (31 volatile compounds), although the total peak area of these compounds presented the lowest values. Thus CAR/PDMS fibre was chosen for the analysis of aroma in the examined wines. Similarly, Jurado et al. (2008) and Burin et al. (2013) reported that CAR/PDMS fibre was the best option for the analysis of volatile compounds in wines. Furthermore, Rodrigues et al. (2008), Dziadas and Jelen (2010) and Welke et al. (2012a) found that CAR/PDMS fibre showed high extraction efficiency compared to others fibres.
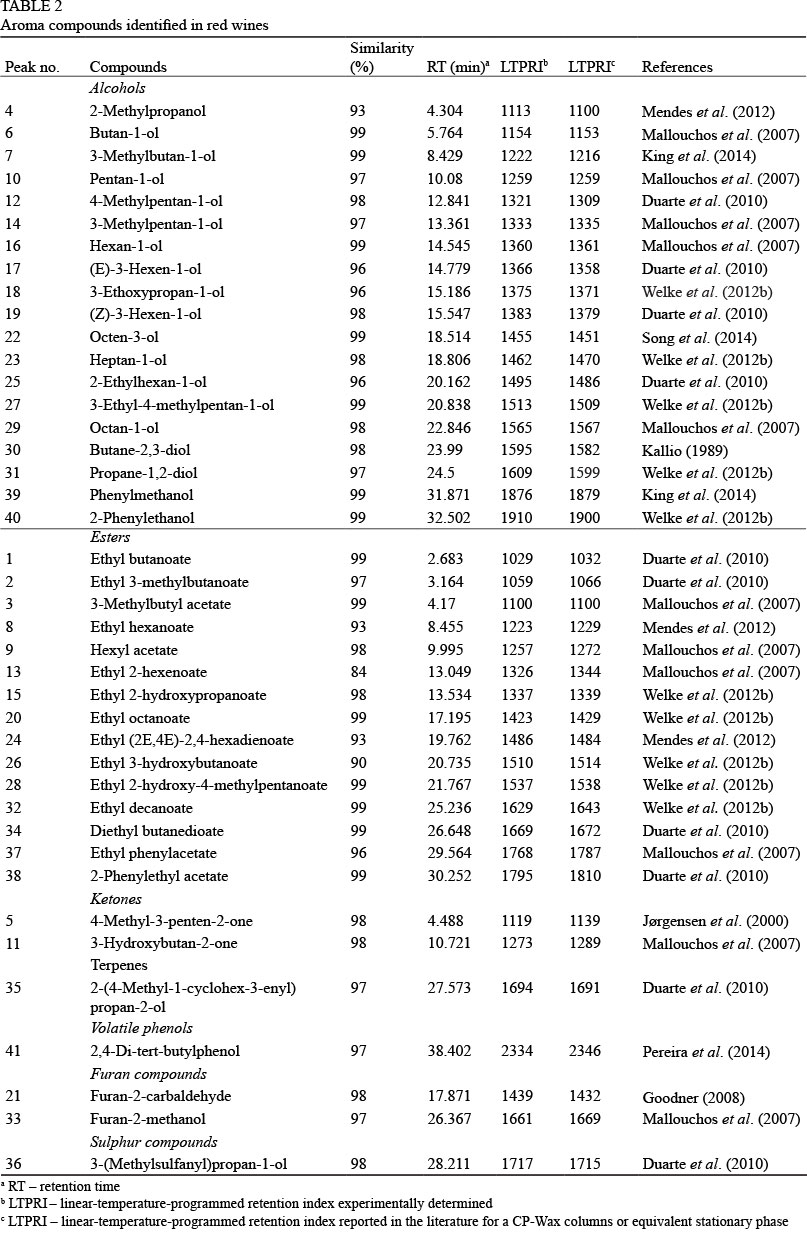
Volatile compounds identified in the wines on the basis of their mass spectra and linear retention index are listed in Table 2. Many researchers have used such tools for the identification of volatiles (Weldegergis et al., 2011; Sagratini et al., 2012; Dugo et al., 2014). Experimental mass spectra were compared with those stored in mass spectra libraries (e.g. that of the National Institute of Standards and Technologies, NIST), taking into account similarity. However, structurally related compounds give similar spectra, thus ambiguous identifications can be obtained. The retention indices provide complementary information to identify volatile compounds and are very useful in inter-laboratory comparisons because of their independence on operational conditions, except for the polarity of the stationary phase. This approach avoids the use of expensive and time-consuming procedures, in which identification is based on pure compounds. Moreover, complex samples like wines contain hundreds of volatiles, for which not all corresponding standards may be commercially available (Bianchi et al., 2007; Yan et al., 2015). In our study we considered a minimum similarity value of 80% when comparing experimental mass spectra with those from mass spectra library. Weldegergis et al. (2011), Dugo et al. (2014) and Sagratini et al. (2012) have assumed minimum similarity of 70%, 75% and 90% respectively. Dugo et al. (2014) reported that a similarity filter value of 75% was used to avoid the omission of low-concentration aroma compounds, which notably are characterised by reduced similarity matches. In our study, peaks were automatically deleted if differences among experimental retention indices and retention indices reported in the literature for CP-Wax columns or equivalent stationary phases exceeded ± 20 units. Bianchi et al. (2007) comment that differences in retention indices for volatiles in equivalent stationary phases may vary between 5 and 20 units when compounds with retention indices from 500 to 2 000 were considered; however, larger differences have been observed in the literature for the same aroma compounds.
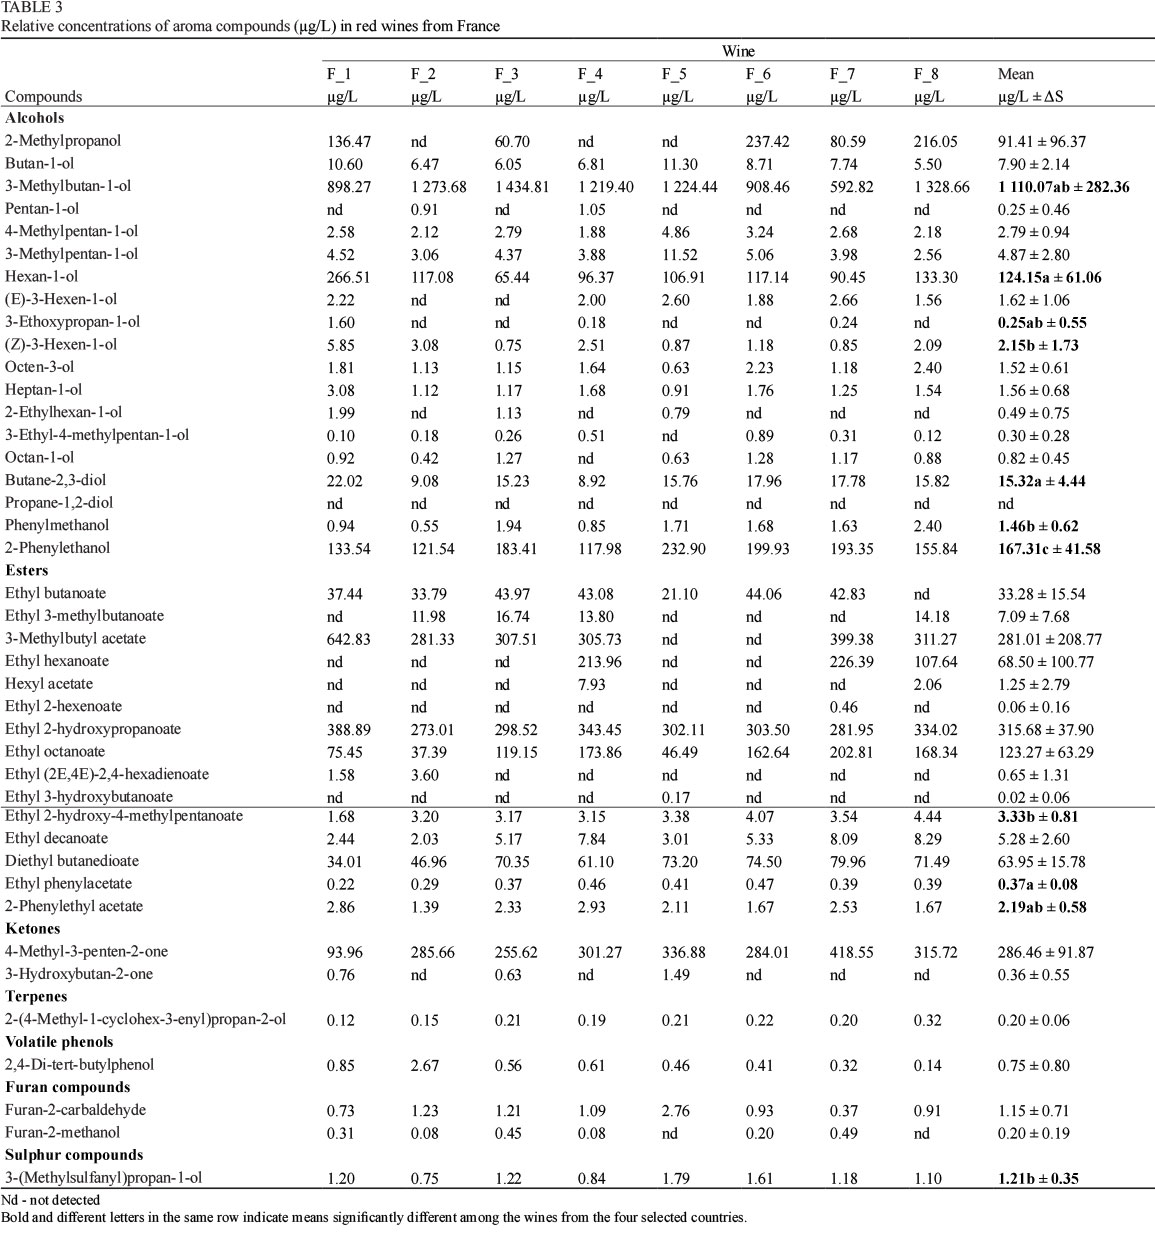
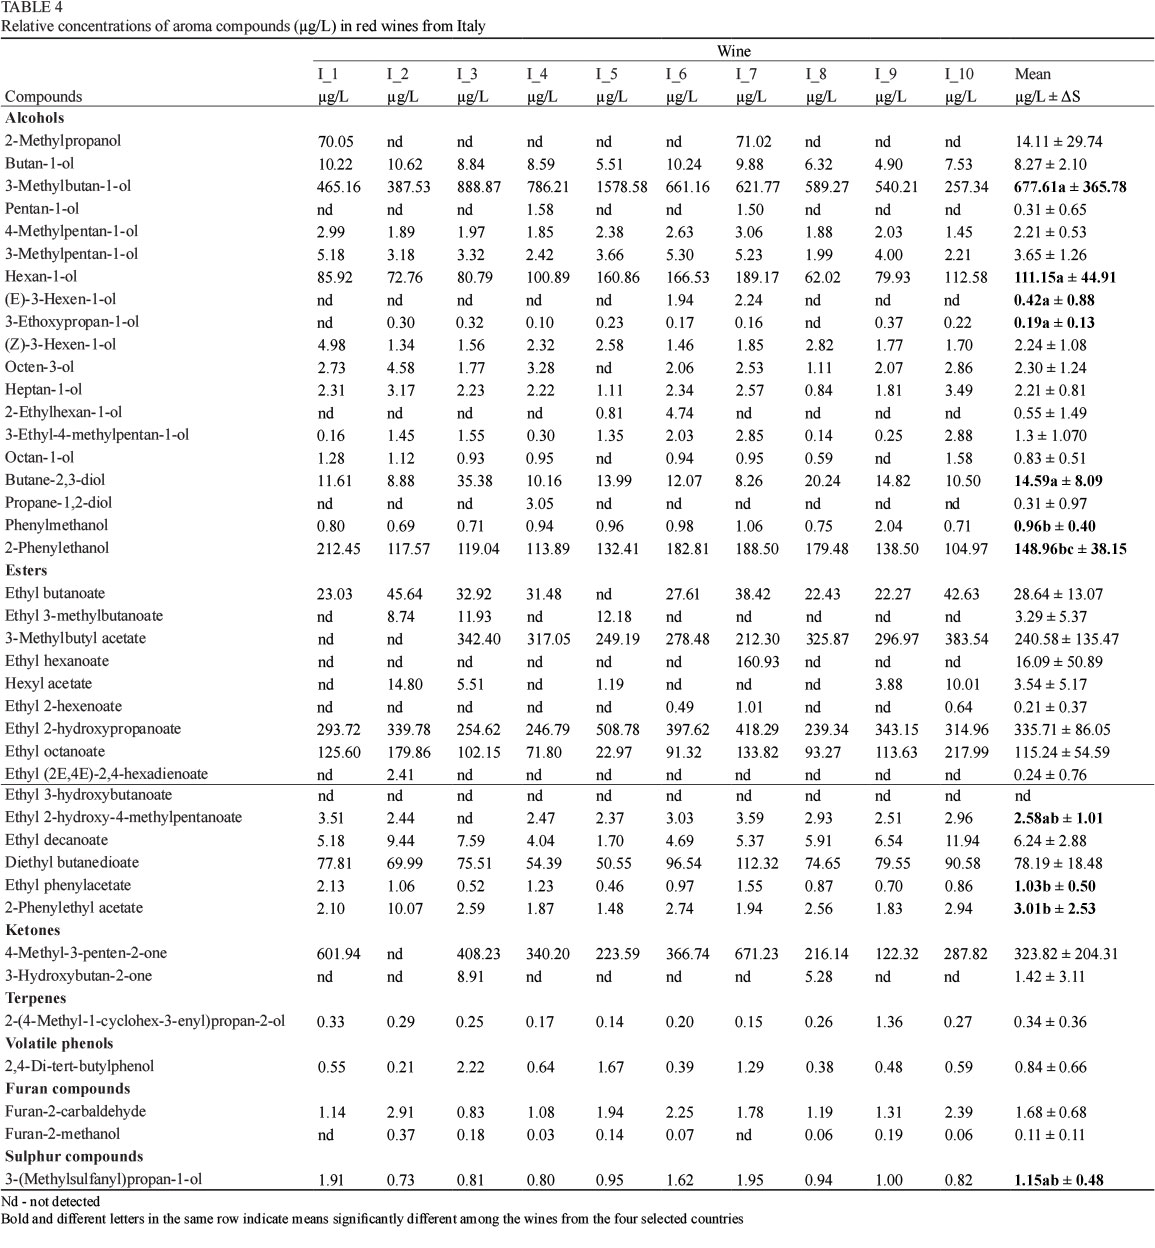
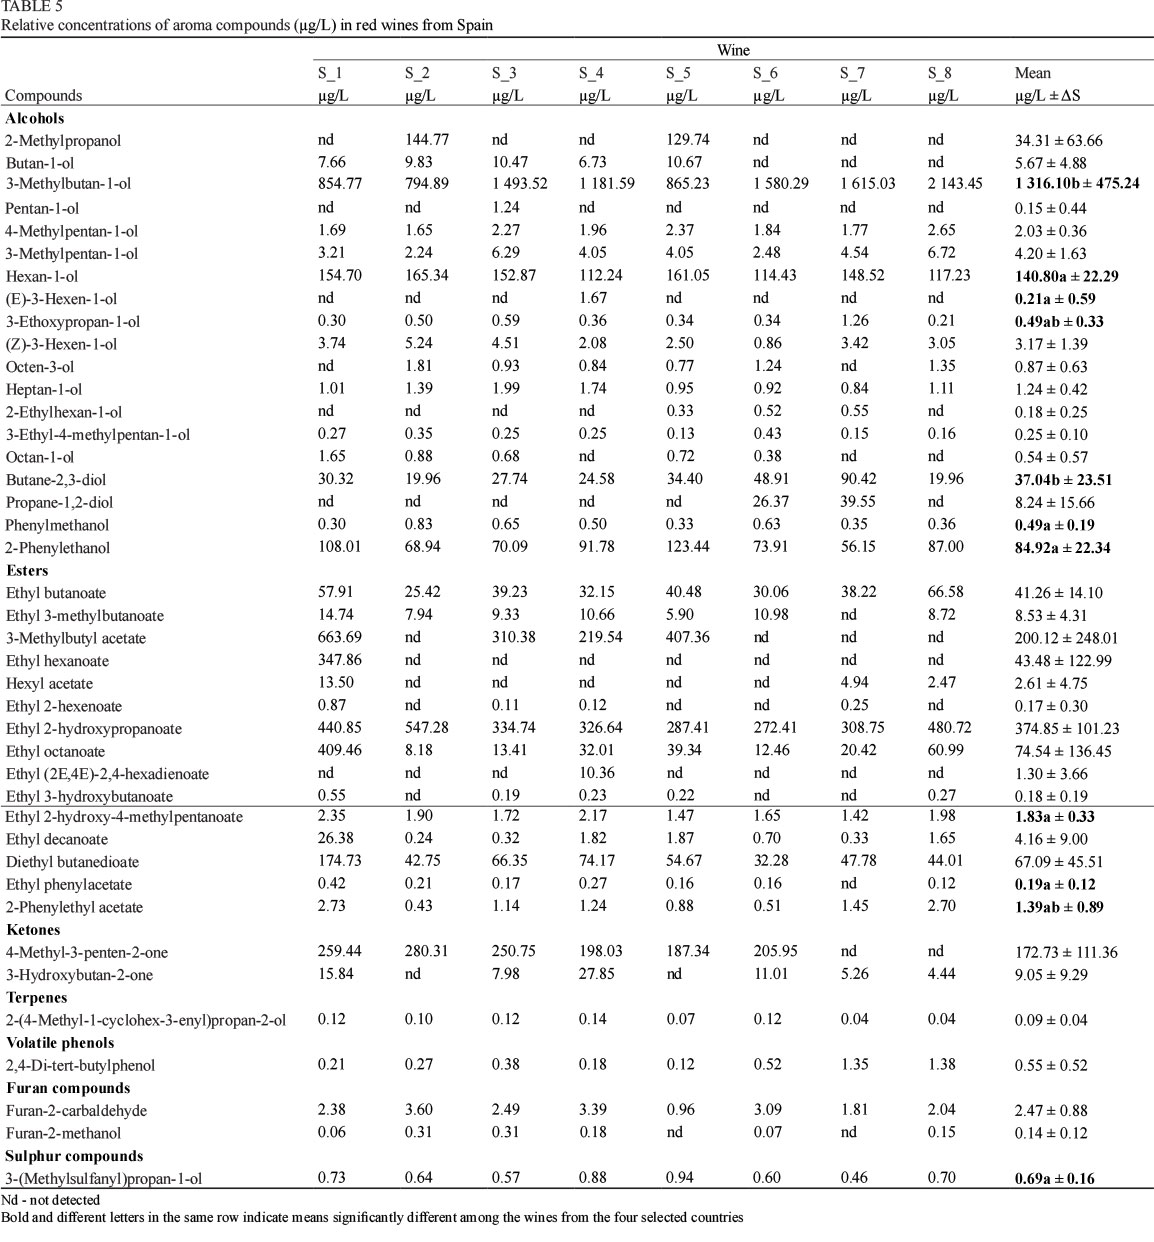
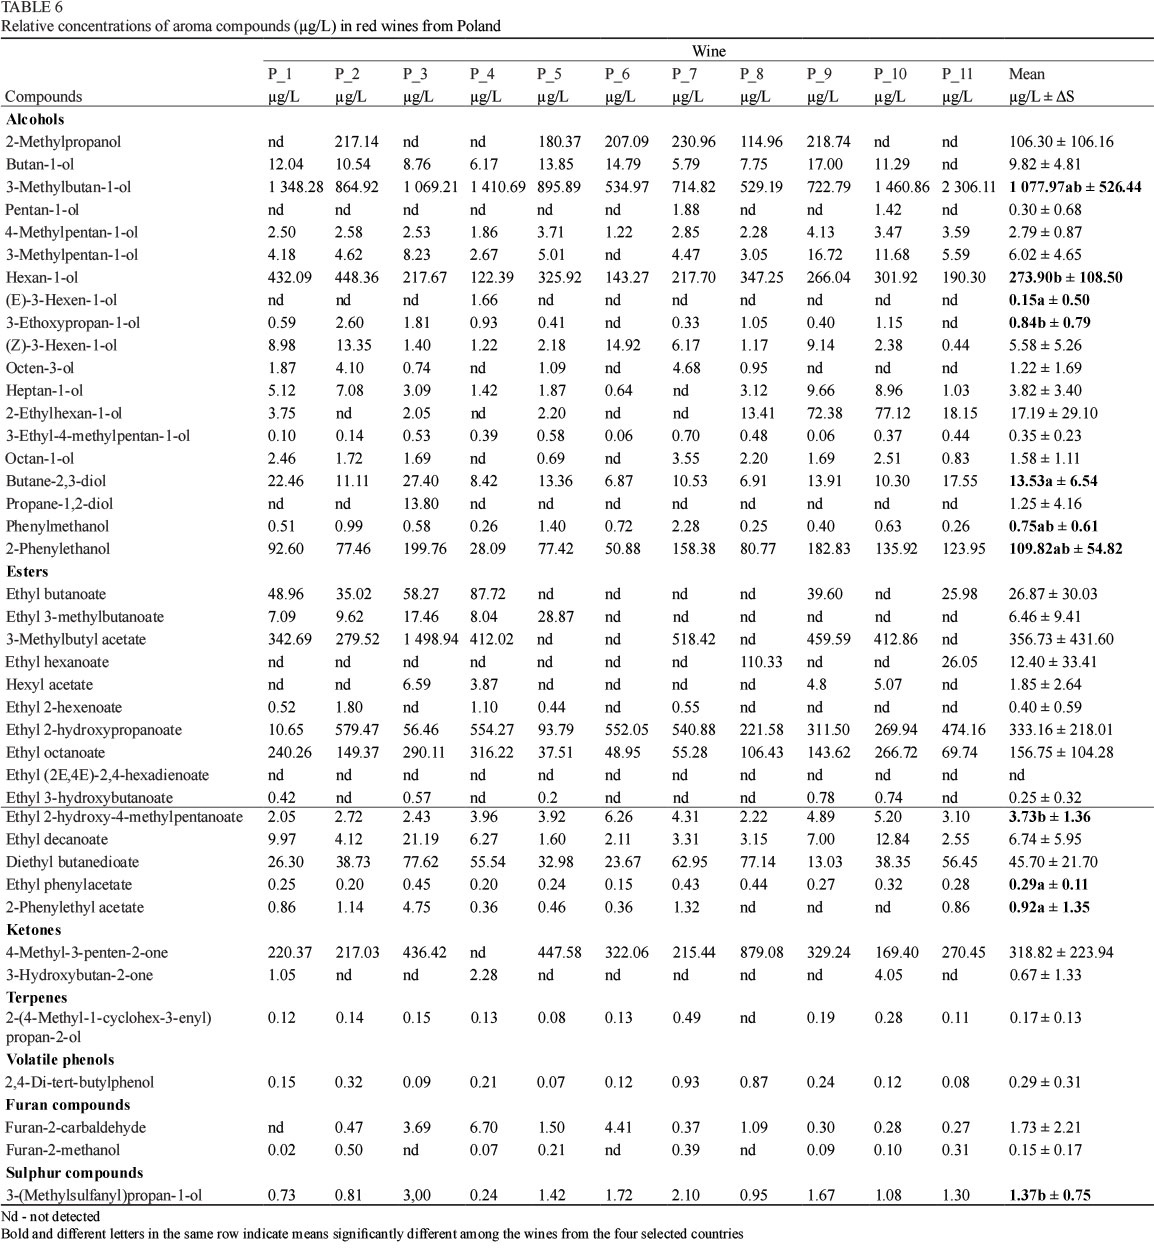
The relative concentrations of aroma compounds extracted using CAR/PDMS and determined by GC-MS in the French, Italian, Spanish and Polish wines are shown in Tables 3, 4, 5 and 6. The data have been arranged into seven chemical classes, with a total of 41 compounds identified and quantified (19 alcohols, 15 esters, two ketones, one terpene, one volatile phenol, two furan compounds, and one sulphur compound). The major volatiles were alcohols and esters in terms of number and concentration, while ketones, terpenes, volatile phenols, furan and sulphur compounds were the minor ones.
The most abundant alcohols identified in the wines from France were 3-methylbutan-1-ol (592.82 to 1434.81 μg/L), 2-phenylethanol (117.98 to 232.90 μg/L) and hexan-1-ol (65.44 to 266.51 μg/L) (Table 3). The lowest levels were showed by pentan-1-ol, 3-ethoxypropan-1-ol, 2-ethylhexan-1-ol, 3-ethyl-4-methylpentan-1-ol and octan-1-ol. Among the alcohols, propane-1,2-diol was not detected in any of the French wines. The ester fraction was composed mainly of two ethyl esters - ethyl 2-hydroxypropanoate (273.01 to 388.89 μg/L) and ethyl octanoate (37.39 to 202.81 μg/L), and one acetate ester - 3-methylbutyl acetate ("not detected" to 642.83 μg/L). The minor esters were: ethyl 2-hexenoate, ethyl (2E,4E)-2,4-hexadienoate, ethyl 3-hydroxybutanoate and ethyl phenylacetate. 4-Methyl-3-penten-2-one was the most abundant compound in the two detected ketones, and furan-2-carbaldehyde was the most abundant in the two detected furan compounds. In our work, three of the seven wines from France were of the Merlot variety (F_1, F_3 and F_7). Gamero et al. (2013) identified some the same volatile compounds in French red wines of the Merlot variety: (Z)-3-hexen-1-ol (cis-3-hexenol), phenylmethanol (benzyl alcohol) and furfural (furan-2-carbaldehyde), but did not report their concentrations. These authors focused on a comparison of the sensitivity of different extraction methods. Antalick et al. (2014) reported that ethyl octanoate was the most abundant ethyl ester in red wines from France, and ethyl hexanoate the second one. Similarly, 3-methylbutyl acetate had the highest concentration among the acetate esters. In contrast, the concentration of ethyl decanoate was one of the highest among the volatile compounds.
The alcohols found in appreciable concentrations in the wines from Italy were 3-methylbutan-1-ol (257.34 to 1578.58 μg/L), 2-phenylethanol (104.97 to 212.45 μg/L) and hexan-1-ol (62.02 to 189.17 μg/L) (Table 4). The lowest concentrations characterised were pentan-1-ol, (E)-3-hexen-1-ol, 3-ethoxypropan-1-ol, 2-ethylhexan-1-ol, octan-1-ol and propane-1,2-diol. The major esters were ethyl 2-hydroxypropanoate (239.34 to 508.78 μg/L), 3-methylbutyl acetate ("not detected" to 383.54 μg/L) and ethyl octanoate (22.97 to 217.99 μg/L), while minor ones were ethyl 2-hexenoate and ethyl (2E,4E)-2,4-hexadienoate. Ethyl 3-hydroxybutanoate was not detected in any of the wine from Italy. The 4-methyl-3-penten-2-one and furan-2-carbaldehyde showed higher contents in the ketones and furan compounds respectively. In this study, we did not find 2-methylpropanol in wine of the Negroamaro variety (I_2), whereas Tufariello et al. (2012) reported that 2-methylpropanol was present in Negroamaro wines at higher concentrations among the alcohols, besides 2+3-methylbutan-1-ol, 2-phenylethanol and hexan-1-ol. Otherwise, the above research determined monoethyl butanedioate, ethyl 2-hydroxypropanoate and diethyl butanedioate as major esters, while ethyl octanoate was not detected or detected in negligible amounts. The 3-methylbutyl acetate was not present in wine I_2, but was detected in the Negroamaro wines examined by Tufariello et al. (2012). The only sulphur compound found in wine I_2 was 3-(methylsulfanyl)propan-1-ol (methional), which is in agreement with the results reported by Tufariello et al. (2012). Montepulciano wines from Abruzzo (I_1, I_4) and Montepulciano wine from Marches (I_8) contained 1-hexanol at higher concentrations, while Sagratini et al. (2012) found low concentrations of 1-hexanol in Montepulciano wines from the Marches region and trace concentrations of this alcohol in Montepulciano wines from the Abruzzo region. We did not detect ethyl hexanoate in the Montepulciano wines from the two regions, although Sagratini et al. (2012) reported that ethyl hexanoate was one of the major ester after ethyl octanoate and ethyl decanoate.
The dominating alcohols in the wines from Spain were 3-methylbutan-1-ol (794.89 to 2143.45 pg/L), hexan-1-ol (112.24 to 165.34 pg/L) and 2-phenylethanol (56.15 to 123.44 pg/L) (Table 5). The lowest levels of alcohols were pentan-1-ol, (E)-3-hexen-1-ol, 3-ethoxypropan-1-ol, octen-3-ol, 2-ethylhexan-1-ol, 3-ethyl-4-methylpentan-1-ol, octan-1-ol and phenylmethanol. Ethyl 2-hydroxypropanoate, 3-methylbutyl acetate and ethyl octanoate (272.41 to 547.28 pg/L, "not detected" to 663.69 pg/L and 8.18 to 409.46 pg/L, respectively) were present at the highest concentrations compared to other esters, and ethyl 2-hexenoate, ethyl 3-hydroxybutanoate and ethyl phenylacetate at the lowest concentrations. The 4-methyl- 3-penten-2-one was the most abundant ketone, and furan-2-carbaldehyde the most abundant furan compound. In our study, most of the wines from Spain were of the Tempranillo variety: S_1, S_3, S_4, S_5, S_7 and S_8. As in our examinations, Noguerol-Pato et al. (2014) found that isoamyl alcohols, 2-phenylethanol and 1-hexanol were the main alcohols in Tempranillo wines (aliphatic, aromatic and C6 alcohols respectively). Also, ethyl 2-hydroxypropanoate (ethyl lactate) was the most abundant ethyl ester. According to Vilanova et al. (2013) and Noguerol-Pato et al. (2014), 3-methylbutyl acetate (isopentyl acetate) was the most abundant acetate ester, which is consistent with our results. We detected low concentrations of 2-(4-methyl-1-cyclohex-3-enyl)propan-2-ol (α-terpineol) in Tempranillo wines, as did Noguerol-Pato et al. (2014).
Among the identified alcohols in wines from Poland, 3-methylbutan-1-ol had the highest concentrations (529.19 to 2 306.11 pg/L), followed by hexan-1-ol (122.39 to 448.36 μg/L) and 2-phenylethanol (28.09 to 199.76 μg/L) (Table 6). The lowest levels were shown by pentan-1-ol, (E)-3-hexen-1-ol, 3-ethoxypropan-1-ol, 3-ethyl-4-methylpentan-1-ol and phenylmethanol. The ester fraction was composed mainly of 3-methylbutyl acetate ("not detected" to 1 498.94 μg/L), ethyl 2-hydroxypropanoate (10.65 to 579.47 μg/L) and ethyl octanoate (37.51 to 316.22 μg/L). The minor esters were ethyl 2-hexenoate, ethyl 3-hydroxybutanoate, ethyl phenylacetate, and 2-phenylethyl acetate. Ethyl (2E,4E)-2,4-hexadienoate was not present in any of the wines from Poland. Major volatile compounds within classes were: 4-methyl-3-penten-2-one and furan-2-carbaldehyde. In our work, most of the wines from Poland were produced from the Rondo and Regent varieties. Several researchers have analysed volatile compounds in white and red wines produced in Poland (Dziadas et al., 2010; Tarko et al., 2010; Jelen et al., 2011), but these wines were from other grape varieties.
Analysis of variance (ANOVA) and the Kruskal-Wallis test showed statistically significant differences between French, Italian, Spanish and Polish wines for the following compounds: 3-methylbutan-1-ol, hexan-1-ol, (E)-3-hexen-1-ol, 3-ethoxypropan-1-ol, butane-2,3-diol, phenylmethanol, 2-phenylethanol, ethyl 2-hydroxy-4-methylpentanoate, ethyl phenylacetate, 2-phenylethyl acetate and 3-(methylsulfanyl) propan-1-ol. The multiple comparisons showed that hexan-1-ol distinguished Polish wines from the others. Its content in Polish wines was significantly higher than in the wines from other countries. Hexan-1-ol, one of the C6 alcohols, is produced during the pre-fermentative steps (harvesting, transport, crushing and pressing of grapes), when linolenic and linoleic acids are released from the grape skin and react with lipoxygenase. Hexan-1-ol has a "grassy" flavour (Tufariello et al., 2012; Noguerol-Pato et al., 2014).
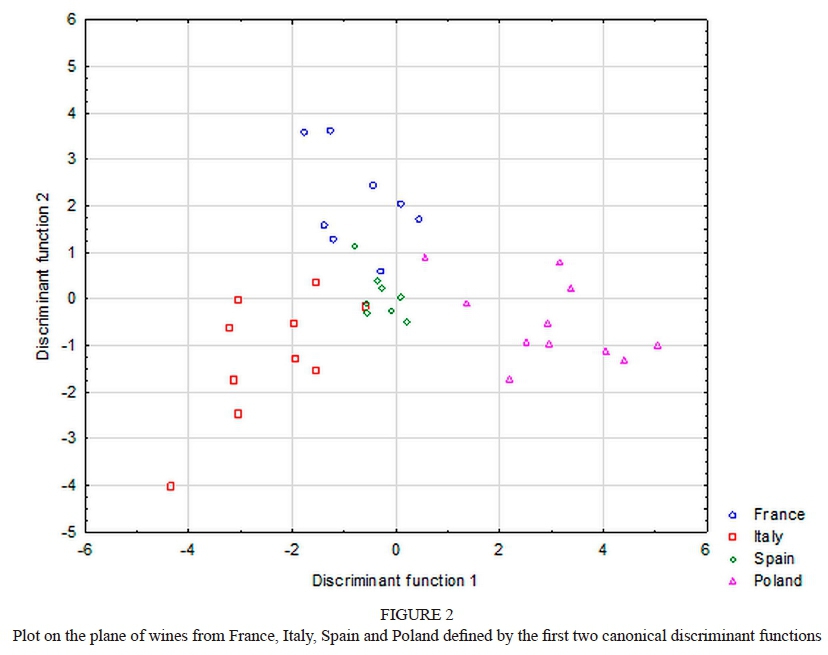
Linear discriminant analysis (LDA) showed the six most discriminant variables: ethyl phenylacetate, hexan-1-ol, ethyl 2-hydroxy-4-methylpentanoate, (E)-3-hexen-1-ol, 2-phenylethanol and 3-(methylsulfanyl)propan-1-ol. The three designated linear discriminant functions that separated the four groups of wines were statistically significant. The first discriminant function (F1) accounted for 66.73% of the explained variance, the second (F2) for 22.02% and the third (F3) for 11.25%. The canonical correlation coefficients indicated a strong relationship between the first discriminant function and the groups (0.911), while the weakest relationship was found between the third function and the groups. Analysis of standardised coefficients of the canonical discriminant functions showed that 3-(methylsulfanyl)propane-1-ol, hexan-1-ol, ethyl phenylacetate and ethyl 2-hydroxy-4-methylpentanoate had the greatest impact on the first discriminant function. The second discriminant function was mainly determined by 2-phenylethanol, ethyl phenylacetate and (E)-3-hexen-1-ol. Ethyl 2-hydroxy-4-methylpentanoate and 2-phenylethanol had the strongest effect on the third discriminant function. The first discriminant function mainly differentiated Polish wines from the others. The second function discriminated French wines from the others, but the discrimination was not as sharp as for the first function. The third function may have discriminated Spanish wines from the others.
The graphical representation of wines on the plane defined by the first two discriminant functions confirmed that the first discriminant function has the ability to distinguish Polish wines from the others (Fig. 2). The value of Wilk's coefficient λ=0.0359 shows very good discriminatory power of the model. The results of the wine classification revealed that 91.89% of the wines were classified correctly. The Polish wines were properly classified in 90.91% of cases. One Polish wine (P_4) was classified into the group of Spanish wines. Similarly, Zióhkowska et al. (2016) applied LDA for the differentiation of white and red wines according to grape variety and geographical origin based on volatile composition, and reported that discrimination was much worse when SPME-GC-MS rather than SPME-MS data were used. When LDA was carried out on SPME-GC-MS data, compounds with the best discrimination power were hexan-1-ol and 2-phenylethanol, as in our study, as well as ethyl decanoate and ethyl dodecanoate.
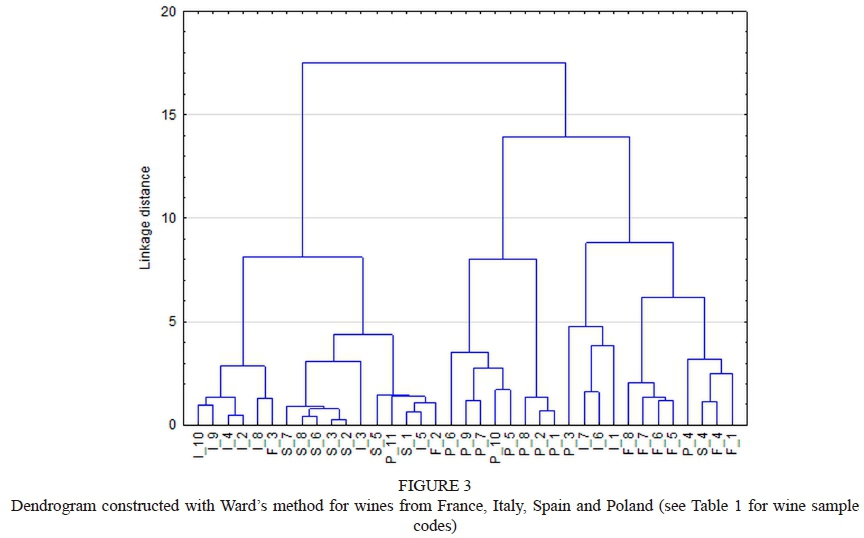
Hierarchical cluster analysis (HCA) showed that the tested wines can be divided into three groups when taking into account the compounds selected in the discriminant analysis (Fig. 3). The first group contained most Italian wines (I_2, I_3, I_4, I_5, I_8, I_9, I_10), nearly all Spanish wines (S_1, S_2, S_3, S_5, S_6, S_7, S_8), two French wines (F_2, F_3) and one Polish wine (P_11). Almost all Polish wines (except samples No. 3, 4 and 11) constituted the second group (P_1, P_2, P_5, P_6, P_7, P_8, P_9, P_10). The third group was formed by three Italian wines (I_1, I_6, I_7), nearly all French wines (F_1, F_4, F_5, F_6, F_7, F_8), one Spanish wine (S_4) and two Polish wines (P_3 and P_4). Clearly almost all the Polish wines (8 of 11) were assigned to one group. Two Polish wines (P_3 and P_4) were classified into a separate group containing nearly all French wines and the other one into the group mainly formed by Italian and Spanish wines. The results showed that Polish wines were well separated from other wines, except for samples No. 3, 4 and 11.
The incorrect classification, or clustering, of some wines in LDA and HCA may be due to data obtained by the proposed method of volatile compound analysis (e.g. condition of extraction and technical parameters of GC-MS). Results obtained for LDA and HCA are different since the classification, clustering and mathematical procedures used were different.
CONCLUSIONS
The analysis of aroma compounds has been successfully applied for distinguishing between wines from Poland and wines from France, Italy and Spain. Aroma compounds were determined by HS-SPME-GC/MS. Four commercially available SPME fibres were tested in the same experimental conditions in order to find the fibre that extracted as many volatile compounds as possible. The CAR/PDMS coating extracted the largest number of identified chromatographic peaks with the largest total chromatographic area.
Statistical analysis showed that the content of hexan-1-ol in Polish wines was significantly higher than in the French, Italian and Spanish wines. Hexan-1-ol is produced during pre-fermentative steps, when linolenic and linoleic acids are released from the grape skin and react with lipoxygenase.
The data were processed using linear discriminant analysis and hierarchical cluster analysis. LDA showed that 3-(methylsulfanyl)propane-1-ol, hexan-1-ol, ethyl phenylacetate and ethyl 2-hydroxy-4-methylpentanoate had the highest discrimination power for distinguishing between wines from Poland and those from other European countries. Polish wines were properly classified in 90.91% of the cases. The HCA revealed that 72.73% of the Polish wines were grouped into one cluster. Aroma analysis by means of HS-SPME/GC-MS combined with LDA and HCA is a useful tool for the identification of wines originating from Poland.
LITERATURE CITED
Antalick, G., Perello, M.C. & De Revel, G., 2014. Esters in wines: New insight through the establishment of a database of French wines. Am. J. Enol. Vitic. 63, 293-304. [ Links ]
Bianchi, F., Careri, M., Mangia, A. & Musci, M., 2007. Retention indices in the analysis of food aroma volatile compounds in temperature-programmed gas chromatography: Database creation and evaluation of precision and robustness. J. Sep. Sci. 30, 563-572. [ Links ]
Burin, V.M., Marchand, S., De Revel, G. & Bordignon-Luiz, M.T., 2013. Development and validation of method for heterocyclic compounds in wine: Optimization of HS-SPME conditions applying a response surface methodology. Talanta 117, 87-93. [ Links ]
Cabredo-Pinillos, S., Cedrón-Fernández, T. & Sáenz-Barrio, C., 2008. Differentiation of "Claret", rosé, red and blend wines based on the content of volatile compounds by headspace solid-phase microextraction and gas chromatography. Eur. Food Res. Technol. 226, 1317-1323. [ Links ]
Cámara, J.S., Alves, M.A. & Marques, J.C., 2006. Development of headspace solid-phase microextraction-gas chromatography-mass spectrometry methodology for analysis of terpenoids in Madeira wines. Anal. Chim. Acta. 555, 191-200. [ Links ]
Coetzee, C. & Du Toit, W.J., 2015. Sauvignon blanc wine: Contribution of ageing and oxygen on aromatic and non-aromatic compounds and sensory composition - A review. S. Afr. J. Enol. Vitic. 36, 347-365. [ Links ]
Du, G., Zhan, J., Li, J., You, Y., Zhao, Y. & Huang, W., 2012. Effect of grapevine age on the aroma compounds in 'Beihong' wine. S. Afr. J. Enol. Vitic. 33, 7-13. [ Links ]
Duarte, W.F., Dias, D.R., Oliveira, J.M., Teixeira, J.A., De Almeida e Silva, J.B. & Schwan, R.F., 2010. Characterization of different fruit wines made from cacao, cupuassu, gabiroba, jaboticaba and umbu. LWT-Food Sci. Technol. 43, 1564-1572. [ Links ]
Dugo, G, Franchina, F.A., Scandinaro, M.R., Bonaccorsi, I., Cicero, N., Tranchida, P.Q. & Mondello, L., 2014. Elucidation of the volatile composition of Marsala wines by using comprehensive two-dimensional gas chromatography. Food Chem. 142, 262-268. [ Links ]
Dziadas, M. & Jelen, H.H., 2010. Analysis of terpenes in white wines using SPE-SPME-GC/MS approach. Anal. Chim. Acta 677, 43-49. [ Links ]
Gamero, A., Wesselink, W. & De Jong, C., 2013. Comparison of the sensitivity of different aroma extraction techniques in combination with gas chromatography-mass spectrometry to detect minor aroma compounds in wine. J. Chromatogr. A. 1272, 1-7. [ Links ]
Goldner, M.C., Di Leo Lira, P., Van Baren, C. & Bandoni, A., 2011. Influence of polyphenol levels on the perception of aroma in Vitis vinifera cv. Malbec wines. S. Afr. J. Enol. Vitic. 32, 21-27. [ Links ]
Goodner, K.L., 2008. Practical retention index models of OV-101, DB-1, DB-5, and DB-Wax for flavor and fragrance compounds. LWT-Food Sci. Technol. 41, 951-958. [ Links ]
Jelen, H.H., Majcher, M., Dziadas, M., Zawirska-Wojtasiak, R., Czaczyk, K. & Wasowicz, E., 2011. Volatile compounds responsible for aroma of Jutrzenka liquer wine. J. Chromatogr. A. 1218, 7566-7573. [ Links ]
Jelen, H.H., Majcher, M. & Dziadas, M., 2012. Microextraction techniques in the analysis of food flavor compounds: A review. Anal. Chim. Acta. 738, 13-26. [ Links ]
Jergensen, U., Hansen, M., Christensen, L.P., Jensen, K. & Kaack, K., 2000. Olfactory and quantitative analysis of aroma compounds in elder flower (Sambucus nigra L.) drink processed from five cultivars. J. Agric. Food Chem. 48, 2376-2383. [ Links ]
Jurado, J.M., Ballesteros, O., Alcázar, A., Pablos, F., Martin, M.J., Vilchez, J.L. & Navalón, A., 2008. Differentiation of certified brands of origins of Spanish white wines by HS-SPME-GC and chemometrics. Anal. Bioanal. Chem. 390, 961-970. [ Links ]
Kallio, H., 1989. Aroma of birch syrup. J. Agric. Food Chem. 37, 1367-1371. [ Links ]
King, E.S., Stoumen, M., Buscema, F., Hjelmeland, A.K., Ebeler, S.E., Heymann, H. & Boulton, R.B., 2014. Regional sensory and chemical characteristics of Malbec wines from Mendoza and California. Food Chem. 143, 256-267. [ Links ]
Mallouchos, A., Loukatos, P., Bekatorou, A., Koutinas, A. & Komaitis, M., 2007. Ambient and low temperature winemaking by immobilized cells on brewer's spent grains: Effect on volatile composition. Food Chem. 104, 918-927. [ Links ]
Marengo, E., Aceto, M. & Maurino, V., 2001. Classification of Nebbiolo-based wines from Piedmont (Italy) by means of solid-phase microextraction-gas chromatography-mass spectrometry of volatile compounds. J. Chromatogr. A. 943, 123-137. [ Links ]
Mendes, B., Gonçalves, J. & Cámara, J.S., 2012. Effectiveness of high-throughput miniaturized sorbent- and solid phase microextraction techniques combined with gas chromatography-mass spectrometry analysis for a rapid screening of volatile and semi-volatile composition of wines - a comparative study. Talanta 88, 79-94. [ Links ]
Metafa, M. & Economou, A., 2013. Chemometrical development and comprehensive validation of a solid phase microextraction/gas chromatography-mass spectrometry methodology for the determination of important free and bound primary aromatics in Greek wines. J. Chromatogr. A. 1305, 244-258. [ Links ]
Noguerol-Pato, R., Sieiro-Sampredro, T., González-Barreiro, C., Cancho-Grande, B. & Simal-Gándara, J., 2014. Effect on the aroma profile of Graciano and Tempranillo red wines of the application of two antifungal treatments onto vines. Molecules 19, 12173-12193. [ Links ]
Pereira, V., Cacho, J. & Marques, J.C., 2014. Volatile profile of Madeira wines submitted to traditional accelerated ageing. Food Chem. 162, 122-134. [ Links ]
Perestrelo, R., Silva, C. & Cámara, J.S., 2014. A useful approach for the differentiation of wines according to geographical origin based on global volatile patterns. J. Sep. Sci. 37, 1974-1981. [ Links ]
Rodrigues, F., Caldeira, M. & Cámara, J.S., 2008. Development of a dynamic headspace solid-phase microextraction procedure coupled to GC-qMSD for evaluation the chemical profile in alcoholic beverages. Anal. Chim. Acta 609, 82-104. [ Links ]
Römisch, U., Jäger, H., Capron, X., Lanteri, S., Forina, M. & Smeyers-Verbeke, J., 2009. Characterization and determination of the geographical origin of wines. Part III: multivariate discrimination and classification methods. Eur. Food Res. Technol. 230, 31-45. [ Links ]
Sáenz, C., Cedrón, T. & Cabredo, S., 2010. Classification of wines from five Spanish origin denominations by aromatic compound analysis. J. AOAC Int. 93, 1916-1922. [ Links ]
Sagratini, G., Maggi, F., Caprioli, G., Cristalli, G., Ricciutelli, M., Torregiani, E. & Vittori, S., 2012. Comparative study of aroma profile and phenolic content of Montepulciano monovarietal red wines from the Marches and Abruzzo regions of Italy using HS-SPME-GC-MS and HPLC-MS. Food Chem. 132, 1592-1599. [ Links ]
Song, S., Tanga, Q., Hayat, K., Karangwa, E., Zhang, X. & Xiao, Z., 2014. Effect of enzymatic hydrolysis with subsequent mild thermal oxidation of tallow on precursor formation and sensory profiles of beef flavours assessed by partial least squares regression. Meat Sci. 96, 1191-1200. [ Links ]
Stój, A., 2011. Metody wykrywania zafalszowaá win. Zywnosc. Nauka. Technologia. Jakosc. 75(2), 17-26. [ Links ]
Tarko, T., Duda-Chodak, A., Sroka, P., Satora P. & Jurasz, E., 2010. Polish wines: Characteristics of cool-climate wines. J. Food Comp. Anal. 23, 463-468. [ Links ]
Trani, A., Verrastro, V., Punzi, R., Faccia, M. & Gambacorta, G., 2016. Phenols, volatiles and sensory properties of Primitivo wines from the "Gioia Del Colle" PDO Area. S. Afr. J. Enol. Vitic. 37, 139-148. [ Links ]
Tufariello, M., Capone, S. & Siciliano, P., 2012. Volatile components of Negroamaro red wines produced in Apulian Salento area. Food Chem. 132, 2155-2164. [ Links ]
Vilanova, M., Genisheva, Z., Graña, M. & Oliveira, J.M., 2013. Determination of odorants in varietal wines from international grape cultivars (Vitis vinifera) grown in NW Spain. S. Afr. J. Enol. Vitic. 34, 212-222. [ Links ]
Vitis International Variety Catalogue, http://www.vivc.de/, Accessed June 26, 2017. [ Links ]
Weldegergis, B.T., De Villiers, A., McNeish, Ch., Seethapathy, S., Mostafa, A., Górecki, T. & Crouch, A.M., 2011. Characterisation of volatile components of Pinotage wines using comprehensive two-dimensional gas chromatography coupled to time-of-flight mass spectrometry (GC x GC- TOFMS). Food Chem. 129, 188-199. [ Links ]
Welke, J.E., Manfroi, V., Zanus, M., Lazzarotto, M. & Zini, C.A., 2012b. Characterization of the volatile profile of Brazilian Merlot wines through comprehensive two dimensional gas chromatography time-of-flight mass spectrometric detection. J. Chromatogr. A. 1226, 124-139. [ Links ]
Welke, J.E., Zanus, M., Lazzarotto, M., Schmitt, K.G. & Zini, C.A., 2012a. Volatile characterization by multivariate optimization of headspace-solid phase microextraction and sensorial evaluation of Chardonnay base wines. J. Brazil. Chem. Soc. 23, 678-687. [ Links ]
Wilk, K., 2011. Polski rynek win w swietle zmian w krajowych i wspólnotowych uregulowaniach prawnych. Studia i Prace Wydziaiu Nauk Ekonomicznych i Zarzadzania. 22, 135-148. [ Links ]
Yan, J., Liu, X.B., Zhu, W.W., Zhong, X., Sun, Q. & Liang, Y.Z., 2015. Retention indices for identification of aroma compounds by GC: Development and application of a retention index database. Chromatographia 78, 89-108. [ Links ]
Zhang, L., Tao, Y.S., Wen, Y. & Wang, H., 2013. Aroma evaluation of young Chinese Merlot wines with denomination of origin. S. Afr. J. Enol. Vitic. 34, 46-53. [ Links ]
Ziólkowska A., Wasowicz E. & Jelen H.H., 2016. Differentiation of wines according to grape variety and geographical origin based on volatiles profiling using SPME-MS and SPME-GC/MS methods. Food Chem. 213, 714-720. [ Links ]
Submitted for publication: April 2017
Accepted for publication: July 2017
* Corresponding author: E-mail address: anna.stoj@up.lublin.pl [Tel: 48 81 4623380; Fax: 48 81 462 34 00]

