


Services on Demand
Article
 English (pdf)
 Article in xml format
 Article references
Indicators

Related links
-
 Cited by Google
 -
 Similars in Google
Share

 Permalink
South African Journal of Enology and Viticulture
On-line version ISSN 2224-7904
Print version ISSN 0253-939X
S. Afr. J. Enol. Vitic. vol.38 n.2 Stellenbosch 2017
http://dx.doi.org/10.21548/38-2-1391
ORIGINAL RESEARCH ARTICLES
Effect of Torulaspora delbrueckii Yeast Treatment on Flavanols and Phenolic Acids of Chenin blanc Wines
Z. NgqumbaI, II; N. NtusheloIII; N.P. JollyI; B.J. XimbaII; P.P. MinnaarI, *
IARC Infruitec-Nietvoorbij, Private Bag X5026, Stellenbosch 7600, South Africa
IIDepartment of Chemistry, Cape Peninsula University of Technology, PO Box 1906, Bellville 7535, South Africa
IIIARC Biometry Division, Private Bag X5026, Stellenbosch 7600, South Africa
ABSTRACT
The non-Saccharomyces yeast Torulaspora delbrueckii contributes positively to the sensory properties of wines by affecting aroma and flavour due to changes in alcohols, esters, fatty acids and lactone levels. One of the less-studied aspects of T. delbrueckii is its effect on phenolic compounds relating to sensory attributes. An HPLC-DAD technique was used for the quantification of phenolic compounds in Chenin blanc wines made with S. cerevisiae and two T. delbrueckii yeasts over three vintages. Chemical and sensory data were subjected to ANOVA and PCA. VIN13, M2/1 and VIN13+M2/1 had a positive effect on the phenolic compound concentrations of Chenin blanc wines. Mouthfeel was highest in VIN13+654 wines and astringency highest in VIN13 wines. An association was evident between flavanols, astringency and mouthfeel for the VIN13, M2/1 and VIN13+M2/1 wines. Chenin blanc wines made with M2/1 and VIN13+M2/1 may result in increased phenolic compound concentrations and astringency, whereas 654 and VIN13+654 may result in wines with increased mouthfeel properties.
Key words: Yeast treatment, sensory attributes, flavanols, phenolic acids, Torulaspora delbrueckii, Chenin blanc, HPLC
INTRODUCTION
Chenin blanc grapes have the potential to produce high-quality wines (Marais, 2003) and the choice of yeast for vinification plays an important role in determining the quality of the wine. Yeast choice is a tool that wine producers can use to improve wine quality and change the style of wines. Wine aromas are affected by the levels of esters, alcohols and fatty acids (González-Barreiro et al., 2013; Robinson et al., 2014). Phenolic compounds (flavanols, flavonols, phenolic acids, anthocyanins) are an equally important quality factor in wine, as they are responsible for colour (red wines), astringency, complexity, stability and bitterness (Lesschaeve & Noble, 2005; Kennedy, 2008).
There have been different approaches to the quantification of phenolic compounds in wine for chemical profiling, i.e. spectroscopic (Andersen & Markham, 2007) or chromatographic techniques (Stefova et al., 2003; Castillo-Muñoz et al., 2010; Moreno et al., 2015; Nelson et al., 2016). Reversed-phase high performance liquid chromatography (RP-HPLC) coupled to a photodiode array detector (DAD) is one of the more commonly used methods for the separation and quantification of phenolic compounds in wine (De Villiers et al., 2004; Liazid et al., 2010; Lorrain et al., 2011; Fanali et al., 2013; Favre et al., 2014; Garaguso & Nardini, 2015; Nelson et al., 2016). The use of RP-HPLC-DAD constitutes a reliable tool for the quantification of phenolic compounds by allowing maximum absorbance, controlling peak purity and identifying compounds by means of UV-visible spectra and relative retention times.
Saccharomyces cerevisiae yeasts are used in commercial winemaking, but they have been proven to decrease the phenolic concentration of wine through the adsorption of the phenolic compounds onto the yeast cell walls, consequently negatively affecting the quality of wine (Caridi, 2007). The interaction of yeast strains with grape must during fermentation is characterised by yeast metabolites, which are specific to a yeast strain (Romano et al., 2011). Research has shown that the contribution of non-Saccharomyces yeasts to wine quality leads to improved sensory attributes, compared to wines made with S. cerevisiae yeasts only (Ciani et al., 2010; Ciani & Comitini, 2011; Jolly et al., 2014). Torulaspora delbrueckii (anamorph: Candida colliculosa) is one of the non-Saccharomyces yeasts that has received attention from researchers due to its role in wine aroma and flavour by affecting alcohols, esters, fatty acids and lactone levels (Azzolini et al., 2012; Velázquez et al., 2015). Van Breda et al. (2013) investigated the potential of forty-four Torulaspora delbrueckii strains in completing fermentation on their own and/or in a combination inoculation with S. cerevisiae. Two Torulaspora delbrueckii strains, viz. strains M2/1 and 654, showed potential concerning fermentation rate and improved chemical profiles (Lea & Piggott, 1995; Jolly et al., 2014; Van Breda et al., 2014).
This study aimed to identify and quantify phenolic compounds in Chenin blanc wines made with two T. delbrueckii yeasts strains (654 and M2/1) and in combination with a commercial S. cerevisiae yeast strain (VIN13). The effect of yeast treatment on the sensory attributes of the wines is also reported.
MATERIALS AND METHODS
Torulaspora delbrueckii yeast strains 654 and M2/1 were obtained from the ARC Infruitec-Nietvoorbij's microbiological yeast collection. Commercially active dry S. cerevisiae wine yeast (strain VIN13, Anchor BioTechnologies, Cape Town, South Africa) was used as reference yeast and for co-inoculation.
Small-scale winemaking
Chenin blanc wines were made according to a standardised small-scale (18 L) white winemaking protocol at the Nietvoorbij Research Cellar (Jolly et al., 2003a; Minnaar et al., 2015) over three vintages (2011, 2012, 2013). The grapes were crushed, de-stemmed and immediately pressed (with the skins) to 100 KPa in a small-scale pneumatic press. Sulphur dioxide was adjusted to 50 mg/L, and 0.5 g/hL of Ultrazyme® was added. The juice was allowed to settle overnight at a temperature of 14°C. Clear juice was drawn off into 20 L stainless steel canisters. The inoculum concentration was 30 g/hL for the S. cerevisiae active dry yeast (VIN13) and 2 x 10⁶ cfu/mL for the two T. delbrueckii yeast strains (654 and M2/1) in pure culture and co-inoculations. The inoculation of S. cerevisiae in the combination treatments was performed one hour after the inoculation of T. delbrueckii (Jolly et al., 2003b). The yeast treatments used for the production of the Chenin blanc wines therefore were VIN13, 654, M2/1, VIN13+654 and VIN13+M2/1. Fermentation took place at 14°C. Diammonium hydrogen phosphate (50 g/hL) was added to ensure a sufficient supply of nitrogen during fermentation. Free SO2 was adjusted to 35 mg/L where fermentations were not completed within 32 days. Bentonite (75 g/hL) was added two days after fermentation commenced. The wines were fermented to glucose dryness (< 5 g/L) as tested with a Clinistix™ strip (Beyer, Cape Town). Residual sugar in the bottled wines was confirmed by Winescan® analysis (glucose+fructose). The wines were cold stabilised at 0°C for a minimum of one week, after which they were racked. The small-scale wine fermentations were performed in duplicate for 2011 and in triplicate for the 2012 and 2013 vintages. All wines were filtered through K700 and EK filter sheets and bottled in 750 mL glass bottles. Free SO2 was adjusted to 35 mg/L at bottling. The wines were stored at 14°C for three months after bottling before they were evaluated sensorially and chemically. Two and three repetitions per treatment were carried out for the first and subsequent two vintages respectively.
Wine phenolic compound analyses
Reversed-phase high performance liquid chromatography (RP-HPLC)
The RP-HPLC determination of phenolic compounds was performed using an Agilent model 1260 HPLC system (Chemetrix, South Africa). The system was equipped with an auto-sampler and a photodiode array detector. A polymer reversed-phase analytical column (PLRP-S 100 A, 5 μηι, 250 x 4.6 mm) with polystyrene divinylbenzene as a stationary phase was use for compound separation (Polymer Laboratories, USA). A gradient mobile phase programme was used for compound elution. Mobile phase A consisted of water/phosphoric acid (985:15 v/v) with a pH of ca. 1.35, and mobile phase B consisted of water/phosphoric acid/ acetonitrile (185:15:800 v/v/v) with a pH of ca. 1.25. The following gradient mobile phase programme was used for compound separation: 94% of mobile phase A was used initially at 0 min, 94% to 69% of mobile phase A at 73 min; 69% to 38% of mobile phase A at 78 min; 38% to 94% of mobile phase A at 90 min. The column and the system were equilibrated for 20 minutes after each analysis run time of 90 min to revert to the starting conditions. The flow rate was 1 mL/min. Separation of the compounds was carried out at ca. 25°C. The identification of phenolic compounds was confirmed by their relative retention times based on available phenolic compound reference standards and UV-visible absorption characteristics (Stefova et al., 2003, De Villiers et al., 2011). Wine sample aliquots of 2 mL were filtered through 0.45 μηι nylon membrane syringe filters prior to analysis. A 50 μL sample filtrate was injected onto the HPLC column. Replicate samples were analysed on the same day.
Sensory analyses
A panel of twelve experienced wine tasters evaluated the wines. The wine tasting took place over four consecutive days to eliminate the tasting of replicate wines in one session. The wines were presented to each judge in international wine-tasting glasses in a randomised order. Sensory analysis involved the evaluation of mouthfeel, acidity and astringency on a 10 cm unstructured line scale (Tromp & Conradie, 1979).
Statistical analyses
The sensory and chemical data were analysed using the two-way ANOVA method (SAS Institute, Inc. 1999) to compare treatment means at a confidence level of 95%. Principal component analysis (PCA) was applied to both datasets to determine associations between the variables (sensory attributes and phenolic compounds) and treatments.
RESULTS AND DISCUSSION
Treatment effect on wine physicochemical parameters
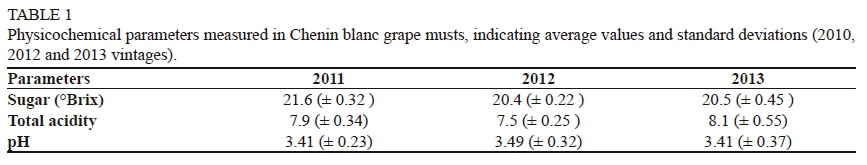
Chenin blanc grape juice was analysed prior to inoculation for total soluble solids (°Brix), total acidity and pH (Table 1).
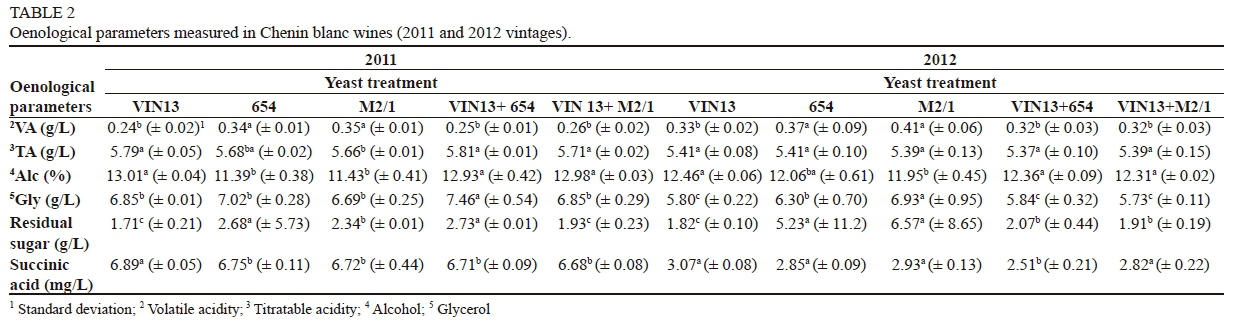
Chenin blanc wines were analysed for volatile acidity, total acidity, alcohol, glycerol, residual sugar and succinic acid (Table 2). There were significant differences between wines made with 654 and VIN13 for volatile acidity, alcohol, residual sugar and succinic acid (2011). VIN13 and 654 wines made during 2012 showed significant differences among volatile acidity, glycerol and residual sugar. In 2013, volatile acidity, glycerol, residual sugar and succinic acid were significantly different between the VIN13 and 654 wines.
Wines made with a combination of VIN13+654 (2011) were significantly different from VIN13 wines for glycerol, residual sugar and succinic acid. VIN13+M2/1 wines (2011) were significantly different from VIN13 wines (2011) for succinic acid. A combination of VIN13+654 wines (2012) were significantly different from VIN13 wines (2012) for residual sugar and succinic acid. VIN13+M2/1 wines (2012) were also significantly different from VIN13 wines (2012) for residual sugar. Wines made with a combination of VIN13+654 (2013) and VIN13+M2/1 (2013) showed no significant differences from the VIN13 wines (2013) in terms of volatile acidity, total acidity, alcohol, glycerol and residual sugar, except for succinic acid, which was significantly different.
Treatment effect on wine phenolic compounds
Two flavanols and four phenolic acids were quantified in the wines (Table 3). The concentrations of phenolic compound, i.e. (+)-catechin, (-)-epicatechin, gallic acid, caffeic acid, p-coumaric acid and ferulic acid ranged from 5.90 to 16.10 mg/L, 5.64 to 15.99 mg/L, 10.64 to 15.51 mg/L, 2.51 to 13.89 mg/L, 3.95 to 7.07 mg/L and 2.49 to 5.13 mg/L respectively over the three consecutive vintages.
Flavanols
The concentrations of (+)-catechin in wines made with S. cerevisiae (VIN13) and T. delbrueckii M2/1 strains were higher than in wines made with strain T. delbrueckii 654 and VIN13+654 in 2011 and 2012 (Table 3). In 2013, VIN13 wines were lower in (+)-catechin concentrations than in the 654, M2/1 and combination wines. The differences in the concentrations of (+)-catechin in wines made with the two T. delbrueckii strains (2011 and 2012) indicate that there are yeast strain differences. The results also showed that yeast strain 654 positively affected (-)-epicatechin concentrations in wines made during 2011, whereas VIN13+654 (2012) and VIN13+M2/1 (2012) positively affected (-)-epicatechin concentrations in comparison to VIN13 wines (2012).
The concentration of (+)-catechin in wines made with M2/1 (2013) was notably different (not significantly different) from the 654 wines (2013). Both the M2/1 and 654 wines were significantly different from VIN13 wines for (+)-catechin (2013). Significant differences were evident between the VIN13 and 654 wines (2011, 2012 and 2013) for (+)-catechin. Significant differences were also evident between the VIN13 and VIN13+654 wines (2011) for (+)-catechin. Wines made with M2/1 and VIN13+M2/1 were significantly different in terms of (-)-epicatechin concentrations, and there were also significant differences in concentrations between the VIN13+654 and VIN13+M2/1 wines (2012). During the 2013 vintage, (-)-epicatechin concentrations were significantly different between VIN13 and M2/1 wines, VIN13 and VIN13+M2/1 wines and M2/1 and VIN13+654 wines.
Phenolic acids
Wines made with VIN13 (2011, 2012) proved to be lower in gallic acid than wines made with T. delbrueckii strains and the combination wines (Table 3). Gallic acid proved to be highest in VIN13 and VIN13+654 wines made in 2013. Wines made with the two T. delbrueckii strains (654 and M2/1) were higher in gallic acid than combination wines (2011 and 2012). Torulaspora delbrueckii strain (654 and M2/1) wines made during 2013 were lower in gallic acid than the combination and VIN13 wines.
Caffeic acid was lowest in the VIN13 wines for all three vintages, except for the 654 wines made during 2012, which were lowest in caffeic acid. VIN13+M2/1 wines were highest in caffeic acid for the 2011 and 2012 vintages. In the 2013 vintage, M2/1 wines were highest in caffeic acid concentrations. Wines made with a combination of VIN13+654 (2011) and VIN13+M2/1 (2011) were highest in p-coumaric acid concentrations. VIN13 wines proved to be highest in p-coumaric acid concentrations for both the 2012 and 2013 vintages. Ferulic acid was highest in wines made with a combination of VIN13+654 in 2011, whereas M2/1 wines and VIN13 wines were highest in ferulic acid concentrations in 2012 and 2013 respectively.
Significant differences were evident between wines made with VIN13 and 654 for gallic acid in both 2011 and 2012. Wines made with VIN13+654 and VIN13+M2/1 (2011 and 2012) showed significant differences between gallic acid concentrations.
Caffeic, p-coumaric and ferulic acid concentrations were not significantly different among any of the wines for all five treatments, except for ferulic acid quantified in the VIN13 and 654 wines made during 2012 and the VIN13 wines made during 2013.
Significant differences in ferulic acid were evident between the VIN13 and M2/1 (2012) wines, and between the 654 and M2/1 (2012) wines. VIN13 and 654 wines made during 2013 were significantly different, as were the VIN13 and M2/1 wines. VIN13 and combination wines were also significantly different from each other.
The extraction of phenolics from the grape must correlates with the fermentation rate (sugar consumption) of certain yeast strains (Tables 2 and 3). The higher the sugar consumption, the higher the concentrations of for certain phenolic compounds in the wine. VIN13 had the highest fermentation rate (sugar consumption), followed by VIN13+M2/1 (2011 and 2012). VIN13+M2/1 had the highest fermentation rate in 2013.
Principal component analysis (Phenolic compounds)
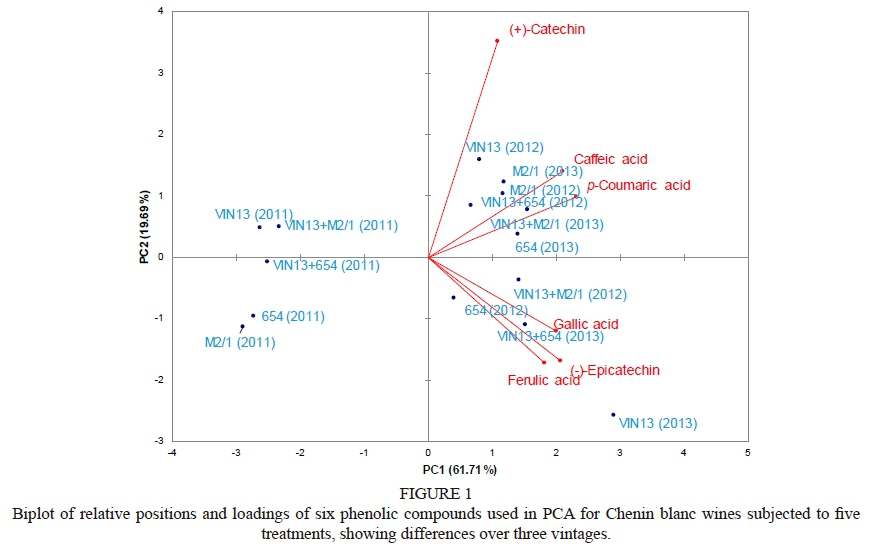
Principal component analysis of the phenolic compound variables was applied to the measurements of each phenolic compound in relation to the total content of the measured variables (Fig. 1). This analysis yielded two principal components, explaining 81.40% of the total variance in the two dimensions (PC1 and PC2), with 61.71% and 19.69% explained by PC1 and PC2 respectively. Association and correlation occurred only in PC1.
The VIN13, 654, M2/1 and combination wines made during 2011 were not associated with any of the measured phenolic compounds (variables), whereas the VIN13 (2012), M2/1 (2012 and 2013), 654 (2013), VIN13+M2/1 (2013) and VIN13+654 (2012) wines were associated with (+)-catechin, caffeic acid, and p-coumaric acid. Gallic acid, (-)-epicatechin and ferulic acid were associated with the VIN13 (2013), VIN13+M2/1 (2012), VIN13+654 (2013) and 654 (2012) wines. Yeast treatments that were associated with p-coumaric acid (2012, M2/1) were also associated with caffeic acid (2013, M2/1). Wines made with 654 (2013) were associated with phenolic acids, whereas wines made with the same yeast strain in 2013 were associated with phenolic acids and flavanols.
Treatment effect on sensory attributes
Sensory evaluation showed that wines made with 654 and M2/1 (2011 and 2012) scored mgheronmoutrrfeelthan wines made with VIN13 (Table 4), but they were not significantly different. This could be attributed to the higher concentrations of (+)-catechin (M2/1 wines, 2012), (-)-epicatechin (654 wines, 2011), and gallic and caffeic acid concentrations (M2/1 wines, 2011) compared to the VIN13 wines. The high flavanol concentrations suggest that metabolites produced by T. delbrueckii yeast strains (654 and M2/1 wines) during fermentation affected the mouthfeel of the wine more than the metabolites produced by the S. cerevisiae yeast strain (VIN13). The residual sugar of the 654 (2011 and 2012) and M2/1 (2011 and 2012) wines were higher than that of the VIN13 (2011 and 2012) wines. Glycerol levels were higher in the 654 (2011) wines than in the VIN13 wines (2011). Wines made with the two T. delbrueckii yeast strains in 2013 scored lower in mouthfeel than wines made with VIN13 (2013), even though the residual sugar and glycerol levels were higher in the 654 and M2/1 wines (2013) than the VIN13 wines (2013). Wines made with a combination of VIN13+654 scored higher in mouthfeel than the VIN13 wines for both the 2011 and 2012 vintages. In 2013, the VIN13+654 wines scored lower in mouthfeel than the VIN13 wines. A combination of VIN13+M2/1 wines scored lower in mouthfeel (2011 and 2013) than VIN13 wines of the same vintages
The higher scores for astringency in wines made with S. cerevisiae (VIN13) than wines made with the two T. delbrueckii strains (654 and M2/1) in all vintages show the effect of yeast strains on the astringency of wine. Wines made with a combination of VIN13+654 and VIN13+M2/1 (2011 and 2012) scored more or less the same as the VIN13 wines for astringency. Wines made with 654 and M2/1, and thecombination wines in 2013, scored slightly lower in astringency than the VIN13 wines of the same year.
Perceived acidity was lower in wines made with the two T. delbrueckii yeast strains (654 and M2/1) than wines made with the VIN13 strain for all vintages. Wines made with a combination of VIN13+654 (2011) and VIN13+M2/1 (2011) scored higher in perceived acidity than VIN13 wines (2011). Combination wines made during 2012 and 2013 scored lower in perceived acidity than VIN13 wines (2012 and 2013). However, succinic acid can also contribute to perceived acidity (Taillandier et al., 2014; Lleixá et al., 2016). There were significant differences in the concentration of succinic acid among wines made over the three vintages. The low perceived acidity in the 654 and M2/1 wines (2011 and 2012), and the VIN13+654 and VIN13+M2/1 wines (2012 and 2013), can be attributed to the low succinic acid concentrations of the 654 wines (2011, 2012 and 2013), the M2/1 wines (2011 and 2012) and the combination wines (2011 and 2012) compared to the VIN13 wines.
Principal component analysis (sensory attributes)
Principal component analysis for sensory variables was applied to the percentage of each sensory attribute in relation to the total content of the measured variables (. 2). The analysis yielded two principal components (PC1 and PC2) explaining 93.64% of the total variance in the two dimensions (PC1 and PC2), with 60.87% and 32.77% explained by PC1 and PC2 respectively. The association and correlation occurred mostly in PC1.
Wines made with VIN13 (2011, 2012 and 2013), VIN13+654 (2011 and 2013), 654 (2013), VIN13+M2/1 (2011) and M2/1 (2013) were associated with astringency and acidity. Mouthfeel was not associated with any of the wines. VIN13+M2/1 (2012), 654 (2011 and 2012), M2/1 (2011 and 2012), VIN13 (2012) and VIN13+654 (2012) wines were not associated with any of the measured sensory attributes.
CONCLUSIONS
Two flavanols and four phenolic acids were quantified in the Chenin blanc wines. The results show that the VIN13 wines (average values over three vintages) were highest in flavanol concentrations, followed by the M2/1 and VIN13+M2/1 wines. The VIN13 and VIN13+M2/1 wines had the lowest and second lowest residual sugar respectively. Phenolic acid concentrations were highest in the M2/1 wines over the three vintages, followed by the VIN13+M2/1 wines.
Wines made with a combination of VIN13+654 scored highest in mouthfeel. The M2/1 wines were the highest in glycerol concentration, followed by the 654 wines. Glycerol can contribute to mouthfeel. The glycerol concentrations in the M2/1 wines may have influenced the tasters' judgement on mouthfeel. Alcohol concentrations can also affect the mouthfeel properties of wine. The VIN13+654 wines were the highest in alcohol, followed by the VIN13+M2/1 wines. The higher alcohol concentrations of the VIN13+654 and VIN13+M2/1 wines may have influenced the tasters' judgement on mouthfeel.
Wines made with VIN13+M2/1 had the second lowest (out of five) residual sugar levels, whereas VIN13+654 wines had the third lowest (out of five) residual sugar levels. The residual sugar concentrations of 654 and M2/1 wines may have influenced the tasters' judgement on mouthfeel, whereas this is unlikely in the case of the VIN13+654, VIN13 and VIN13+M2/1 wines.
Wines made with VIN13 were the highest in astringency, followed by the VIN13+M2/1 wines. The least astringent wines were the 654 wines, followed by the M2/1 wines.
Wines made with a combination of VIN13+M2/1 were highest in perceived acidity, followed by the VIN13+654 wines. Succinic acid was highest in the VIN13+M2/1 wines, followed by the VIN13 wines. The high concentrations of succinic acid in the VIN13+M2/1 wines may have contributed to the high perceived acidity of these wines by the tasters. Wines made with VIN13+654 had the lowest succinic acid concentrations, but were second highest in perceived acidity. It therefore is unlikely that succinic acid affected the tasters' judgement on the perceived acidity of the wines.
Considering all the results, it is concluded that glycerol and alcohol may have played a role in the mouthfeel properties of the analysed wines. VIN13+M2/1, M2/1 and VIN13 had a positive effect on the phenolic compound concentrations of Chenin blanc wines, with the VIN13+654 wines scoring highest in mouthfeel, although they were also highest in glycerol and alcohol concentrations. Wines made with VIN13 had the highest astringency, and wines made with VIN13+M2/1 had the highest perceived acidity but also the highest succinic acid concentrations. Considering phenolic compound concentrations, the VIN13, M2/1 and VIN13+M2/1 wines had the highest flavanol concentrations, while VIN13+654 and VIN13+M2/1 had the highest phenolic acid concentrations but the lowest residual sugar (except for the M2/1 and VIN13+654 wines). Therefore, high sugar consumption is associated with increased flavanol and phenolic acid concentrations. It can be concluded that Chenin blanc wines made with M2/1 and VIN13+M2/1 may result in increased phenolic compound concentrations and astringency, whereas wines made with 654 and VIN13+654 may result in increased mouthfeel properties.
LITERATURE CITED
Andersen, Ø.M. & Markham, K.R., 2007 (2nd ed). Flavonoids: Chemistry, biochemistry, and applications. Taylor & Francis, London. [ Links ]
Azzolini, M., Fedrizzi, B., Tosi, E., Finato, F., Vagnoli, P., Scrinzi, C. & Zapparoli G., 2012. Effects of Torulaspora delbrueckii and Saccharomyces cerevisiae mixed cultures on fermentation and aroma of Amarone wine. Eur. Food Res. Technol. 235, 303-313. [ Links ]
Caridi, C., 2007. New perspectives in safety and quality enhancement of wine through selection of yeasts based on the parietal adsorption activity. J. Food Micro. 120, 167-170. [ Links ]
Castillo-Muñoz, N., Gomez-Alonzo, S., Garcia-Romero, E. & Hermosin-Gutrierrez, I., 2010. Flavonol profiles for grape and wine authentication. Am. Chem. Soc. 67, 120-127. [ Links ]
Ciani, M. & Comitini, F., 2011. Non-Saccharomyces wine yeasts have a promising role in biotechnological approaches to winemaking. Ann. Microbiol. 61, 25-32. [ Links ]
Ciani, M., Comitini, F., Mannazzu, I. & Domizio, P., 2010. Controlled mixed culture fermentation: A new perspective on the use of non-Saccharomyces yeasts in winemaking. FEMS Yeast Res. 10, 123-133. [ Links ]
De Villiers, A., Alberts, P., Tredoux, A.G.J. & Nieuwoudt, H.H., 2011. Analytical techniques for wine analysis: An African perspective. Anal. Chim. Acta 730, 2-23. [ Links ]
De Villiers, A., Van Hoenacker, G., Majek, P. & Sandra, P., 2004. Determination of anthocyanins in wine by direct injection liquid chromatography-diode array detection-mass spectrometry and classification of wines using discriminant analysis. J. Chromatogr. A. 1054, 195-204. [ Links ]
Fanali, A.S., Haddad, P.R., Pool, C. & Lloyd, D., 2013 (2nd ed). Liquid chromatography: Fundamentals and instrumentation. Elsevier Inc., Oxford. [ Links ]
Favre, G., Peña-Neira, A., Baldi, C., Hernádez, N., Traverso, S., Gil, G. & González-Neves, G., 2014. Low molecular-weight phenols in Tannat wines made by alternative winemaking procedures. Food Chem. 158, 504-512. [ Links ]
Garaguso, I. & Nardini, M., 2015. Polyphenols content, phenolic profile and antioxidant activity of organic red wines produced without sulphur dioxide/ sulphites addition in comparison to conventional red wines. Food Chem. 179, 336-342. [ Links ]
González-Barreiro, C., Rial-Otero, R., Cancho-Grande, B. & Simal-Gándara, J., 2013. Wine aroma compounds in grapes: A critical review. Crit. Rev. Food Sci. Nutr. 55, 202-218. [ Links ]
Jolly, N.P., Augustyn, O.P.H. & Pretorius, I.S., 2003a. The effect of non-Saccharomyces yeasts on fermentation and wine quality. S. Afr. J. Enol. Vitic. 24, 55-62. [ Links ]
Jolly, N.P., Augustyn, O.P.H. & Pretorius, I.S., 2003b. The use of Candida pulcherrima in combination with Saccharomyces cerevisiae for the production of Chenin blanc wine. S. Afr. J. Enol. Vitic. 24, 63-69. [ Links ]
Jolly, N.P., Varela, C. & Pretorius, I.S., 2014. Not your ordinary yeast: Non-Saccharomyces yeasts in wine production uncovered. FEMS Yeast Res. 14, 215-237. [ Links ]
Kennedy, J.A., 2008. Grape and wine phenolics: Observation and recent findings. Cien. Inv. Agr. 2, 107-120. [ Links ]
Lea, A.G.H. & Piggott, J.R., 1995. Fermented beverages production. J. Chem. Technol. Biotechnol. 65, 395-412. [ Links ]
Lesschaeve, I. & Noble, A.C., 2005. Polyphenols: Factors influencing their sensory properties and their effects on food and beverage preferences. Am. J. Clin. Nutr. 81, 330S-335S. [ Links ]
Liazid, A., Barbero, G.F., Palma, M., Brigui, J. & Barroso, C.G., 2010. Rapid determination of simple polyphenols in grapes by LC using a monolithic column. Chromatographia 72, 417-424. [ Links ]
Lleixá, J., Manzano, M., Mas, A. & Del C. Portillo, M., 2016. Saccharomyces and non-Saccharomyces competition during microvinification under different sugar and nitrogen conditions. Front. Microbiol. 7, 1-10. [ Links ]
Lorrain, B., Chira, K. & Teissedre, P.-L., 2011. Phenolic composition of Merlot and Cabernet Sauvignon grapes from Bordeaux vineyard for the2009 vintage: Comparison to 2006, 2007 and 2008 vintages. Food Chem. 126, 1991-1999. [ Links ]
Marais, J., 2003. Overview of Chenin blanc research. Wynboer. viewed from http://www.wynboer.co.za/recentarticles/1203chenin.php3, on the 11 June 2014. [ Links ]
Minnaar, P.P., Ntushelo, N.S., Ngqumba, Z., Van Breda, V. & Jolly, N.P., 2015. Effect of Torulaspora delbrueckii yeast on the anthocyanin and flavanol concentrations of Cabernet Franc and Pinotage wines. S. Afr. J. Enol. Vitic. 36, 50-58. [ Links ]
Moreno, D., Vilanova, M., Gamero, E., Intrigliolo, D.S., Talaverano, M.I., Uriarte, D. & Valdés, E., 2015. Effects of preflowering leaf removal on phenolic composition of Tempranillo in the semiarid terroir of Western Spain. Am. J. Enol. Vitic. 66, 204-211. [ Links ]
Nelson, C.C., Kennedy, J.A., Zhang, Y. & Kurtural, S.K., 2016. Applied water and rootstock affect productivity and anthocyanin composition of Zinfandel in central California. Am. J. Enol. Vitic. 67, 18-28. [ Links ]
Robinson, A.L., Boss, P.K., Solomon, P.S., Trengove, R.D., Heymann, H. & Ebeler, S.E., 2014. Origins of grape and wine aroma. Part 1: Chemical components and viticultural impacts. Am. J. Enol. Vitic. 65, 1-24. [ Links ]
Romano, P., Fiore, C., McRae, J.M. & Kennedy, J.A., 2011. Wine and grape tannin interactions with salivary proteins and their impact on astringency: A review of current research. Molecules 16, 2348-2350. [ Links ]
SAS Institute, Inc., 1999 (1st ed). SAS/STAT user's guide, Version 9. SAS Institute Inc, SAS Campus Drive, Cary, North Carolina, 27513. [ Links ]
Stefova, M., Stafilov. T. & Kulevanova. S., 2003. HPLC Analysis of flavonoids. In: Encyclopedia. Marcel Dekker Inc., Skopje, pp. 113 - 119. [ Links ]
Taillandier, P, Lai, Q.P., Julien-Ortiz, A. & Brandam, C., 2014. Interactions between Torulaspora delbrueckii and Saccharomyces cerevisiae in wine fermentation: Influence of inoculation and nitrogen content. World J. Microbiol. Biotechnol. 30, 1959-1967. [ Links ]
Tromp, A. & Conradie, W.J., 1979. An effective scoring system for sensory evaluation of experimental wines. Am. J. Enol. Vitic. 30, 278-283. [ Links ]
Van Breda, V., Jolly, N. & Van Wyk, J., 2013. Characterisation of commercial and natural Torulaspora delbrueckii wine yeast strains. Int. J. Food Microbiol. 163, 80-88. [ Links ]
Velázquez, R., Zamora, E., Álvarez, M.L., Hernández, L.M. & Ramirez, M., 2015. Effects of new Torulaspora delbrueckii killer yeasts on the must fermentation kinetics and aroma compounds of white table wine. Frontiers Microbiol. 6, 1-11. [ Links ]
Submitted for publication: January 2017
Accepted for publication: April 2017
Acknowledgements: The authors would like to thank the ARC Infruitec-Nietvoorbij, Winetech and the National Research Foundation of South Africa, for funding (THRIP programme, grant number UID 71526 and 86086). The opinions, findings and conclusions expressed in this publication are those of the authors. The National Research Foundation accepts no liability in this regard
* Corresponding author: E-mail address: minnaarp@arc.agric.za

