


Services on Demand
Article
 English (pdf)
 Article in xml format
 Article references
Indicators

Related links
-
 Cited by Google
 -
 Similars in Google
Share

 Permalink
South African Journal of Enology and Viticulture
On-line version ISSN 2224-7904
Print version ISSN 0253-939X
S. Afr. J. Enol. Vitic. vol.38 n.1 Stellenbosch 2017
ARTICLES
Influence of different phenolic fractions on red wine astringency based on polyphenol/protein binding
M. RenI; X. WangI, *; G. DuII; C. TianI; J. ZhangI; X. SongI; D. ZhuI
ICollege of Food Engineering and Nutritional Science, Shaanxi Normal University, Xi'an 710062, China
IISchool of Biological and Environmental Engineering, Xi'an University, Xi'an 710065, China
ABSTRACT
The presence of phenolic compounds can make a great contribution to the perception of astringency in red wines based on their interactions with proteins. Human salivary protein and bovine serum albumin were used in this study to investigate the relationship between astringency and polyphenol composition. The interactions between polyphenols and proteins were analysed by means of electrophoresis and fluorescence spectra, and they were further confirmed by sensory analysis. The results indicate that a positive correlation existed among the percentage of polymeric proanthocyanidins and the total phenols. Additionally, astringent wine was generally identified as having a high percentage of polymeric fragments. In comparison with other fractions, polymeric fractions exhibited the highest affinity for protein, and thus the highest astringency.
Key words: Astringency, red wine, polyphenols, polymerisation
INTRODUCTION
Phenolic compounds are partly responsible forthe organoleptic properties of wine, including the colour, astringency and bitterness, as well as for the physiological effects (Monagas et al., 2003). These compounds can be categorised as flavonoids (flavonols, flavan-3-ols and anthocyanins) and non-flavonoids (stilbenes, hydroxycinnamic acids and benzoic acids) (Obreque-Slier et al., 2010).
Red wine represents a very rich source of phenolic compounds, especially flavanols, monomers, as well as oligomeric and polymeric proanthocyanidins (Mattivi et al., 2009). The majority of phenolic compounds are extracted from grape seeds and skins during the fermentative maceration process in winemaking. Grape seed tannins consist of mainly catechin and epicatechin, with the degree of polymerisation (DP) ranging from 2 to 17 (Mcrae & Kennedy, 2011). Skin tannins have a higher average DP than seed tannins and are composed of procyanidins and prodelphinidins (Travaglia et al., 2011). The sizes of skin tannins have been reported to be within the DP range of 3 to 83. Several studies have shown that saliva protein appears to have a higher affinity for condensed tannins than for hydrolysable tannins, and for polymers over monomers. Increasing the DP of phenolic compounds increases their ability to precipitate proteins, as well as their relative astringency, up to a given degree of polymerisation (Vidal et al., 2003; Cheynier et al., 2006; Bajec & Pickering, 2008: Rinaldi et al., 2010).
Astringency, an essential characteristic of red wine, refers to "the complex of sensations due to shrinking, drawing or puckering of the epithelium as a result of exposure to substances such as alums or tannins" (Gawel, 1998). Different mechanisms have been proposed for astringency, such as the disruption of oral lubrication coatings, the inhibition of sodium ion channels on the oral epithelia, and a three-stage model of the interaction between tannins and proteins (Simon et al., 1992; Lee et al., 2012; Ma et al., 2014). It is generally accepted thus far that interactions between saliva proteins and tannins play a significant role in astringency. The most direct assessment method of astringency appears to be sensory analysis, through which the testers can perceive the physiological response. Nevertheless, as this method contains a certain degree of subjectivity, it is hard to guarantee the accuracy and repeatability of the method. In reference to the mechanism of astringency, dynamic light scattering methods (DLS), nuclear magnetic resonance (NMR) and mass spectrometry (MS) have been applied to evaluate the intensity of astringency (Simon et al., 2003; Poncetlegrand et al.; 2006, Scollary et al., 2012). It is difficult to evaluate the perception of astringency by taking into account only one of the proposed methods. In this context, the interactions between polyphenols and proteins were evaluated by electrophoresis and fluorescence spectra, and they were further confirmed by sensory analysis. More specifically, the main objectives of this study were to investigate the relationship between astringency and the polyphenol composition, and then to evaluate the impact of different phenolic fractions on the astringency of red wine samples.
MATERIALS AND METHODS
Reagents
Bovine serum albumin (BSA), p-dimethylaminocinnamal-dehyde (DMACA), and Folin-Ciocalteu's phenol reagent were all purchased from the Sigma Chemical Co. (St. Louis, MI, USA). The SDS-PAGE kit was purchased from Shanghai Solarbio Bioscience & Technology Co., Ltd (Shanghai, China).
Fractionation of phenolic compounds by solid-phase extraction
Twenty millilitres of wine was fractionated by utilising Waters C18 Sep-Pak cartridges according to the method of Sun et al. (1998), with slight modifications. The cartridges were conditioned by rinsing with 10 mL of methanol and 20 mL of distilled water. After conditioning, the cartridges were loaded with the sample and washed with 10 mL of distilled water, 25 mL of ethyl acetate and 15 mL of methanol. The wine could be separated into three fractions by different organic solvents: F1 (phenolic acids), F2 (monomeric flavan-3-ols and oligomeric proanthocyanidins) and F3 (polymeric proanthocyanidins). All fractions were evaporated to dryness (T < 35°C) and dissolved in 10 mL of a model wine solution (5 g/L tartaric acid, 12% v/v ethanol, adjusted to a pH of 3.6 with 1 mol/L NaOH).
The total phenols and total flavanols of samples
The total phenolic content of the wine samples and three fractions was measured by the Folin-Ciocalteu method (Singleton & Rossi, 1964). The absorbance was determined at 765 nm using gallic acid (GAE) as a standard. The total flavanol content was determined by absorptiometry at 640 nm using 0.1 mL of sample and 3 mL of 0.1% DMACA solution (0.1% in 1 mol/L HCl in methanol) (Meng et al., 2012). The results were expressed as catechin equivalents (CTE).
The evaluation of astringency
Sodium dodecyl sulphate polyacrylamide gel electrophoresis (SDS-PAGE)
Human saliva (HS) was obtained by mixing saliva samples from four healthy, non-smoking individuals (two males and two females) between 10:00 and 11:00. Before saliva collection, the volunteers are not permitted to consume any beverages or food for 2 h. The resulting mixture was centrifuged for 10 min at 10 000 g to remove any insoluble material, and the supernatant was referred to as HS (Bacon & Bacon, 2000; Rinaldi et al., 2012).
After binding for 5 min at 25°C, interaction mixtures (300 uL of HS and 150 uL of sample) were centrifuged at 10 000 g for 10 min. The supernatant was mixed with an equal volume of 2 x electrophoresis sample buffer (1 mol/L Tris-HCl, 4% SDS, 20% glycerol, 0.2 mol/L DTT, 0.1% bromophenol blue, pH 6.8), heated at 100°C for 5 min, and analysed by SDS-PAGE using 12% acrylamide resolving gel and 5% acrylamide stacking gel. The gel was run at 100 V for the stacking gel and 120 V for the resolving gel. The gel was then stained with Coomassie brilliant blue R250 (0.1% in 45% methanol and 10% acetic acid) and de-stained in a mixture of acetic acid, methanol and deionised water (10:10:80) (Gambuti et al., 2011; 2013).
The SPI (salivary protein precipitation index), an index evaluating the precipitation abilities of phenolic compounds with HS, was obtained by calculating the percentage of reduction in the optical density of two bands (at 54 to 59 kDa and at 15 kDa) after interacting with the samples (Rinaldi et al., 2015).
Fluorescence spectrum
BSA was diluted to 1.0 χ 10-6 mol/L in 1 mol/L Tris-HCl buffer (pH 7.4) and 0.1 mol/L NaCl. Two hundred microliters of an appropriately diluted (wine 1 000-fold, F1, F2 and F3 10-fold) sample was added to 3 mL of 1.0 χ 10-6 mol/L BSA with sufficient mixing. After reacting at room temperature for 5 min, the fluorescence spectra were recorded on a 970CRT fluorescence spectrophotometer using 5.0 nm excitation and 10.0 nm emission slit widths. Samples were scanned at emission wavelengths from 285 to 450 nm, and the fluorescent intensity was determined under excitation at 280 nm (Le Moigne et al., 2008; Pinto et al., 2010).
Sensory evaluation
The sensory characteristics of the wines were evaluated by a trained panel of 11 judges with rich experience in taste tests. The panellists were provided with 30 mL of wine at room temperature (18°C to 20°C) in standardised tasting glasses, labelled with random three-digit numbers. All samples were expectorated and tap water was provided for mouth-rinsing between samples. The wines were evaluated in triplicate by each panellist. A 4-min break was taken between samples. The intensity of astringency was evaluated using a 14-point scale (1: null; 14: very strong) (Ferrer-Gallego et al., 2010; Stamatina et al., 2015).
Statistical analysis
The results are expressed as the mean ± standard deviation of three repetitions. One-way analysis of variance (ANOVA) was performed to verify significant differences at P < 0.05 using DPS7.05 (Hangzhou Reifeng Information Technology Co., Ltd, Hangzhou City, Zhejiang Province). Additionally, linear correlations were calculated between the percentages of the three fractions and the total phenols of red wines.
RESULTS
The content and composition of the phenolic compounds of red wines
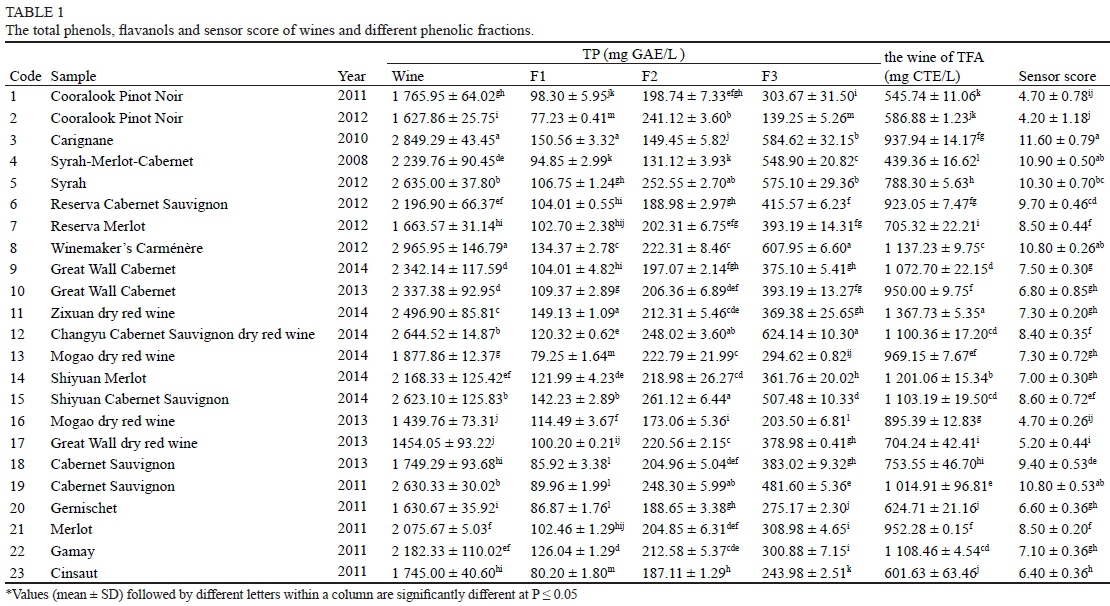
The total phenolic (TP) content and total flavanols (TFA) of the wines can be seen in Table 1 and Fig. 1A. TP and TFA values determined in the tested wines were found to vary from 1 439.76 mg GAE/L to 2 965.95 mg GAE/L and from 439.36 mg CTE/L to 1 367.73 mg CTE/L respectively.
Additionally, the percentages of the three different phenolic fractions were calculated by dividing the TP of each fraction by the sum of the three parts. As shown in Fig. 1B, the total percentages of F1 and F2 were found to range from 29.16% to 69.57%. Furthermore, wines 2 and 16 were observed to exhibit a lower proportion of F1 + F2 together with the weaker astringency intensity. The sensory scores for astringency obtained for those wines were 4.20 and 4.70 respectively. In contrast, significantly higher proportions of F1 + F2 were observed in wines with insufficient polyphenols (for example, samples 2, 13, 16 and 23). The proportion of F3 increased progressively from 30.43% to 70.84%. More specifically, a significantly higher percentage of F3 was found in wines 3 and 4 (66.09% and 70.84% respectively). Alternatively, wines 3 and 4 had the strongest astringency ratings, with scores of 11.6 and 10.90. Interestingly, the percentage of F3 was far predominant over F1 + F2 in phenol-rich wines (for example, wines 3, 4, 8 and 12).
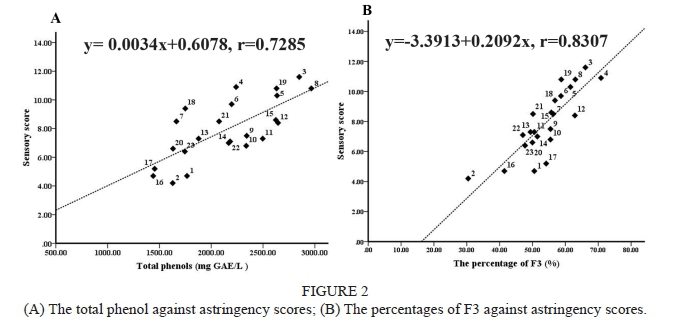
To better state the correlation between the percentages of F3 and sensory scores of red wines, Fig. 2A presents the regression coefficients and equations. To some extent there was positive correlation between the percentage of F3 and the sensory score, and their correlation coefficient was 0.8307. Total phenols also possessed a certain positive correlation with the sensory score (r = 0.7285), as illustrated in Fig. 2B. By comparing the correlation coefficients, the correlation between the percentage of F3 and the sensory scores was higher than that of total phenols.
SDS-PAGE
An obvious decrease in the optical density was detected in all wines, and the SPI values ranged from 41.42% to 91.50%. As expected, these wines showed different binding capacities with HS. With regard to the different degrees of fractions, F3 possessed the highest SPI, with an average level of 58.36%. In addition, values for optical density after interacting with HS were significantly higher in both F1 and F2. The average reduction percentages were 36.50% in F1 and 36.45% in F2. Nevertheless, it is still not clear which one possesses a stronger affinity for saliva protein. Higher SPI values of F1 were observed for samples 16 and 21. The situation is reversed in samples 18 and 23.
Fluorescence spectrum
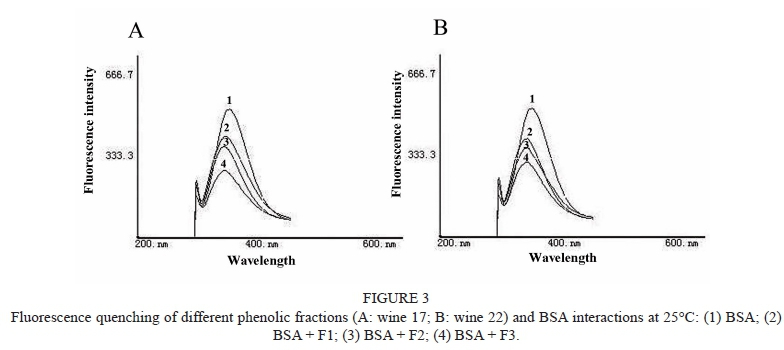
Fig. 3 shows the fluorescence emission spectra of BSA in the presence of wines Fl, F2 and F3 at 25°C. The fluorescence intensity of BSA in the absence of samples at the emission maximum (335 nm) was approximately 541.68. It was observed that, for BSA, there was a noticeable decrease in the fluorescence intensity upon binding to Fl, F2 and F3. As better shown in Fig. 3, F3 exhibited a significantly stronger function of quenching the fluorescence of BSA than the other fractions. Among a portion of those samples (for example 19 and 23), the intensity decreased in the order F1 > F2 > F3, which means that F2 possessed a higher affinity for BSA than F1. However, in other samples (for example 18 and 21), the change in the fluorescence intensity of BSA during the addition of F1 was higher than for F2. These results are in agreement with the findings of SDS-PAGE.
DISCUSSION
Astringency, an important attribute of red wine, has been shown to be dependent on the ethanol concentration, pH and polysaccharose, and especially the concentration and composition of phenols (Gawel, 1998). In this study, general analytical parameters, including the TP and TFA, demonstrated that wine enriched with polyphenols exhibited higher total flavanol contents.
The vast majority of polyphenols in red wines are derived from grape seeds and skins. Seed tannins differ from skin tannins largely by their lower mean degree of polymerisation and the absence of prodelphinidins (Brossaud et al., 2001). Several reports have demonstrated that the degree of polymerisation of polyphenols is associated with their binding capacity with protein and the perceived astringency (Gambuti et al., 2006). To better explore the relationship between the concentrations of different phenolic fractions and astringency, each wine was generally separated into the following three fractions: phenolic acids; monomeric flavan-3-ols and oligomeric proanthocyanidins; and polymeric proanthocyanidins. Furthermore, the TP and TFA in the fractions were determined. With regard to these fractions, polymeric proanthocyanidins exhibited the highest TP and TFA values and accounted for the highest proportion of polyphenol concentration in polyphenol-rich wines (except in wine 2). As expected, from comparing these results and the sensory analysis data, astringent wine was identified to present a high percentage of polymeric proanthocyanidins. Also, by comparing the correlation coefficient, the correlation between the percentage of F3 and the sensory scores was higher than that of total phenol. In previous reports, the intensity of astringency has been demonstrated to be highly positively correlated to total phenols. Nevertheless, according to Fernandez et al. (2007), although Carménère wines have a higher proanthocyanidin concentration than Cabernet Sauvignon wines, the latter wines were perceived as more astringent. The low seed/skin proportion in Carménère wines compared to other varieties, and the greater amount of epigallocatechin subunits, could explain this phenomenon. Alternatively, our results are consistent with the findings of Vidal et al. (2003), who indicated that polymeric proanthocyanidins could be the main contributors to the perception of astringency in wine.
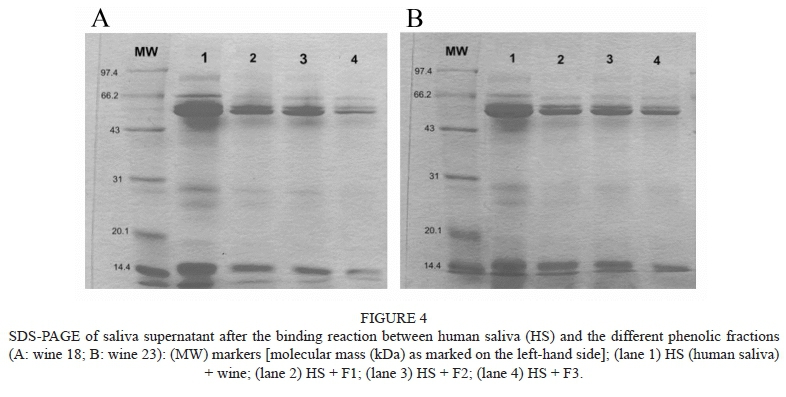
Protein-polyphenol interactions commonly cause the perception of astringency present in red wines. Based on this mechanism, several techniques and methods, including high performance liquid chromatography, nuclear magnetic resonance (NMR) and electrophoresis, have been applied to investigate astringency. Since fluorescence spectra and electrophoresis possess the advantage of being simple and convenient, they are the most common and reliable approaches to evaluate the intensity of astringency. A large number of experiments have demonstrated that the perceived astringency of red wine is correlated with the percentage of band protein reduction of the salivary proteins. Rinaldi et al. (2010) evaluated the astringent capacity of wines enriched with commercial tannins (CTs) by SDS-PAGE and demonstrated that the wine matrix influenced the astringency of CTs. Furthermore, et al. (2015) carried out fluorescence and ultraviolet spectroscopic evaluation of phenolic compounds, antioxidants and binding activities in some kiwi fruit cultivars. Fewer studies are available on the role played by different phenolic fractions in wine astringency using the methods of electrophoresis and fluorescence spectra. The comparison of the salivary protein electrophoretogram after reacting with three different phenolic fractions (Fig. 4) shows that the decrease in band density for F3 is more evident than for F1 and F2. At the same time, the polymeric proanthocyanidins were found to possess higher SPI than the other fractions. This conclusion is corroborated by the findings of fluorescence spectral measurements, which show that polymeric fractions exhibit a significantly stronger quenching of the fluorescence of BSA.
CONCLUSIONS
In summary, a positive correlation was observed among the percentages of polymeric proanthocyanidins and the total phenols. Moreover, the results indicate that astringent wines generally showed high percentages of polymeric fragments. Three different phenolic fractions exhibited different effects on the perception of astringency. Specifically, polymeric proanthocyanidins presented the strongest binding affinity for proteins and, relatively, the highest astringency.
LITERATURE CITED
Bacon, J.R. & Bacon, M.J.C., 2000. Binding affinity of hydrolyzable tannins to parotid saliva and to proline-rich proteins derived from it. J. Agric. Food Chem. 48, 838-843. [ Links ]
Bajec, M.R. & Pickering, G.J., 2008. Astringency: Mechanisms and perception. Crit. Rev. Food Sci. Nutr. 48, 858-75. [ Links ]
Brossaud, F., Cheynier, V. & Noble, A.C., 2001. Bitterness and astringency of grape and wine polyphenols. Aust. J. Grape Wine Res. 7, 33-39. [ Links ]
Cheynier, V., Duenas-Paton, M., Salas, E., Maury, C., Souquet, J.-M., Sarni-Manchado, P. & Fulcrand, H., 2006. Structure and properties of wine pigments and tannins. Am. J. Enol. Vitic. 57, 298-305. [ Links ]
Fernandez, K., Kennedy, J.A. & Agosin, E., 2007. Characterization of Vitis vinifera L. cv. Carménère grape and wine proanthocyanidins. J. Agric. Food Chem. 55, 3675-3680. [ Links ]
Ferrer-Gallego, R., Garcia-Marino, M., Hernandez-Hierro, J.M., Rivas- Gonzalo, J.C. & Escribano-Bailon, M.T., 2010. Statistical correlation between flavanolic composition, colour and sensorial parameters in grape seed during ripening. Anal. Chim. Acta 660, 22-28. [ Links ]
Gambuti, A., Rinaldi, A., Lisanti, M.T., Pessina R. & Moio, L., 2011. Partial dealcoholisation of red wines by membrane contactor technique: Influence on colour, phenolic compounds and saliva precipitation index. Eur. Food Res. Technol. 233, 647-655. [ Links ]
Gambuti, A., Rinaldi, A., Pessina, R. & Moio, L., 2006. Evaluation of Aglianico grape skin and seed polyphenol astringency by SDS-PAGE electro- phoresis of salivary proteins after the binding reaction. Food Chem. 97, 614-620. [ Links ]
Gambuti, A., Rinaldi, A., Ugliano, M. & Moio, L., 2013. Evolution of phenolic compounds and astringency during aging of red wine: Effect of oxygen exposure before and after bottling. J. Agric. Food Chem. 61, 1618-1627. [ Links ]
Gawel, R., 1998. Red wine astringency: A review. Aust. J. Grape Wine Res. 4, 74-95. [ Links ]
Le Moigne, M., Dufour, E., Bertrand, D., Maury, C., Seraphin, D. & Jourjon, F., 2008. Front face fluorescence spectroscopy and visible spectroscopy coupled with chemometrics have the potential to characterise ripening of Cabernet Franc grapes. Anal. Chim. Acta 621, 8-18. [ Links ]
Lee, C.A., Ismail, B. & Vickers, Z.M., 2012. The role of salivary proteins in the mechanism of astringency. J. Food Sci. 77, C381-C387. [ Links ]
Ma, W., Guo, A., Zhang, Y., Wang, H., Liu, Y. & Li, H., 2014. A review on astringency and bitterness perception of tannins in wine. Trends Food Sci. Tech. 40, 6-19. [ Links ]
Mattivi, F., Vrhovsek, U., Masuero, D. & Trainotti, D., 2009. Differences in the amount and structure of extractable skin and seed tannins amongst red grape varieties. Aust. J. Grape Wine Res. 15, 27-35. [ Links ]
McRae, J.M. & Kennedy, J.A., 2011. Wine and grape tannin interactions with salivary proteins and their impact on astringency: A review of current research. Molecules 16, 2348-2364. [ Links ]
Meng, J.F., Fang, Y.L., Qin, M.Y., Zhuang, X.F. & Zhang, Z.W., 2012. Varietal differences among the phenolic profiles and antioxidant properties of four cultivars of spine grape (Vitis davidii Foex) in Chongyi County (China). Food Chem. 134, 2049-2056. [ Links ]
Monagas, M., Gomez-Cordoves, C., Bartolome, B., Laureano, O. & Ricardo Da Silva, J.M., 2003. Monomeric, oligomeric, and polymeric flavan- 3-ol composition of wines and grapes from Vitis vinifera L. Cv. Graciano, Tempranillo, and Cabernet Sauvignon. J Agric. Food Chem. 51, 6475-6481. [ Links ]
Obreque-Slier, E., Pena-Neira, A., Lopez-Solis, R., Zamora-Marin, F., Ricardo-Da Silva, J.M. & Laureano, O., 2010. Comparative study of the phenolic composition of seeds and skins from Carménère and Cabernet Sauvignon grape varieties (Vitis vinifera L.) during ripening. J. Agric. Food Chem. 58, 3591-3599. [ Links ]
Park, Y.S., Polovka, M., Martinez-Ayala, A.L., González-Aguilar, G.A., Ham, K.S., Kang, S.G., Park, Y.K., Heo, B.G., Namiesnik, J. & Gorinstein, S., 2015. Fluorescence studies by quenching and protein unfolding on the interaction of bioactive compounds in water extracts of kiwi fruit cultivars with human serum albumin. J. Lumin. 160, 71-77. [ Links ]
Pinto, M.D.C., Duque, A.L. & Macías, P., 2010. Fluorescence spectroscopic study on the interaction of resveratrol with lipoxygenase. J. Mol. Struct. 980, 143-148. [ Links ]
Poncetlegrand, C., Edelmann, A., Putaux, J., Cartalade, D., Sarnimanchado, P. & Vernhet, A., 2006. Poly(l-proline) interactions with flavan-3-ols units: Influence of the molecular structure and the polyphenol/protein ratio. Food Hydrocoll., 20, 687-697. [ Links ]
Rinaldi, A., Gambuti, A. & Moio, L., 2012. Application of the SPI (Saliva Precipitation Index) to the evaluation of red wine astringency. Food Chem. 135, 2498-504. [ Links ]
Rinaldi, A., Gambuti, A., Moine-Ledoux, V. & Moio, L., 2010. Evaluation of the astringency of commercial tannins by means of the SDS-PAGE- based method. Food Chem. 122, 951-956. [ Links ]
Rinaldi, A., Iturmendi, N., Jourdes, M., Teissedre, P.-L. & Moio, L., 2015. Transfer of tannin characteristics from grape skins or seeds to wine-like solutions and their impact on potential astringency. LWT - Food Sci. Technol. 63, 667-676. [ Links ]
Scollary, G.R., Pásti, G., Kállay, M., Blackman, J. & Clark, A.C., 2012. Astringency response of red wines: Potential role of molecular assembly. Trends Food Sci. Tech. 27, 25-36. [ Links ]
Simon, C., Barathieu, K., Laguerre, M., Schmitter, J.M., Fouquet, E., Pianet, I. & Dufourc, E.J., 2003. Three-dimensional structure and dynamics of wine tannin-saliva protein complexes. A multitechnique approach. Bio chemistry 42, 10385-10395. [ Links ]
Simon, S.A., Hall, W.L. & Schiffman, S.S., 1992. Astringent-tasting compounds alter ion transport across isolated canine lingual epithelia. Pharmacol. Biochem. Behav. 43, 271-283. [ Links ]
Singleton, V.L. & Rossi, J.A., 1964. Colorimetry of total phenolics with phosphomolybdic-phosphothungstic acid reagents. Am. J. Sci. Food Agric., 16, 144-158. [ Links ]
Stamatina, K., Yorgos, K., Maria, K., Niki, P., Argirios, T. & Garifalia, K., 2015. Analytical phenolic composition and sensory assessment of selected rare Greek cultivars after extended bottle ageing. J. Sci. Food Agric. 95, 1638-1647. [ Links ]
Sun, B., Leandro, C., Ricardo-Da Silva, J.M. & Spranger, I., 1998. Separation of grape and wine proanthocyanidins according to their degree of polymerization. J. Agric. Food Chem., 46, 1390-1396. [ Links ]
Travaglia, F., Bordiga, M., Locatelli, M., Coisson, J.D. & Arlorio, M., 2011. Polymeric proanthocyanidins in skins and seeds of 37 Vitis vinifera L. cultivars: A methodological comparative study. J. Food Sci. 76, C742-C749. [ Links ]
Vidal, S., Francis, L., Guyot, S., Marnet, N., Kwiatkowski, M., Gawel, R., Cheynier, V. & Waters, E.J., 2003. The mouth-feel properties of grape and apple proanthocyanidins in a wine-like medium. J. Sci. Food Agric. 83, 564-573. [ Links ]
Submitted for publication: August 2016
Accepted for publication: December 2016
Acknowledgements: This work was supported by the National Nature Science Foundation (Project 31301526), the Scientific Research Project of Shaanxi (Project 2014JQ2-3015), the Operation Expenses for Universities' Basic Scientific Research of Central Authorities (Project GK201402041), the Modern Agricultural Innovation Plan in Xi'an (Project NC1318) and Fundamental Research Funds for the Central Universities (2016CSY017)
* Corresponding author: E-mail address: wangxiaoyu@snnu.edu.cn

