


Services on Demand
Article
 English (pdf)
 Article in xml format
 Article references
Indicators

Related links
-
 Cited by Google
 -
 Similars in Google
Share

 Permalink
South African Journal of Enology and Viticulture
On-line version ISSN 2224-7904
Print version ISSN 0253-939X
S. Afr. J. Enol. Vitic. vol.38 n.1 Stellenbosch 2017
ARTICLES
An analysis of seed colour during ripening of cabernet sauvignon grapes
C. FredesI, *; M. MoraII; M. Carrasco-BenavidesI
IDepartment of Agricultural Sciences, Universidad Católica Maule, Curicó, Chile
IIDepartment of Computer Science, Universidad Católica Maule, Talca, Chile
ABSTRACT
This case study examines seed colour during ripening using an exhaustive colorimetric analysis. The aim was to associate the chemical ripening with the seed colour in order to estimate the ripening stages of Cabernet Sauvignon grapes. Cluster samples, obtained from a vertical shoot-positioned vineyard in central Chile, were monitored for their technological and phenolic maturity, as well as for the colorimetric and chemical characteristics of the seeds. The colours of the scanned seed images were determined by human as well as by computer vision. In the first case, an expert assigned a colour to each seed part. In the second case, a computer program estimated the colours of the scanned seed images. An exhaustive analysis of seed colour was proposed, instead of a general observation of seed browning. The seed colour presented a wide range of colours, from moss green to dark brown, depending on the maturity and the face observed. The ripening stages identified, along with the chemical and colorimetric information gathered, were under ripe seed (brown with green traces), ripe seed (dark brown with green traces) and overripe seed (dark brown without any green traces). A new way to quantify seed colour is shown in this paper.
Key words: Grapevines, computer vision, maturity, colour
INTRODUCTION
The estimation of harvest maturity is still a challenge for researchers: recent studies have attempted to predict harvest dates using climatic data (Sadras & Petrie, 2012), precision agriculture (Schoedl et al., 2012) or consumer preferences for different harvest dates (Bindon et al. 2013; 2014). The harvest date decisively affects the resulting wine. Gonzalez-Barreiro et al. (2014) highlighted molecular variations, along with harvest dates, that affect the flavour balance of wine berries. Furthermore, in the corresponding wines, desirable yeast-derived metabolites increased as the ripening progressed, while other, undesirable volatile metabolites decreased at the same time (Bindon et al., 2013). Achieving phenolic maturity is a strong reason to delay the harvest, even after technological maturity occurs; in addition, climate change accentuates the delay between technological maturity and phenolic maturity (Meléndez et al., 2013). Bindon et al. (2013) highlighted that consumers preferred Cabernet Sauvignon wines from grapes harvested later. However, late-harvested Cabernet Sauvignon grapes can suffer from malodours and climate risks that can potentially decrease wine quality (Pszczolkowski et al., 2001). Fine red wines are often harvested late and thus make it necessary for the wine industry to use complementary harvest criteria during the final ripening period. When the changes in colour are subtle, the over-maturation risks remain latent and the subjective criteria of oenologists sometimes prevail over other criteria.
A pioneering and simple harvest maturity criterion was proposed by Ristic & Iland (2005), who noted that seed colour is related to the overall berry maturity and therefore proposed a seed colour chart for human observation in order to estimate maturity in Syrah. Following the same line, Fredes et al. (2010) proposed a seed colour wheel for Carmenere seeds. In this scale, the colour moves from green to dark brown because of the oxidation during ripening (Kennedy et al., 2000). Thus, harvest maturity should take place when seeds achieve a very dark brown seed colour (Ristic & Iland, 2005, Fredes et al., 2010). At the other end of the seed colour scale, the seeds can still present green traces, even at advanced stages of ripening. Thus, oenologists do not even consider starting the harvest and then arguing that the green seeds transferred all the green characteristics to the wine. Rousseau and Delteil (2000) indicated tasting problems related to the astringency of seeds with green traces, but there are no colour charts that consider the green colour of the seeds as a harvest indicator.
Seed maturity is a controversial concept because oenologists often wait too long for the grapes to reach this hypothetical maturity stage and excessively delay the harvest without achieving any advantages. Casassa et al. (2013) suggested that delaying harvest to achieve seed browning may be a relatively lesser factor affecting tannin extraction during maceration. This controversy springs from a confusion between seed browning and seed maturity; the former is related to a chemical composition as well as to representative colour, and the latter to acoustic and mechanical properties (Torchio et al., 2012), seed texture (Le Moigne et al., 2008), chemical properties (Kennedy et al., 2000), as well as seed colour properties (Ristic & Iland, 2005).
The seeds present a wide range of colours, from moss green to dark brown, depending on the maturity, the face examined and the part observed. Furthermore, each seed part turns brown at different times during ripening (Ristic & Iland, 2005, Cadot et al., 2006). Nevertheless, studies regarding seed colour are based on a representative average. A good description of ripe grapevine seeds was elaborated by Bondada & Keller (2012), as follows: "pear-shaped geometry, rough surface, a pair of distinctive ventral infolds (also known as fossettes, seed folds, or rumination ingrowth), a centrally positioned dorsal chalaza knot, a prominent longitudinal ridge, known as keel or karina between the fossettes, a raphe lengthened along the keel, passing through the apical notch, ending with the chalaza on the dorsal side, a beak of varied appearance characteristics". The dominant colour of ripe seeds is dark brown on the chalaza, karina and both lateral sides. Secondarily, the light brown or moss-green colour is found in the fossettes and on the upper dorsal and ventral beak, in the form of a ring (see a ripe seed in Fig. 1).
Human observation presents certain inconsistencies in assigning colours, for example the appearance of the colour of an object changes with the colour of the surrounding areas, with the observer's state of adaptation to light and darkness, and with the amount of lighting. These phenomena produce a distortion of the object's true colour, resulting in subjective appreciations (Foster, 2011). An alternative to this subjective, human observation of seeds was proposed by Rodríguez-Pulido et al. (2012b), who automated the colour assignment of the Vitis vinifera seeds by incorporating computer vision techniques. Nevertheless, this technology has not yet been capable of detecting any colour differences in lapses shorter than a month during ripening (Avila et al., 2014; Rodríguez-Pulido et al. 2012b). Furthermore, computer vision technology requires some very expensive hardware, such as cameras with a diffuse-light anti-shadow chamber, as well as specific software to define the representative seed colour (Rodríguez-Pulido et al., 2012b). A recent series of studies developed at the Universidad Catolica del Maule (Chile) (Avila et al., 2014; Oyarce, 2014; Zuniga et al., 2014; Ávila et al., 2015) proposed a simple computing methodology to capture images with a simple scanner and a digital seed colour scale to define seed colours by image treatment and pattern recognition (Gevers & Smeulders, 1999). However, this methodology has not yet been associated with the chemical parameters usually employed in assessing grape ripening. The present study aims to fill this gap.
The colour of the scanned seed images was analysed according to both computer as well as human vision. Human observation allows the assignment of different colours to each seed part instead of using a single representative colour for the whole seed. Computer vision allows the analysis of specific colours related to ripeness. This is the first attempt to study seed colour by combining computer vision and human vision drawn from scanned images of seeds (Ávila et al., 2015). The aim was to associate the chemical ripening with the seed colour in order to estimate the ripening stages in Cabernet Sauvignon grapes.
MATERIALS AND METHODS
Grape sampling
This study was carried out in a self-rooted Cabernet Sauvignon vine clone 337 vineyard in Central Chile during the 2013 season. The adapted training system was vertically shoot positioned and the vines were drip irrigated. A total of 400 g of lateral bunches of clusters from 600 vines were randomly collected for each sampling date. The selected vines had the same vegetative vigour, as determined by the trunk diameter and canopy volume. In the case of the computer vision experiment, the sampling was carried out at seven-day intervals from the start of véraison up to 56 days after véraison (DAV); after that date, the sampling was carried out every three days. In the case of the human observation experiment, the sampling was carried out at seven-day intervals only from 56 to 91 DAV. The collected samples were transported to the Agronomy Laboratory at the Universidad Catolica del Maule (Chile) in a cooler in order to carry out the analysis.
Image scanning
The scanner is a simple device used to register images in a relatively controlled environment in order to obtain the same lighting conditions. A Canon MP-280 scanner with a resolution of 600 DPI was used for this study. For the computer vision analysis the seeds were removed from the berries immediately before scanning and plunged in a 10% metabisulphite solution in order to stop the oxidation processes and detect the seed colour more clearly at the moment of fruit picking. In the case of the human observation analysis, the observations were carried out on fresh and just-harvested seeds in order to emulate the observation process of the oenologists. The scanner analysis was performed on 100 to 200 seeds for both seed groups; the seeds were chosen randomly from the samples. No Botrytis, mould or powdery mildew was observed in any of the samples.
Seed colour analysis by human observation
To perform the human observation of colour by part, the scanned seed images were edited using the image editor, Paint for Windows ® (Microsoft Corporation, Redmond, Washington, USA). Once the images had been obtained, the first step was to randomly select 40 seeds from the scanned images. The second step was to enlarge the images of the selected seeds. The third step was to separate the seeds by parts: enveloping circle of the chalaza, chalaza, fossettes, the entire dorsal face and the karina. The fourth step was to compare each seed part by human observation with the seed colour wheel of Fredes et al. (2010) in order to assign a nominal colour, from 1 (the greenest) to 11 (the darkest). Fig. 1 graphically shows this process.
Seed colour analysis by computer vision
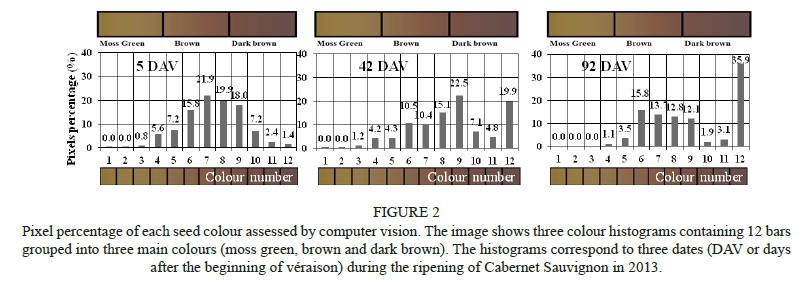
In order to perform computer vision analysis, the scanned images of seeds treated with antioxidant were first processed to solve two defects reported as shadows and highlights. A robust segmentation method, based on Gevers & Smeulders (1999), was applied to the scanned images in order to solve these defects (Oyarce, 2014). After the segmentation step, the seed colour was computed in the CIELab space using the average of the three channels in the colour space. Thereafter, the lowest Euclidian distance was calculated between the real colour and the representative colour in the colour scale of Ávila et al. (2015) in order to assign a nominal colour value (Oyarce, 2014). The MATLAB® program was used to assign a colour to each pixel of the scanned images, and to compute the percentages of the coloured pixels according to the colour scale (see Fig. 2 as reference). Zuniga et al. (2014) describe the algorithms used in the treatment of the scanned seed images.
Chemical analysis of grapes during ripeness
Some of the fresh berries were analysed for soluble solids (°Brix), titratable acidity (g/L tartaric acid) and pH according to traditional chemical analyses (Bordeau & Scarpa, 2000). Other berries were frozen to -18°C and, when thawed, these berries were analysed with the Glories method (Saint Criq de Gaulejac et al., 1998), which delivered the seed maturity index (%), the extractability of anthocyanins (%), the total anthocyanins (mg/L) and the extractable anthocyanins (mg/L). Furthermore, the grape total tannins from the skin and seeds were analysed by the precipitation of tannins with methyl cellulose (Mercurio & Smith, 2006). In addition, the weight of 100 fresh berries was assessed for each sample. The analyses were carried out in triplicate.
Statistical analysis
The following three statistical analyses were carried out with the SPSS software package release 17.0 (IBM Corporation, Armonk, NY, USA)
Linear regression
A total number of 75 points in the Cartesian plane (X, Y) was used to fit the curve and obtain the coefficient of determination (R2) using all the replicates. The X value corresponded to the days after the start of véraison (DAV) and the Y value corresponded to the chemical and physical values aforementioned.
One-way analysis of variance
Data from the human observation experiment was analysed by ANOVA in order to determine the effect of the six harvest dates (56, 63, 70, 77, 84 and 91 DAV) on the colour of the six seed parts (enveloping circle of chalaza, chalaza, fossettes, entire dorsal face and karina). Tukey's multiple comparison test was used to detect which means were different with a level of significance of 5%. The analysis included the nominal colours assigned to the six seed parts that were taken from 40 randomly selected scanned images of the seeds (see Fig. 1 as reference).
Pearson correlation
A Pearson correlation (R) was performed to obtain the degree of correlation between the colour of the scanned images of the seeds treated with antioxidant, defined as a pixel percentage of moss green or dark brown (see Fig. 2 as reference), and the total anthocyanins, extractable anthocyanins, seed maturity index and total grape tannins. A number of 75 points was used in each Pearson correlation, corresponding to 25 sample dates with three replications.
RESULTS AND DISCUSSION
Description of chemical ripening
The technological ripeness was reached at 60 DAV, with acceptable levels of soluble solids (22.5°Brix) and a total acidity (7 g/L of tartaric acid) suitable for making basic wines, but the phenolic maturity occurred afterwards (Saint-Cricq de Gaulejac et al., 1997; Meléndez et al., 2013). Even when the grapes had not yet been harvested, the seeds continued turning brown. The seasonal trend of soluble solid concentration had a logarithmic shape, with the stabilisation at 60 DAV (Fig. 3).
The seasonal trend in berry weight variation and total grape tannin concentration is shown in Fig. 4. The berry weight followed a typical curve that reached its maximum during ripeness and decreased during over-ripening (Ribéreau-Gayon et al., 2006). The grape total tannins presented a slow increase just after the start of véraison and a further continuous decrease when véraison ended (Kennedy et al., 2000) (Fig. 4).
The general trend in the phenols produced by the Glories method during ripening has already been demonstrated by Saint-Cricq de Gaulejac et al. (1997) and Ribéreau-Gayon et al. (2006): the seed maturity index decreases while the anthocyanin concentration increases during ripening. The seed maturity index, which represents the contribution of seed tannins in the grape (Saint-Cricq de Gaulejac et al., 1998), decreased to around 40% at 82 DAV, when the high levels of the extractable anthocyanins (250 mg/L) and total anthocyanins (450 mg/L) reached a plateau. The fruit should be ready to be harvested for fine wines when the seed tannins and skin anthocyanins reach the minimum and maximum concentrations respectively, and this occurred at approximately 82 to 84 DAV (Figs 4 and 5). The high variability of the phenols during ripening found in this study has already been described by Saint-Cricq de Gaulejac et al. (1997) and Ribéreau-Gayon et al. (2006).
Seed colour by human observation
The colours estimated by human vision were significantly different at each of the observation dates as well as for each of the seed parts (Table 1). The seed part that presented the slowest browning was the fossettes, with a green colour that persisted during ripening, turning into a light brown colour only at 84 DAV. The colour of the fossettes ranged between colour numbers 2.2 and 3 (moss-green colour) at the beginning and became light brown (colour number 4) in over-ripeness. The other dorsal face parts, such as the chalaza and karina, turned brown earlier, ranging between colour number 4.9 (light brown) and 8.9 (dark brown). Major colour differences were observed between the seed parts rather than across the entire dorsal seed, implying that a specific observation by parts gives more accurate results than the observation of the entire seed, because the latter often hides important details for the recognition of the maturity stage of the seeds.
Between 63 and 77 DAV, the seeds had green traces in the fossettes (colour numbers 2.92 to 3.83), whereas in the last dates (84 and 91 DAV) the colour green turned to brown (colour numbers 4.0 to 4.38). The notorious contrast between the green tissues of the fossettes, which are surrounded by darker tissues, allowed for a clearer colour assignment. In order to achieve a higher consistency in the determination of a colour, the observation should be focused on the ventral fossettes due to the higher colour contrast in them (Foster, 2011) (Table 1).
Rousseau & Delteil (2000) associated the green tissues of seeds with astringent tannins and advised that harvest should not take place when green traces are present. Using human observation, Ristic & Iland (2005) and Fredes et al. (2010) took into account the average between the dorsal and the ventral colours in order to find a very dark brown seed colour in harvest maturity. In contrast with these general observations of seed browning, this study proposes an observation of the specific colour, as well as of a specific part of the seed.
Seed colours by computer vision
The histograms in Fig. 2 show all of the colours detected in the seeds by computer vision on the three different dates. The most prevailing colour progressively became darker as ripening progressed, moving from light brown, at 5 DAV, to a very dark brown at 92 DAV. The colour scale used in this study was divided into three and 12 parts and delivered new information to understand the colour changes in the seeds.
As indicated by Ristic & Iland (2005), an increase in thickness and hardness of the seeds, as well as a strong browning, was observed with ripening. Fig. 6 shows that, at the beginning of ripening, the green colour presented a dramatic decrease between 4 and 14 DAV. The brown colour was characteristic of the early stages of the ripening process (before 60 DAV), but in advanced maturity the green tissue of the fossettes and of the ring in the upper beak, on the ventral side (see the ventral face of the seed in Fig. 1 as reference), decreased progressively (60 and 93 DAV) (Fig. 6). Ristic and Iland (2005) indicated that, from 60 DAV, the seeds shrink and wrinkle while the air space enveloping them enlarges, triggering the browning. Moreover, due to moisture loss, roughness increased and the raphe, keel, chalaza and fossettes showed an increasing difference between them (Ristic & Iland, 2005). Fig. 6 demonstrates that the dark brown colour increased gradually with ripening and became predominant at the end (93 DAV), except for the light brown colour of the fossettes (Table 1).
In the study of Fredes et al. (2010) on human observation of fresh seeds, changes in seed colour were relatively constant, but during the last stages (50 to 82 DAV) seed colour varied only marginally - by 2% weekly. In this study, the dark brown colour undergoes hardly any variation after 60 DAV (Fig. 6). Kennedy et al. (2000) call the period after berry weight has reached its maximum (60 DAV), "non-programmed oxidation". This ripening period has been characterised by an accumulation of non-anthocyanin glucosides, a levelling in phenolic extraction and composition (Coombe & McCarthy, 2000), complete seed desiccation and rapid seed browning (Kennedy et al., 2000; Ristic & Iland, 2005).
Human vision and computer vision can recognise the absence of the colour green. This leads to the question how many pixel percentage means the disappearance of the green colour from the seeds. Computer vision set the green colour at 1.34% and 0.75% for ripeness and over-ripeness respectively; therefore, the threshold of the green that vanishes from the seed should be between these two levels. Nevertheless, this information must be confirmed with further research.
Relationship between seed colour and grape and seed ripeness
Based on the analysis of technological and phenolic maturity, as well as seed colour, three seed-ripening stages are proposed in this study. The first period, of the "green seed", starts at véraison and finishes at 60 DAV. Ristic & Iland (2005) have indicated that 90 days after flowering (60 DAV) is a critical time at which berry weight is at a maximum and soluble solids are around 21°Brix. The present study also registered maximum berry weight at 60 DPV (Fig. 4).
During ripening, the percentage of dark brown colour increases quickly from the start of véraison and stabilises at around 56% at approximately 60 DAV (Fig. 6). In contrast, the moss-green colour presented a rapid decrease from véraison to 20 DAV, followed by an even slower decline. The light brown colour maintained a much lower change rate than the other two colours, thus it was discarded from further analysis. The results of this study suggest that attention should be paid to the edges of the colour scale (green and dark brown) (Fig. 6).
The "ripe seed period" occurred thereafter, from 60 DAV to 82 DAV. During this time the seed colour turned brown with moss-green traces and the technological maturity was acceptable. However, harvest maturity had not yet been reached; at this point, oenologists must wait to achieve better phenol contents. It is important to highlight that, at the beginning of this period, the seed tannin concentration still was high.
At the end of this stage, the moss-green colour vanished completely from the fossettes (Table 1) and the maximum levels of anthocyanin concentration and the minimum seed maturity index and total grape tannin levels were set (Fig. 5). The transition between the ripe seed period and the overripe period could mark harvest maturity for fine wines.
Finally, the "overripe seed period" started at 82 DAV. At this time a noticeable dark brown colour predominated in the seeds, while soluble solid were concentrated as a result of slight dehydration (Fig. 3) and total anthocyanins decreased slightly (Fig. 5). The rapid seed oxidation in the air space enveloping the seeds produced tannin polymerisation (Ristic & Iland, 2005) and the extinction of the green tissues of the seeds. To delay the harvest at this point will affect the quality and quantity of the crop (Kennedy et al., 2000; Ribéreau-Gayon et al., 2006), alter the metabolic processes during fermentation (Bindon et al., 2014) and increase the risk of grape diseases (Pszczolkowski et al., 2001). In this study, the aforementioned ripening stages of the seeds were synchronised with the ripening stages of the whole berry.
The literature indicates a significant relationship between seed colour and the phenolic composition of berries during ripening. For example, Rodríguez-Pulido et al. (2014) identified coefficients of determination of R2 = 0.73 for the total flavanol content and R2 = 0.85 for the flavanols as assessed by hyperspectral images. Ristic & Iland (2005) also found a relationship between seed colour value and phenols for two seasons, specifically between the average colour and the grape total tannins (R2 = 0.77 and 0.67 in seasons 1 and 2 respectively); colour and total anthocyanins (R2 = 0.88 and 0.83); and colour and skin total phenolics (R2 = 0.85 and 0.82).
The present study makes use of different colours instead of a single representative colour, and the results show that both moss-green and dark brown colours (at opposite ends of the colour chart) were related to the chemical compounds of the grapes. The significant positive relationship between seed browning and anthocyanins in grapes, reported by Ristic & Iland (2005) and Rodríguez-Pulido et al. (2012a), was ratified by this experiment, with highly significant (p < 0.01) Pearson correlations between the dark brown (pixel %) and the total and extractable anthocyanins (mg/l), which were R = 0.82 and 0.83 respectively. Furthermore, there was a significant inverse relationship between the green colour (pixel %) and the anthocyanins (R = -0.76 and R = -0.79 for the extractable and total anthocyanins respectively) and a significant positive relationship between moss green (pixel %) and the seed maturity index (%) (R = 0.66). Moreover, the seed maturity index (%) was negatively related to the dark brown colour (pixel %) (R = -0.71), as also reported by Fredes et al. (2010).
In contrast, no significant relationship between seed colour and grape total tannins emerged (R = -0.36 and 0.31), or between the grape total tannins (mg/g epicatechin gallate) and the dark brown and green colours (pixel %) respectively. This study did not concur with the findings of Ristic & Iland (2005) on seed browning and grape total tannins, possibly because of the increase and further drop of grape total tannins during véraison, as reported by Kennedy et al. (2000), as well as by the high variability of the samples. Ristic & Iland (2005) noted that, when seeds become mature, the phenolic content of grapes can be significantly different, even if associated with similar seed colour values. This variability increases even further in the case of seeds, since there generally are two to four seeds per grape.
A novel computer vision methodology used to estimate the colours of scanned seed images has been developed and tested with promising results; nevertheless, further research is required in order to achieve higher levels of accuracy. Overall, it is worth emphasising that the observation of seed colour serves only as a general criterion for assessing seed and grape maturity, as indicated in Ristic & Iland (2005), and that it constitutes another element in the multidimensional problem of maturity estimation.
CONCLUSIONS
During ripening, the seed colour presents a wide range of colours, from moss green to dark brown, and the presence of these colours depends on the maturity period and face observed. An exhaustive analysis of seed colour was proposed, instead of a general observation of seed browning. Considering the berries' chemical composition, seed maturity was classified into three stages according to seed colour: under-ripe seed (brown with moss-green traces, before 60 DAV), ripe seed (dark brown with small moss-green traces, between 60 and 82 DAV) and overripe seed (dark brown without moss-green traces, post 82 DAV). Grape technological maturity was observed when the seeds still were brown with green traces in the fossettes, whereas overripe grapes implied the disappearance of the green traces from the seeds; this transition could mark the harvest maturity for fine wines.
The computational processing of the scanned images of the seeds allowed for the accounting of all the colours that were present in the seeds, from green to dark brown, by providing information about the pixel percentage of each of the colours present in the seeds.
LITERATURE CITED
Avila, F., Mora, M. & Fredes, C., 2014. A method to estimate grape phenolic maturity based on seed images. Comput. Electron. Agr. 101, 76-83. [ Links ]
Avila, F., Mora, M., Oyarce, M., Zuniga, A. & Fredes, C., 2015. A method to construct fruit maturity colour scales based on support machines for regression: Application to olives and grape seeds. J. Food Eng. 162, 9-17. [ Links ]
Bindon, K., Holt, H., Williamson, P.O., Varela, C., Herderich, M. & Francis, I.L., 2014. Relationships between harvest maturity and wine composition in Vitis vinifera L. cv. Cabernet Sauvignon 2. Wine sensory properties and consumer preference. Food Chem. 154, 90-101. [ Links ]
Bindon, K., Varela, C., Kennedy, J., Holt, H. & Herderich, M., 2013. Relationships between harvest maturity and wine composition in Vitis vinifera L. cv. Cabernet Sauvignon 1. Grape and wine chemistry. Food Chem. 138, 1696-1705. [ Links ]
Bordeau, E. & Scarpa, J., 2000 (2nd ed). Análisis químico del Vino. Ediciones Pontificia Universidad Católica de Chile, Santiago. [ Links ]
Bondada, B. & Keller, M., 2012. Morphoanatomical symptomatology and osmotic behavior of grape berry shrivel. J. Am. Soc. Hort. Sc. 137, 20-30. [ Links ]
Cadot, Y., Mirana-Castello, M.T, & Chevalier, M., 2006. Anatomical, histological and histochemical changes in grape seeds from Vitis vinifera L. cv. Cabernet franc during fruit development. J. Agr. Food Chem. 54, 9206-9215. [ Links ]
Casassa, F., Beaver, C.W., Mireles, M.S., Larsen, R.C., Hopfer, H., Heymann, H. & Harbertson, J.F., 2013. Influence of fruit maturity, maceration length, and ethanol amount on chemical and sensory properties of Merlot wines. Am. J. Enol. Vitic. 64, 437-449. [ Links ]
Coombe, B.G. & McCarthy, M.G., 2000. Dynamics of grape berry growth and physiology of ripening. Aust. J. Grape Wine Res. 6, 131-135. [ Links ]
Foster, D., 2011. Colour constancy. Vis. Res. 51, 674-700. [ Links ]
Fredes, C., Von Bennewitz, E., Holzapfel, E. & Saavedra, F., 2010. Relation between seed appearance and phenolic maturity: A case study using grapes cv. Carménère. Chil. J. Agr. Res. 70, 381-389. [ Links ]
Gevers, T. & Smeulders, A.W., 1999. Color-based object recognition. Pat. Recog. 32, 453-464. [ Links ]
Gonzalez-Barreiro, C., Rial-Otero, R., Cancho-Grande, B. & Simal- Gandara, J., 2014. Wine aroma compounds in grapes. Crit. Rev. Food Sci. 55, 202-218. [ Links ]
Kennedy, J.A., Troup, G.J., Pilbrow, J.R., Hutton, D.R., Hewitt, D., Hunter, C.R., Ristic, R., Iland P.G. & Jones, G.P., 2000. Development of seed polyphenols in berries from Vitis vinifera L. cv. Shiraz. Aust. J. Grape Wine Res. 6, 244-254. [ Links ]
Le Moigne, M., Symoneaux, R. & Jourjon, F., 2008. How to follow grape maturity for wine professionals with a seasonal judge training? Food Qual. Pref. 19, 672-681. [ Links ]
Meléndez, E., Ortiz, M.C., Sarabia, L.A., Íniguez, M. & Puras, P., 2013. Modelling phenolic and technological maturities of grapes by means of the multivariate relation between organoleptic and physicochemical properties. Anal. Chem. 761, 53-61. [ Links ]
Mercurio, M. & Smith, P.A., 2006. New formats for the methyl cellulose precipitable, MCP tannin assay allow high throughput measurement of grape and wine tannin by industry. Aust. Wine Res. Inst. Tech. Rev. 164, 1-10. [ Links ]
Oyarce, M., 2014. Estimación computacional de la madurez de uvas basada en una escala de colour para semillas. Thesis, Universidad Católica del Maule (Talca), Chile. [ Links ]
Pszczolkowski, P., Latorre, B. & Ceppi, C., 2001. Efectos de los mohos presentes en uvas cosechadas tardíamente sobre la calidad de los mostos y vinos Cabernet sauvignon. Cien. Investig. Agrar. 28, 157-163. [ Links ]
Ribéreau-Gayon, P., Glories, Y., Maujean, A. & Dubourdieu, D., 2006 (2nd ed). Handbook of enology. Volume 2, The chemistry of wine stabilization and treatments. John Wiley & Sons Ltd, London. [ Links ]
Ristic, R. & Iland, P., 2005. Relationships between seed and berry development of Vitis vinifera L. cv. Shiraz. Developmental changes in seed morphology and phenolic composition. Aust. J. Grape Wine Res. 11, 43-58. [ Links ]
Rodríguez-Pulido, F.J., Ferrer-Gallego, R., González-Mireta, M.L., Rivas- Gonzalo, J.C., Escribano-Bailón, M.T. & Heredia, F.J., 2012a. Preliminary study to determine the phenolic ripening stage of grape seeds by computer vision. Anal Chim. Acta 732, 78-82. [ Links ]
Rodríguez-Pulido, F.J., Gómez-Robledo, L., Melgosa, M., Gordillo, B., González-Miret, L. & Heredia, F.J., 2012b. Ripeness estimation of grape berries and seeds by image analysis. Comput. Electron. Agr. 82, 128-133. [ Links ]
Rodríguez-Pulido, F.J., Hernández-Hierro, J.M., Nogales-Bueno, J., Gordillo, B., González-Miret, M.L. & Heredia, F.J., 2014. A novel method for evaluating flavanols in grape seeds by near infrared hyperspectral imaging. Talanta 122, 145-150. [ Links ]
Rousseau, J. & Delteil, D., 2000. Presentation d'une méthode d'analyse sonsorielle des baies de raisin. Principe, méthode, interprétation. Rev. Fr. Oenol. 183,10-13. [ Links ]
Sadras, V.O. & Petrie, P.R., 2012. Predicting the time course of grape ripening. Aust. J. Grape Wine Res. 18, 48-56. [ Links ]
Saint-Cricq de Gaulejac, N., Augustin, M., Vivas, N. & Glories, Y., 1997. A biochemical approach to the evolution of procyanidins in grape seeds during the ripening of red grapes. J. Wine Res. 8, 159-167. [ Links ]
Saint-Cricq de Gaulejac, N., Vivas, N. & Glories, Y., 1998. Maturation phénolique: definition et controle. Rev. Fr. Oenol. 173, 22-25. [ Links ]
Schoedl, K., Lawo, J.P., Astutiningsih, N.T. & Forneck, A., 2012. An experimental design applied to vineyards for identifying spatially and temporally variable crop parameters. Vitis 5, 53-60. [ Links ]
Torchio, F., Giacosa, S., Río Segade, S., Mattivi, F., Gerbi, V. & Luca, R., 2012. Optimization of a method based on the simultaneous measurement of acoustic and mechanical properties of winegrape seeds for the determination of the ripening stage. J. Agr. Food Chem. 60, 9006-9016. [ Links ]
Zuniga, A., Mora, M., Oyarce, M. & Fredes, C., 2014. Grape maturity estimation based on seed images and neural networks. Eng. Appl. Artif. Intel. 35, 95-104. [ Links ]
Submitted for publication: August 2016
Accepted for publication: January 2017
Acknowledgements: We are grateful to the FONDEF Project, N° ID15I10142, for its financial support, to Ms Luz María Gutierrez, for the drawings, and to students César Gonzalez, Javier Leyton and Marcela Sereho, who worked in the "Laboratorio de Estudios Avanzados en Reconocimiento de Patrones" at the Universidad Católica del Maule, Chile.
* Corresponding author: E-mail address: cfredes@ucm.cl

