


Services on Demand
Article
 English (pdf)
 Article in xml format
 Article references
Indicators

Related links
-
 Cited by Google
 -
 Similars in Google
Share

 Permalink
South African Journal of Enology and Viticulture
On-line version ISSN 2224-7904
Print version ISSN 0253-939X
S. Afr. J. Enol. Vitic. vol.38 n.1 Stellenbosch 2017
RESEARCH NOTE
Do differences in the colour and phenolic composition of young shiraz wines reflect during ageing?
P. de Beer; A. Strever; W.J. du Toit*
Department of Viticulture and Oenology, Private Bag X1, 7620 Matieland (Stellenbosch), South Africa
ABSTRACT
This study investigated the evolution of the colour and phenolic compounds of Shiraz wines during wine ageing. Wines made from grapes from the same vineyard, but with a different phenolic composition, were used in this study. Analyses included colour density, anthocyanins, tannin, hydroxycinnamic acids, flavan-3-ols, polymeric pigments and polymeric phenols. Differences in the phenolic composition of the young wines were generally still observed after six and 12 months of ageing. These results indicate that the significant differences in terms of phenolics and colour in young Shiraz red wines could also be expected to be reflected in the wines after ageing.
Key words: Phenolics, colour ageing, polymerisation
INTRODUCTION
Phenolics, such as anthocyanins, tannins, flavonols and hydroxycinnamic acids, are critical to the quality of red wine as they play an important role in the colour and mouthfeel of the wine (Monagas et al., 2005). The different concentrations of each of these phenolic compounds also affect the ageing ability of the wine, as they differ in reactivity and thus in their influence on the development of red wine. Positive correlations have been found between grapes and wines in terms of anthocyanin levels (Du Toit & Visagie, 2012) and, to a lesser extent, tannins (Bindon et al., 2014). However, data is lacking on whether differences in phenolic compounds in young red wines are observed after ageing (Kilmister et al., 2014), especially under South African conditions. The main aim of this study was therefore to investigate the phenolic composition of red wines produced from Shiraz vines that were exposed to different viticultural management treatments to obtain different phenolic concentrations in the young wines after malolactic fermentation, and how these evolved over time. This study forms a small part of a larger one that focuses on the effects of a variety of viticultural treatments on the phenolics and sensory composition of Shiraz grapes and wines.
MATERIALS AND METHODS
Experimental layout of the vineyard
Grapes were obtained from a well-characterised block of Vitis vinifera L. cv. Shiraz (SH9C clone) on 101-14 Mgt rootstock located on the Welgevallen experimental farm of Stellenbosch University (33°56'S, 18°52'E). The vines were spaced at 2.7 x 1.5 m and were grown on a seven-wire training system, with movable wires for the vertical shoot positioning (VSP) training system and the addition of an extra wire 30 cm below the cordon for the Smart-Dyson (SD) training system. The SD system was converted from a VSP in the 2011/2012 growing season.
The experimental layout consisted of a random block design, with 18 vines randomly assigned to a treatment in the designated block. Upper and lower shoots were seen as different treatments [SD top shoots (SDA) and SD bottom shoots (SDB)], as differences have been reported between the shoots (Smart et al., 1990). The VSP system (VSP) was considered the control. The reduced canopy management treatment (R) was not in the original experimental layout, but it was later decide to include this as well. This was done to assess the effect of canopy reduction on vegetative growth to manage vigour. The R treatment was executed in a split block design in three different areas in the vineyard prior to the other treatments in a previous study. The reduced canopy treatment consisted of the removal of the top shoot and its grapes on a two-bud spur around flowering time, thereby halving the canopy. More details on the R and SD systems can be found in Van Noordwyk (2012) and Bosman (personal communication, 2013). This experiment was repeated for both the 2011/2012 and 2012/2013 growing seasons, resulting in wine being made in 2012 and 2013.
Harvesting parameters
For both the small- and commercial-scale experiments, the grapes were harvested by hand, based on the parameters of pH, titratable acidity (TA) and total soluble solids, measured in degrees Balling (°B). The grapes were harvested as close as possible to the following values: pH 3.5 to 3.8, TA of 4 to 4.5 g/L, and a sugar concentration of 23 to 25°B. The grapes were harvested on 2012-03-11 in the first season and on 2013-03-19 in the second season.
Winemaking procedures
Each treatment repeat was harvested separately and treated as a separate wine for the entire winemaking procedure from harvest onwards. After harvesting, the grapes for the small-scale experiment were crushed and de-stemmed, and 20 mg/L of SO2 was added before fermentation. The must was then inoculated and fermented with Saccharomyces cerevisiae D21 yeast (Lallemand) at 25°C. The co-inoculant, Oenococcus oeni (Endoferm Alpha, Lallemand), was used for malolactic fermentation (MLF) and added to the wine 24 hours after yeast inoculation. The skins of the fermenting must were mixed manually (punched down) twice a day, after which the degrees Balling were measured to follow the progression of fermentation. After the wine had fermented dry (after seven days, with residual sugar < 4 g/L), the skins were pressed with a basket press and the press wine was mixed with the free-run wine. The wines were then stored in 20 L stainless steel canisters until the completion of malolactic fermentation (MLF). MLF was monitored using a Grapescan FT 120 instrument. Thirty mg/L of SO2 was added after the completion of MLF (< 0.3 g/L malic acid), while the same amount of SO2 was added before the wines were bottled in standard 750 ml green wine bottles and sealed with screw caps.
Phenolic and colour analyses
Wine samples were collected for phenolic and colour analyses after the completion of malolactic fermentation, as well as after six and 12 months of bottle ageing.
Spectrophotometric analyses
Bovine serum albumin tannin analysis
The bovine serum albumin analysis (BSA) uses the ability of tannins to form complexes with proteins and to precipitate to determine the tannin concentration in grapes and wines (Harbertson et al., 2002).
Colour density
Wine samples were measured in a 1 mm quartz or glass cuvette at 420 nm, 520 nm and 620 nm to determine the colour density according to Iland et al. (2000).
Modified colour density
The pH of the wines was adjusted to pH 3.5 using 1 M of HCl to acidify the wine, or 1 M of NaOH to increase the pH of the treatments where necessary. Ten μL of a 10% acetaldehyde solution was then added to one mL of wine sample, mixed and allowed to react for 45 min at room temperature, according to Iland et al. (2000), after which the colour density was determined.
HPLC analysis
For wine, sample preparation consisted of filtering one mL of wine sample through a 0.45 μηι filter prior to the HPLC analysis. The HPLC analysis for individual phenolic compounds was performed on a diode array detector HPLC, adapted from a method developed by Peng et al. (2002). The concentrations of individual anthocyanins (delphinidin-3-glucoside, petunidin-3-glucoside, peonidin-3-glucoside, malvidin-3-glucoside, delphinidin-3-acetate, petunidin-3-acetate, peonidin-3-acetate, malvidin-3-acetate, petunidin-3-p-coumarate, peonidin-3-p-coumarate and malvidin-3-p-coumarate), hydroxycinnamic acids (caftaric, caffeic, p-coumaric), flavonols (quercitin-3-glucoside, quercitin-3-rutinoside, quercitin) and flavan-3-ols (catechin, epicatechin, epicatechin gallate and dimers (B1, B2)) were summed. Polymeric phenols (consisting of polymeric phenolic moieties) were quantified at 280 nm as mg/L catechin equivalents, while polymeric pigments (consisting of pigments containing anthocyanin moieties) were quantified at 420 nm as mg/L malvidin-3-glucoside equivalents.
Statistical analysis
Integrations of the separation were done using Chemstation software and the statistics for the ANOVA analyses were performed in Statistica 10.
RESULTS AND DISCUSSION
In 2012, only the R treatment's wine was significantly higher in terms of colour density than the wine from the rest of the treatments (Table 1). Over the first twelve months after the completion of MLF there was only a slight, general decrease in colour density (Table 1). This phenomenon is supported by the literature, which shows that large decreases in colour density may still occur after twelve months of ageing as anthocyanins polymerise (Monagas et al., 2005). Because the wine was stored under screw cap, the initial polymerisation that took place was probably acetaldehyde-mediated polymerisation due to the oxygen introduced to the wine during bottling (Kwiatkowski et al., 2007). This reaction will become less important with ageing, as there is little oxygen ingress through screw caps (Duncan & Kleinig, 1999). The main reactions after a few months therefore were probably a direct association between anthocyanins and tannins that do not require any oxygen (Ribéreau-Gayon et al., 1983).
The R treatment had significantly higher levels of modified colour density after MLF as well as during ageing in 2012. At the beginning of ageing, the bonds between SO2 and anthocyanins, as well as between co-pigmented anthocyanins, may break (Boulton, 2001), which may lead to changes in the modified colour density. The colour density then decreases with longer ageing due to polymerisation and the possible precipitation of the free monomeric anthocyanins (Monagas et al., 2005). Wines made from the 2012 R treatment had a significantly higher concentration of total anthocyanins and polymeric pigments after MLF compared to the other treatments, which did not show any significant differences from each other (Table 1). Opposite trends were observed between the anthocyanins and the polymeric pigments during ageing (Table 1). After six months, the anthocyanin concentration of all treatments decreased, with that of the R treatment remaining significantly higher than that of the other treatments. The decrease in concentration persisted at 12 months' ageing, and the R treatment remained significantly higher in concentration than the other treatments.
As monomelic anthocyanins become polymerised their concentration decreases, while that of polymeric pigments increases during wine ageing (De Beer et al., 2005).
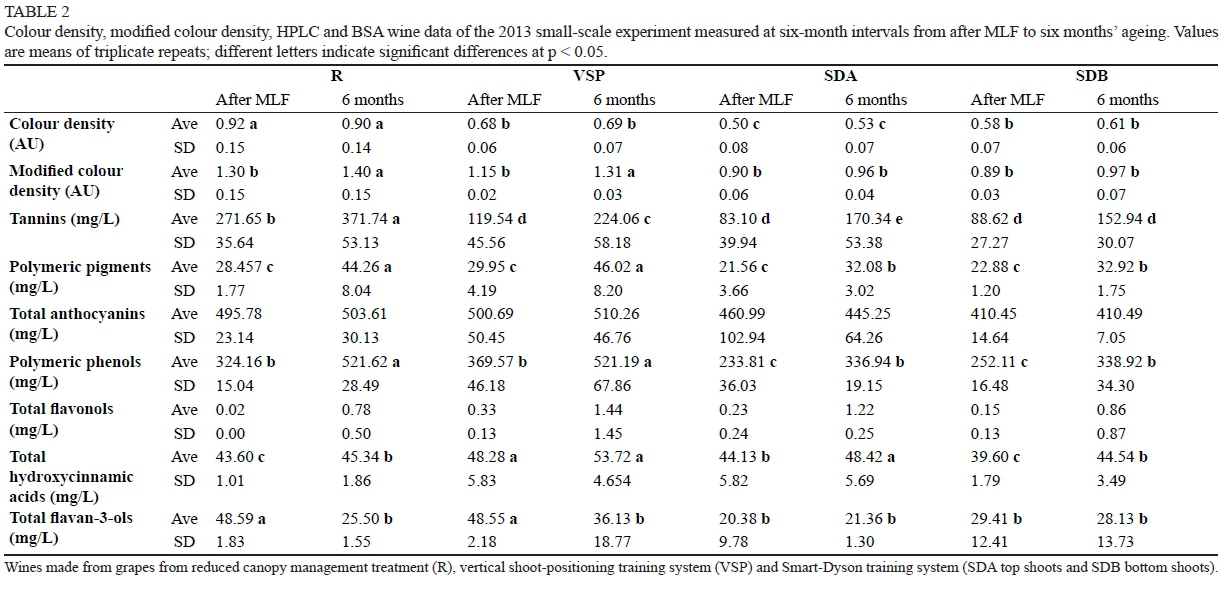
The 2013 results show the same trend as in the previous year, with the R treatment having significantly higher colour density than the other treatments (Table 2). This was also found by Van Noordwyk (2012) in wines made from the same vineyard with the same R treatments, leading to significantly higher colour density values compared to the VSP treatments. It should be noted, however, that the SDA and SDB treatments were significantly lower in terms of colour density than the VSP treatment (Table 2). After six months of ageing the colour density of all the treatments showed no significant decreases (Table 2). No significant differences in terms of modified colour density were observed between the treatments after MLF in 2013. However, after six months of ageing the R and VSP treatments' modified colour densities increased significantly and were higher than those of the other treatments. This could be due to the higher polymeric pigments found in wines produced from these two treatments, which are known to have higher colour than monomeric anthocyanins (Du Toit et al., 2006). The polymeric pigments showed no differences between the treatments after MLF, but after six months of ageing the polymeric pigment concentrations of the wines from all the treatments had increased as the anthocyanins polymerised (Table 2), with that of the VSP and R treatments being significantly higher. This could have been due to higher tannin concentrations in these treatments, leading to polymerisation with anthocyanins and therefore an increase in polymeric pigments (De Beer et al., 2005). However, trends in colour and pigmented phenols observed in the young wines were often still reflected after ageing.
In 2012 the difference in tannin concentrations between wines made from the R and the other treatments was significant after MLF (Table 1). Changes in tannin concentrations at the six-month ageing period of these wines showed an increase in the R and SDB treatments, with no significant changes in the wines from the SDA and VSP treatments. After 12 months of ageing, tannin levels were still significantly higher in the wines made from the R treatment than the other treatments. The R and SDB treatments showed a significant decrease in tannin concentrations after 12 months' ageing compared to six months' ageing, while the VSP and SDA treatments remained near the same levels as after six months' ageing. The tannin results of the 2013 wines showed the same trends as in the previous year, with the only significant difference between the treatments being the R treatment (Table 2). The 2013 results followed the same trend as the 2012 results, with an increased tannin concentration in some treatments after six months of ageing.
Kilmister et al. (2014) also reported changes in tannin levels determined by BSA precipitation during the ageing of Shiraz wines. Changes in BSA-determined tannin concentrations can be due to different reasons, which include tannins participating in initial co-pigmentation reactions and dissociating at a later stage (Boulton, 2001; Monagas & Bartolome, 2005), polymerisation and precipitation, possible changes in tannin conformation at a later stage (Boulton, 2001; Fulcrand et al., 2005), as well as changes in the molecular mass or shape of tannins that may lead to a different precipitation response with BSA, leading to different tannin levels measured with this precipitation method (Geldenhuys et al., 2012).
In terms of polymeric phenols, the 2012 R treatment results again showed significantly higher levels compared to the other treatments (Table 1). After six months of ageing there were no significant changes in the concentration between treatments compared to the after MLF ageing interval. All the treatments showed significantly increased levels after 12 months of ageing, with only the R treatment being significantly higher compared to the other treatments. This increase in polymeric phenols is probably due to polymerisation reactions between catechin-derived moieties during ageing (Monagas et al., 2005).
The polymeric phenol results from 2013 show that the R and VSP treatments' wines were significantly higher than the SDA and SDB treatments, with significant increases observed after six months' ageing for all treatments, with the R and VSP treatments remaining significantly higher than the SDA and SDB treatments (Table 2). These results corroborate those found in a previous study (Van Noordwyk, 2012) on the same vineyard in which wines from full and reduced canopy treatments were compared, with the latter treatment also leading to a higher level of polymeric phenols in the wine.
During the 2012 season, the flavan-3-ol concentration of only the VSP treatment was significantly higher after MLF compared to the other treatments. After six months of ageing, the flavan-3-ol concentration of all the treatments decreased significantly, but no significant differences were observed between the treatments (Table 1). This does not correspond with the findings in the literature, which found increases in flavan-3-ol concentrations with ageing (Revilla & Gonzalez-SanJose, 2003; Fang et al., 2007b). The possible polymerisation and precipitation of these flavan-3-ols may occur at a faster rate if the concentrations are high enough (Revilla & Gonzalez-SanJose, 2003). This might offer a possible explanation for what was observed. All treatments, however, showed significant increases in the concentration of total flavan-3-ols after 12 months of ageing. This is supported by the results obtained by Biodo et al. (2006). However, again no significant differences were observed between the treatments.
For the 2013 season the total flavan-3-ols of the R and VSP treatments were significantly higher than those measured in the SDA and SDB treatments (Table 2). After six months of ageing, the flavan-3-ol concentrations of SDA and SDB showed no significant change, while only those of the R and VSP treatments decreased, as observed for 2012. This phenomenon negated any differences between the treatments at this stage of ageing. Although other authors have reported an increase in total flavan-3-ols in the early stages of ageing due to their release from co-pigmentation bonds (De Beer al., 2005), the possible polymerisation and precipitation of these flavan-3-ols may occur at a faster rate if the concentrations are high enough (Revilla & Gonzalez-SanJose, 2003). This could explain why the levels in the treatments with high concentrations seemed to decrease after six months, while the treatments with lower concentration showed no difference.
In 2012, no differences were observed between the treatments after MLF in terms ofwine flavonol concentrations (Table 1). As red wine ages, flavonols are released from their co-pigmentation bonds and concentrations could increase (De Beer et al., 2005; Fang et al., 2007a). The flavonol levels of the wine from the R treatment increased significantly during ageing. The 2013 results were the same as for 2012, with no significant differences between the treatments over six months of ageing (Table 2). Although insignificant, there was a slight upward trend with ageing, as was found in the previous year for the R treatment.
The only difference observed between the treatments in terms of hydroxycinnamic acid concentrations was for the wine from the VSP treatment, which showed significantly lower levels compared to the other treatments (Table 1). All treatments showed a slight increase after twelve months of ageing, of which only the increase of the SDB treatment was insignificant. This indicates that, although hydroxycinnamic acids may increase slightly over time, their concentrations remain relatively stable with ageing (Monagas et al., 2005). The hydroxycinnamic acid concentrations in 2013 showed significant differences between all the treatments, with the VSP treatment wines having the highest concentration and the SDB treatment wines having the lowest concentration. After six months of ageing there was a significant increase in the hydroxycinnamic acid concentrations of all the treatments except for the VSP treatment (Table 2).
CONCLUSION
The R treatment often led to wines with higher levels of certain phenolic compounds than the other treatments, which was probably due to more fruit exposure in the bunch zone, leading to a higher accumulation of phenolic compounds (Van Noordwyk, 2012). Differences observed in the young red wines' colour and phenolic composition after MLF often remained relatively continuous throughout the ageing of the wine. This shows that the differences in colour and phenolic composition in young red wines will most likely be reflected in the wines after ageing. These findings are thus of importance for certain vinicultural or winemaking studies in which the phenolic and colour composition of young red wines is investigated without exposing the wines to prolonged ageing periods, as would happen under commercial winemaking conditions. However, further studies are required to corroborate these findings under different ageing conditions.
LITERATURE CITED
Bindon, K.A., Kassara, S, Cynkar, W.U., Robinson, E.M.C., Scrimgeour, N. & Smith, P.A., 2014. Comparison of extraction protocols to determine differences in wine-extractable tannin and anthocyanin in Vitis vinifera L. cv. Shiraz and Cabernet Sauvignon grapes. J. Agric. Food Chem. 62, 4558-4570. [ Links ]
Biodo, E., Alcalde-Eon, C.,Carrau, F., Dellacassa, E. & Rivas-Gonzola, J. 2006. Aging Effect onthe Pigment Composition and Color of Vitis vinifera L. Cv. Tannat Wines. Contribution of the Main Pigment Families to Wine Color. J. Agric. Food Chem. 54, 6692-6704. [ Links ]
Boulton, R., 2001. The copigmentation of anthocyanins and its role in the colour of red wine: A critical review. Am. J. Enol. Vitic. 52, 67-87. [ Links ]
De Beer, D., Joubert, E., Gelderblom, W.C.A. & Manley, M., 2005. Changes in phenolic composition and antioxidant activity of Pinotage, Cabernet Sauvignon, Chardonnay and Chenin blanc wines during bottle aging. S. Afr. J. Enol. Vitic. 26, 6-15. [ Links ]
Duncan, B. & Kleinig, A., 1999. Oxygen transmission analysis of wine bottle closures. Southcorp Wines internal project, P9703. [ Links ]
Du Toit, W.J. & Visagie, M., 2012. Correlations between South African red grape and wine colour and phenolic composition: Comparing the Glories, Iland and bovine serum albumin tannin precipitation methods. S. Afr. J. Enol. Vitic. 33, 33-41. [ Links ]
Du Toit, W.J., Marais, J., Pretorius, I.S. & Du Toit, M., 2006. Oxygen in must and wine: A review. S. Afr. J. Enol. Vitic. 27, 76-94. [ Links ]
Fang, F., Li, J., Pan, Q. & Haung, W., 2007a. Determination of red wine flavonoids by HPLC and effect of aging. Food Chem. 101, 428-433. [ Links ]
Fang, F., Li, J., Zhang, P., Tang, K., Wang, W., Pan, Q. & Haung, W., 2007b. Effects of grape variety, harvest date, fermentation vessel and wine ageing on flavonoid concentration in red wines. Food Res. Int. 41, 53-60. [ Links ]
Fulcrand, H., Duenas, M., Salas, E. & Cheynier, V., 2005. Phenolic reactions during winemaking and aging. Am. J. Enol. Vitic. 57, 289-297. [ Links ]
Geldenhuys, L., Oberholster, A. & Du Toit, W.J., 2012. Monitoring the effect of micro-oxygenation before malolactic fermentation on South African Pinotage red wine with different colour and phenolic analyses. S. Afr. J. Enol. Vitic. 33, 150-160. [ Links ]
Harbertson, J.F., Kennedy, J.A. & Adams, D.O., 2002. Tannin in skins and seeds of Cabernet Sauvignon, Syrah and Pinot noir berries during ripening. Am. J. Enol. Vitic. 53, 54-59. [ Links ]
Iland, P., Ewart, A., Sitters, J., Markides, A. & Bruer, N., 2000. Techniques for chemical analysis and quality monitoring during winemaking. Patrick Iland Wine Promotions, Campbelltown, Adelaide. [ Links ]
Kilmister, R.L, Mazza, M., Baker, N.K., Faulkner, P. & Downey, M.O., 2014. A role for anthocyanin in determining wine tannin concentration in Shiraz. Food Chem. 152, 475-482. [ Links ]
Kwiatkowski, M., Skouroumounis, G., Lattey, K. & Waters, A., 2007. The impact of closures, including screw cap with three different headspace volumes, on the composition, colour and sensory properties of a Cabernet Sauvignon wine during two years' storage. Aust. J. Grape Wine Res. 13, 81-94. [ Links ]
Monagas, M. & Bartolome, B., 2005. Updated knowledge about the presence of phenolic compounds in wine. Crit. Rev. Food Sci. 45, 85-118. [ Links ]
Monagas, M., Bartolome, B. & Gomez-Cordoves, C., 2005. Evolution of polyphenols in red wines from Vitis vinifera L. during aging in bottles. Eur Food Res. Technol. 220, 331-340. [ Links ]
Peng, Z., Iland, P.G., Oberholster, A., Sefton, M.A. & Waters, E.J., 2002. Analysis of pigmented polymers in red wine by reverse phase HPLC. Aust. J. Grape Wine R. 8, 70-75. [ Links ]
Revilla, I. & Gonzalez-SanJose, L., 2003. Compositional changes during storage of red wines treated with pectolytic enzymes: Low molecular- weight phenols and flavan-3-ol derivative levels. Food Chem. 80, 205-214. [ Links ]
Ribéreau-Gayon, P., Pontallier, P. & Glories, Y., 1983. Some interpretations of colour changes in young red wine during their conservation. J. Sci. Food Agric. 34, 505-516. [ Links ]
Smart, R.E., Dick, J.K., Gravett, I.M. & Fisher, B.M., 1990. Canopy management to improve grape yield and wine quality - principles and practices. S. Afr. J. Enol. Vitic. 11, 3-17. [ Links ]
Van Noordwyk, M., 2012. Interaction of water deficit, canopy modification and ripening: Effect on phenolic and colour composition of Shiraz grapes and subsequent wine. MSc thesis, Stellenbosch University, Private Bag X1, 7602 Matieland (Stellenbosch), South Africa. [ Links ]
Submitted for publication: June 2016
Accepted for publication: November 2016
Acknowledgements: The authors would like to thank Winetech, Thrip and the NRF for financial support
* Corresponding author: E-mail address: wdutoit@sun.ac.za

