


Services on Demand
Article
 English (pdf)
 Article in xml format
 Article references
Indicators

Related links
-
 Cited by Google
 -
 Similars in Google
Share

 Permalink
South African Journal of Enology and Viticulture
On-line version ISSN 2224-7904
Print version ISSN 0253-939X
S. Afr. J. Enol. Vitic. vol.38 n.1 Stellenbosch 2017
ARTICLES
The importance of monomeric anthocyanins in the definition of wine colour properties
K. TangI, II; T. LiuI, II; Y. HanI, II; Y. XuI, II, * ; J.M. LiIII
IKey Laboratory of Industrial Biotechnology of Ministry of Education, Jiangnan University, 1800 Lihu Ave, Wuxi, Jiangsu, PR China
IIState Key Laboratory of Food Science and Technology, Jiangnan University, 1800 Lihu Ave, Wuxi 214122, Jiangsu, PR China
IIICentre of Science and Technology, ChangYu Group Company Ltd., Yantai 264001, China
ABSTRACT
Monomeric anthocyanins are the main contributor of colour in young red wines. To study the importance of monomeric anthocyanins to the wine colour, 41 wines of Vitis vinifera L. Cabernet Sauvignon, Cabernet Gernischt and Merlot were examined. Seven monomeric anthocyanins were isolated and applied as standards in HPLC analysis. Multiple linear regression (MLR) and partial least squares regression (PLSR) were performed to relate and validate the correlations between the monomeric anthocyanins and CIELab colour parameters. Malvidin-3-O-glucoside (Mv3g) was the most abundant anthocyanin in all tested wines, but not the anthocyanin that showed the highest correlation with the colour parameters evaluated. L*, b* and h were shown to be correlated significantly with mainly the anthocyanins for Cabernet Sauvignon, L* with the anthocyanins for Cabernet Gernischt and h with the anthocyanins for Merlot. MLR and PLSR both successfully predicted the colour from the anthocyanin composition of the wine. Delphinidin-3-glucoside (Dp3g), malvidin-3-O-acetylglucoside (Mv3ac) and Dp3g were the most important monomeric anthocyanins contributing to the prediction of the wine colour of Cabernet Sauvignon, Cabernet Gernischt and Merlot respectively. Different grape varieties had profound influences on the correlation of wine colour with anthocyanin composition.
Key words: Wine analysis, wine composition, monomeric anthocyanins, CIELab colour parameters, young red wines, multiple linear regression, partial least squares regression
INTRODUCTION
Anthocyanins are natural, water-soluble, edible pigments widely distributed in the plant kingdom and are responsible for the red and blue pigmentation in fruit, vegetables and petals (Mazza & Brouillard, 1990; Bakowska, 2003). In red wines, anthocyanins not only provide appealing colour but also play an important role in the organoleptic quality of wines (Pérez-Magarino & González-Sanjosé, 2003; Vidal et al., 2004; Jensen et al., 2008). Red wine is a complex solution and the extent of red colour depends on the type and concentration of anthocyanins, the pH, the level of free SO2 and the degree of polymerisation and co-pigmentation (Dalla & Laureano, 1994; Boulton, 2001). In young wines, the free monomeric anthocyanins are found to be the main contributors to colour. However, the colour of wines transforms to brick-red as a result of the development of polymeric pigments during maturation and ageing. In red wines made from Vitis vinifera L. grapes there normally are five main monomeric anthocyanins, namely delphinidin-3-O-glucoside, Dp3g; cyanidin-3-O-glucoside, Cy3g; petunidin-3-O-glucoside, Pt3g; peonidin-3-O-glucoside, Pn3g; and malvidin-3-O-glucoside, Mv3g (Gómez-Míguez et al., 2007; Han et al., 2008). Monoglucosides also exist as the acylated forms, including the aliphatic acetyl and the aromatic _p-coumaroyl and caffeoyl (He et al., 2012). These monomeric anthocyanins, which are in the form of red flavylium cations, give the bright red colour of young wines (Heredia et al., 1998; Monagas et al., 2005).
Several reports have referred to the relationship between wine colour and anthocyanin composition. However, most of them simply established models to associate anthocyanins with colour (Gao et al., 1997; Gómez-Plaza et al., 1999; Ho et al., 2001). In recent years, some authors have found exciting results. Monagas et al. (2005) found that the grape variety was important in defining the types of anthocyanin selected for describing each colour parameter. Gómez-Míguez et al. (2007) observed that Mv3g contributed to the prediction of colour parameters in the pre-fermentative cold maceration of Syrah wines. Han et al. (2008, 2009) showed that the structures of anthocyanins influenced their colour values. These all show us that the contributions of anthocyanins to colour are not simply proportional to their contents. Monomeric anthocyanins play different roles in the definition of wine colour properties.
Most studies are based on non-acylated anthocyanins (common anthocyanin monoglucosides in red wines), acylated anthocyanins, pyranoanthocyanins or even the sum of them (Monagas et al., 2005; Gómez-Míguez et al., 2007; Han et al., 2008, 2009). Furthermore, they only detected the colour of aqueous solution or model wine containing anthocyanins, not the wine colour (Heredia et al., 1998; Han et al., 2008, 2009). Thus, the influences of monomeric anthocyanins on young red wine colour are not clear. In addition, because the commercial standard anthocyanins are difficult to obtain, anthocyanins in these reports were only semi-quantified by Mv3g or Cy3g, and some even were expressed as their peak area in HPLC (Monagas et al., 2005; Gómez-Míguez et al., 2007; Han et al., 2008, 2009). The manner of quantification cannot exactly reflect the content of anthocyanins, which reduces the accuracy of analysis results.
In this study, wine colour and the composition of seven major monomeric anthocyanins of young red wines from Vitis vinifera L. Cabernet Sauvignon, Cabernet Gemischt and Merlot were studied. Wine colour was evaluated using the CIELab space colour parameters reflecting the visual appreciation of the colour. Monomeric anthocyanins were analysed by HPLC, and totally quantified by calibration after being isolated from the grape skins. Multiple linear regression (MLR) and partial least squares regression (PLSR) were introduced together to establish the statistical relationship between the colour and the monomeric anthocyanins of these young wines, and to determine the main contributor to the wine colour.
MATERIALS AND METHODS
Wine samples
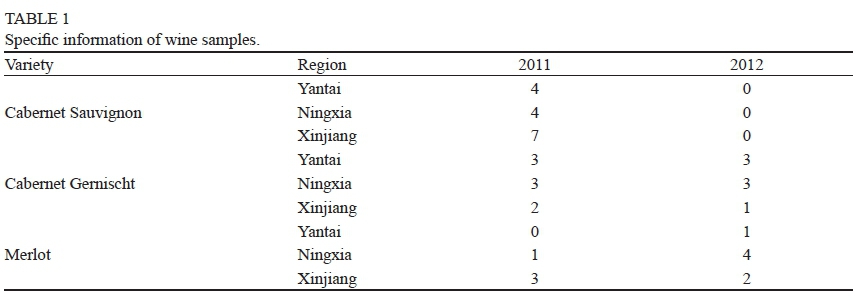
Forty-one red wine samples of Cabernet Sauvignon (15), Cabernet Gemischt (15) and Merlot (11) from the 2011 and 2012 vintages were used in this study. At the time of analysis, all wines were four months old after malolatic fermentation. Three bottles were provided for each wine. The specific information of the samples, including variety, region and vintage, is shown in Table 1.
All wine samples were provided by ChangYu Winery. After harvest, the grapes were destemmed, crushed, and then transferred to stainless steel containers. Then, 50 to 60 mg/L of SO2 and 30 mg/L of pectinase were added to the musts and the contents were mixed. After maceration of the musts for 24 h, 200 mg/L of dried active yeast FX10 (Laffort, France) was added according to the commercial specifications. Alcoholic fermentation was carried out at 28°C to 30°C to dryness (reducing sugar < 4 g/L). Malolactic fermentation was induced by the addition of a culture of Oenococcus oeni.
Isolation of anthocyanins
Seven monomeric anthocyanins were isolated from Yan 73 grape skins using the method established previously by our laboratory (Tang et al., 2014). The anthocyanins were extracted from the grape skins with 1.0% HCl acidified ethanol and further purified by XAD-7HP and then directly fractionated by preparative HPLC (auto-purity system, Waters) using X-bridge prep C18 column (250 mm χ 19 mm, 10 μηι), a Waters 2767 Sample Manager, a Waters 2489 UV/ visible Detector, and a Waters 2535 Quaternary Gradient Module. The flow rate was 8 mL/min. The first preparative isolation was performed using acid ethanol containing 2.0% formic acid (solution A) and 2.0% aqueous formic acid (solution B). Its programmed sequence was: 0 to 20 min, 15% A to 40% A; 20 to 28 min, 40% A to 80% A; 28 to 30 min, 80% A to 15% A; 30 and 35 min, 15% A. The mobile phase of the further isolation on the preparative HPLC consisted of solution A (ethanol/water/formic acid = 60/37/3, v/v/v) and solution B (water/formic acid = 97/3, v/v). The programmed sequence was: 0 to 15 min, 40% A to 45% A; 15 to 30 min, 45% A to 60% A; 30 to 35 min, 60% A to 40% A. The purity of the anthocyanin was obtained from the mean of the ratio between the peak area of anthocyanin and the sum of all peak area at 520 nm and 280 nm in HPLC.
HPLC analysis of anthocyanins
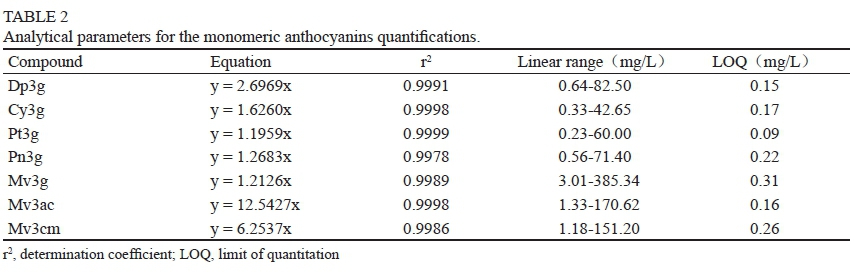
A Dienox HPLC system equipped with a P680 HPLC pump, ASI-100 automated sample injector, thermostated column compartment TCC-100 and UVD 170 U detector was used. Anthocyanin samples were applied to LiChroCART C18 column (250 mm χ 4.6 mm i.d., 5 μηι) at 45°C and 520 nm. The solvents were water/acetonitrile/formic acid = 87/3/10 (solution A, v/v/v) and water/acetonitrile/formic acid = 40/50/10 (solution B, v/v/v). The gradient was as follows: 0 to 15 min, 6% A to 30% A; 15 to 30 min, 30% A to 50% A; 30 to 35 min, 50% A to 60% A; 35 to 40 min, 60% A to 6% A; 40 to 45 min, 6% A. The extracts were filtered using 0.45 μm filters prior to direct analysis without dilution. The flow rate was 1 mL/min and the volume injection was 20 lL. All samples were replicated in triplicate. Anthocyanins isolated from the grape skin were quantified by calibration. The analytical parameters for the monomeric anthocyanins quantifications are shown in Table 2.
Analysis of CIELab parameters
The method described by Ayala et al. (1997) was utilised to analyse the CIELab parameters. All the wine samples were first adjusted to pH 3.6 with HCl 0.5 g/L or NaOH 0.5 g/L. Then they were filtered through 0.45 μΓη filters for analysis without dilution. Distilled water was used as the blank. Spectrophotometer measurements were carried out on a Unico UV-2802 spectrophotometer with a 5 mm path length, at 440 nm, 530 nm and 600 nm. All the analyses were replicated in triplicate.
Statistical analysis
Correlations between colour parameters and anthocyanin content were determined by MLR and PLSR. IBM SPSS Statistics (version 20, IBM, Armonk, United States) was used to analyse MLR, and PLSR was assessed with SIMCA-P (version 12.0, Umetrics, Malmö, Sweden).
RESULTS AND DISCUSSION
Quantification of monomeric anthocyanins in wines
Monomeric anthocyanins contribute the majority of colour to young red wines (He et al, 2012). Among the monomeric anthocyanins, Mv3g and its derivatives are usually the most abundant and are the source of most of the red colour in young red wines (Jackson, 2008). Seven monomeric anthocyanins, comprising five monoglucosides anthocyanins and two derivatives of Mv3g, were chosen and isolated first. The purity of the isolated anthocyanins was more than 98%, except for Mv3ac (malvidin-3-O-acetylglucoside) (92.1%) and Mv3cm (malvidin-3-O-coumarylglucoside) (93.5%).
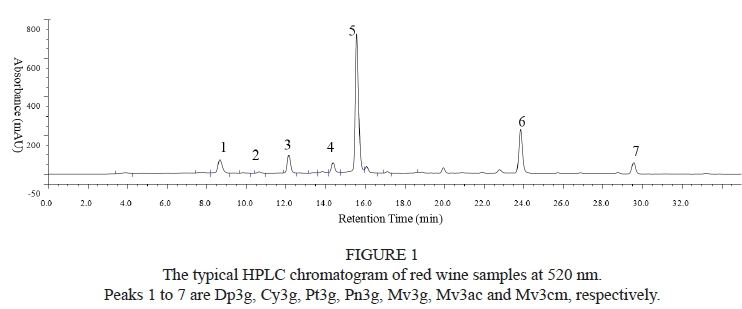
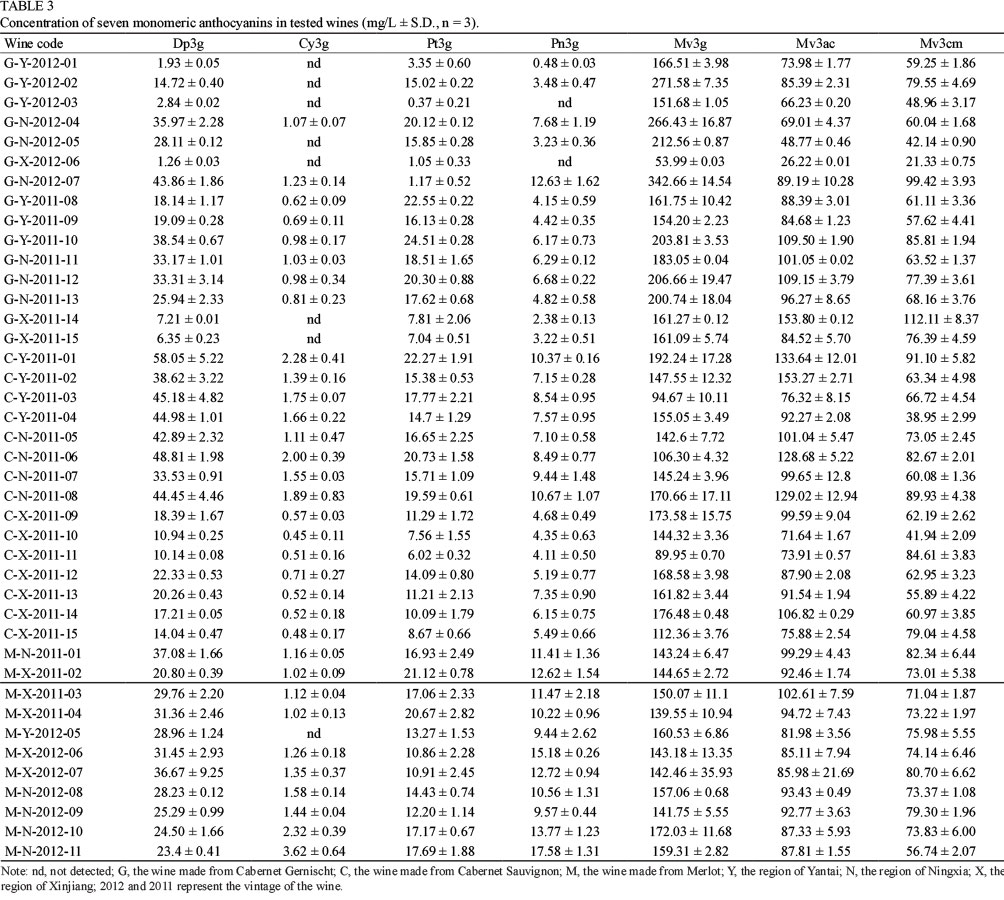
The seven isolated anthocyanins were applied as standards in HPLC analysis. The typical chromatogram of the seven monomeric anthocyanins in the red wine samples is shown in Fig. 1. It should be mentioned that these anthocyanins were identified according to retention time, and they were quantified accurately by calibration after being isolated from the grape skins. Table 3 presents the concentrations of the seven monomeric anthocyanins identified from the Cabernet Sauvignon, Cabernet Gemischt and Merlot wines. The concentrations obtained for the monomeric anthocyanins were in accordance with the data reported regarding red wines from Greece elaborated with Cabernet Sauvignon (Kallithraka et al., 2006). In these wines, the content of Mv3g was the highest in the Cabernet Sauvignon, Cabernet Gemischt and Merlot wines, followed by Mv3ac and Mv3cm.
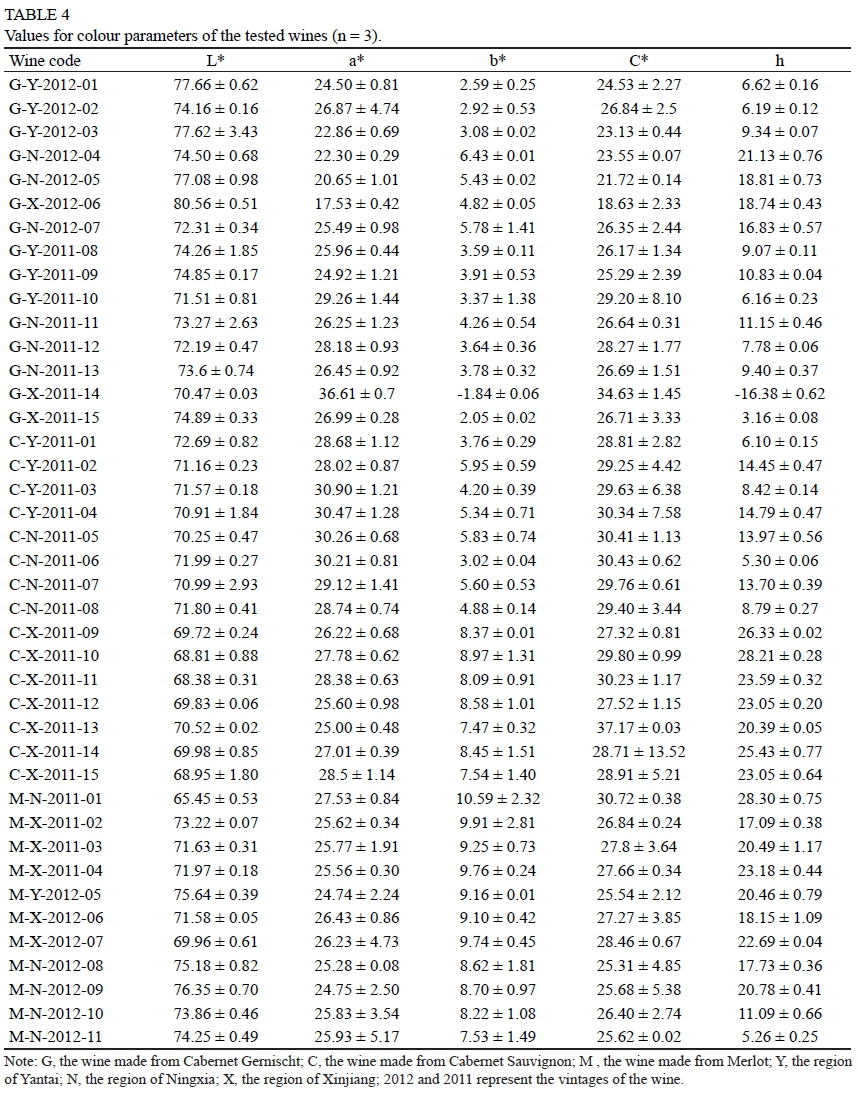
The CIELab parameters of red wines
The colour properties of these tested young red wines were evaluated by measuring the co-ordinates of CIELab space, which is generally recognised as an effective wine colour evaluation method (Pérez-Magarino & González-Sanjosé, 2003). The values of L* (lightness), a* (redness), b* (yellowness), C* (Chroma) and h (hue angle) can be seen in Table 4. Cabernet Gemischt wines presented higher L* but lower a* and C* than Merlot and Cabernet Sauvignon wines, which corresponds to a deeper colour in the Merlot and Cabernet Sauvignon wines. This phenomenon may be influenced partly by the concentrations of anthocyanins and other phenols existing in the wines. The amount of anthocyanins in the form of red flavylium cation, self-association and co-pigmentation differed in concentration (Gómez-Plaza et al., 1999).
Relationships between anthocyanins and wine colour as analysed by MLR
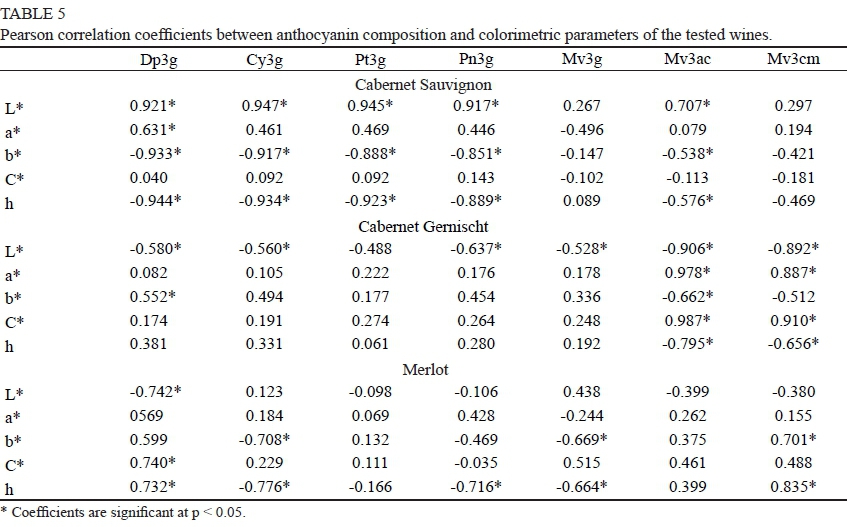
The correlation between the amount of anthocyanins and the colorimetric parameters of 41 wines made from Cabernet Sauvignon, Cabernet Gernischt, and Merlot was determined by MLR (Table 5).
Table 5 shows the Pearson's correlation coefficients between the different parameters subjected to analysis. As can be seen, the grape variety markedly influenced the correlation between anthocyanins and the CIELab parameters. L*, b* and h were significantly correlated with anthocyanins for Cabernet Sauvignon, L* with anthocyanins for Cabernet Gemischt and h with anthocyanins for Merlot. With regard to the values of the correlation coefficients, h was the best correlated colorimetric parameter in the Cabernet Sauvignon and Merlot wines, but in Cabernet Gernischt wines the best correlated colorimetric parameter was C*. The correlation coefficient between C* and Mv3ac was the best (r* = 0.987).
For Cabernet Sauvignon, L*, b* and h showed significant correlation with the anthocyanins Dp3g, Cy3g, Pt3g, Pn3g and Mv3ac. In the case of Cabernet Gernischt, five CIELab parameters expressed significant correlation with two anthocyanins, Mv3ac and Mv3cm, except for b* with Mv3cm. Finally, for Merlot, the significant correlation between the CIELab parameters and anthocyanins focused on b* and h. These results are consistent with those of other studies, which found that there were no significant associations between the colorimetric parameters (a* and C*) and anthocyanins in Cabernet Sauvignon and Merlot wines (Gómez-Míguez & Heredia, 2004; Gómez-Míguez et al., 2007).
The variables showing significant correlations in the previous studies were found by MLR. The anthocyanins that provided the best linear model for significant colour parameters in Cabernet Sauvignon, Cabernet Gernischt, and Merlot wines were then obtained.
During MLR analysis, the anthocyanins content was considered as independent variable, and the colorimetric parameters were considered as dependent variables. The most significant equations found were as follows:
Cabernet Sauvignon:
R=0.983 (ß →Dp3g:-0.1, Cy3g:0.467, Pt3g:0.430, Pn3g:0.116, Mv3ac:0.145)
R=0.831 (ß→Dp3g:0.631)
R=0.951 (ß→Dp3g:-0.665, Cy3g:-0.383, Pt3g:0.07, Pn3g:-0.041, Mv3ac:0.075)
R=0.965 (ß→Dp3g:-0.444, Cy3g:-0.32, Pt3g:0.148,Pn3g:-0.124, Mv3ac:0.057)
Cabernet Gernischt:
R=0.991 (ß→DP3g:-0.335, Cy3g: 0.085, Pn3g:-0.144, Mv3g: 0.016, Mv3ac:-0.698, Mv3cm:-0.134)
R=0.980 (ß→Mv3ac:0.861, Mv3cm:0.133)
R=0.978 (ß→Mv3ac:-0.829, Dp3g:0.739)
R=0.992 (ß→Mv3ac:0.819, Mv3cm:0.192)
R=0.799 (ß→Mv3ac:-0.949, Mv3cm:0.176)
Merlot:
R=0.742 (ß→Dp3g:-0.742)
R=0.855 (ß→Cy3g:-0.348, Mv3g:-0.417, Mv3cm:0.292)
R=0.740 (ß→Dp3g:0.74)
R=0.983 (ß→Dp3g:0.363, Cy3g:-0.159, Pn3g:-0.311, Mv3g:-0.288; Mv3cm:0.196)
In general, the fitted models explain more than 95% of the variation of the colour parameters (R > 0.95), with the exception of a* in the Cabernet Sauvignon wines, h in the Cabernet Gernischt wines, and L*, b, C* in Merlot, which presented R values lower than 0.86. The coefficients in the MLR analysis equations are B regression coefficients (non-standardised coefficients) and the coefficients in brackets are β regression coefficients (standardised coefficients). β regression coefficients would provide a better estimation of anthocyanins predicting the colour parameters than B regression coefficients (Gómez-Míguez et al, 2007).
In this sense, differences were found among grape varieties in relation to the anthocyanins with the greatest weight in all the colorimetric parameters. Dp3g was the best-predicted anthocyanin for the colorimetric parameters in the Cabernet Sauvignon and Merlot wines; but the best-predicted anthocyanin in Cabernet Gemischt wines was Mv3ac. There are two studies that have determined the relationship between anthocyanin composition and wine colour by using MLR. Gómez-Plaza et al. (1999) showed that Dp3g could explain the tendency for a higher percentage of colour loss by red wines more so than Pt3g, Pn3g and Mv3g in Monastrell red wines. Furthermore, Gómez-Míguez et al. (2007) observed that Mv3g contributed the most to the prediction of the colour parameters in pre-fermentative cold maceration of Syrah wines. The conclusions from different wines are different. This may be due to the fact that grape variety and vinification would affect the amount and composition of anthocyanins (Arozarena et al., 2000; Gómez-Plaza et al, 2000; Gómez-Míguez & Heredia, 2004).
Relationships between anthocyanins and wine colour analysed by PLSR
PLSR analysis, an asymmetric analysis, is frequently used to evaluate the relationship between the two datasets by predicting one dataset from the other (Chung et al., 2003). It has been effectively applied in many studies, such as to evaluate the relationship between volatile profiles and sensory description data, sensory analysis and visible-near infrared spectroscopy, astringency and non-volatile composition, and anthocyanins and their colour in aqueous solutions (Chung et al., 2003; Cozzolino et al., 2005; Saenz-Navajas et al., 2010). PLSR not only tries to provide solutions for both X and Y variables, but also simultaneously attempts to find the "best" solution for X that will explain the variation in the Y variable (Chung et al., 2003). In order to quantify the relationship precisely, PLSR was also performed to investigate the correlation between the anthocyanin composition and colour of these 41 wines. It successfully displayed the relationship between them.
The parameters (R2X, R2Y, Q2Y) obtained from SIMCA-P indicate how well the model fits and predicts the data. R2X and R2Y are the percentage of variation of the training set X with PCA and Y with PLS explained by the model. Q2Y is the percentage of variation of the training set X with PCA and Y with PLS explained by the model according to cross-validation. A large Q2Y (> 0.5) indicates superior predictive ability. These three parameters of models for Cabernet Sauvignon, Cabernet Gernischt and Merlot wines were 0.784, 0.718, 0.643; 0.786, 0.99, 0.903; and 0.586, 0.832, 0.597 respectively. It could be seen that the models accurately reflect the relationship between colour variables and anthocyanins.
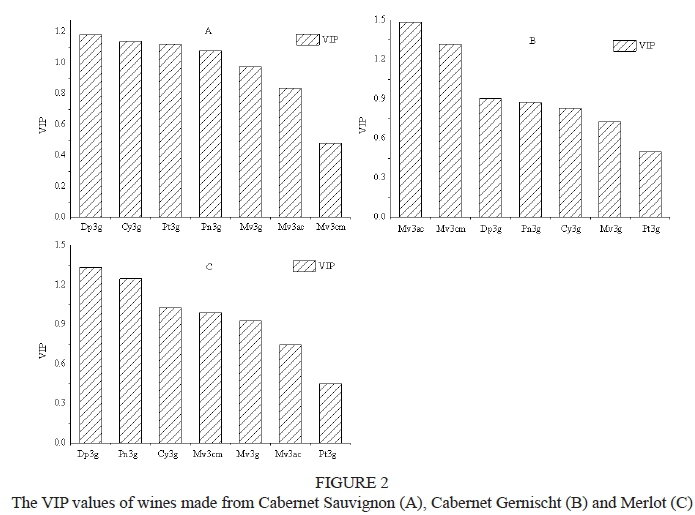
The VIP (variable importance for the project) plot summarises the importance of the variables - both to explain X and to correlate with Y. VIP plots are sorted by order of importance. The VIP values are calculated for Xk by summing the sequences of the PLS weights, and for Wak by weighting the amount of Y explained in each model component. VIP values larger than 1 indicate "important" X variables, and values lower than 0.5 indicate "unimportant" X variables. The interval between 1 and 0.5 is a grey zone, where the level of importance depends on the size of the dataset.
According to the VIP values (Fig. 2), it was clear that the important anthocyanins for the three varieties were different. In the case of Cabernet Sauvignon wines, Dp3g had the largest VIP values (1.181), followed by Cy3g (1.140), Pt3g (1.119) and Pn3g (1.080). These were all important anthocyanins. Similar result was obtained for Merlot wines, for which the most important anthocyanin also was Dp3g (1.335), followed by Cy3g (1.249) and Pn3g (1.027), but not Pt3g (0.452). For the Cabernet Gemischt, Mv3ac (1.487) had the largest VIP values, then Mv3cm (1.317). The results were not consistent with the study of Han et al. (2009), who reported the relationship between anthocyanins and the corresponding aqueous solution colour in Cabernet Gemischt on the basis of PLSR. This result may be caused by the different matrix. In Han et al.'s study, the colour variables were detected in anthocyanin aqueous solution, but not in wine.
Description of the correlation of monomeric anthocyanins and wine colour
MLR and PLSR both successfully displayed linkages between colour parameters and anthocyanin composition in the 41 tested wines. The results show that the monomeric anthocyanins that contributed the most were Dp3g, Mv3ac and Dp3g for the Cabernet Sauvignon, Cabernet Gernischt and Merlot wines respectively. Difference in grape variety had profound influences on the correlation of wine colour and anthocyanin composition.
Although MLR analysis can make full use of the information in the variables, there was multicollinearity or high correlation among the independent variables in the regression equation. This analysis method may lead to inaccurate relations between wine colour and anthocyanin composition (Han et al., 2008). However, in this study the consequences of MLR agreed with PLSR. It therefore can be concluded that MLR is a useful tool to identify the contributors to the wine colour, as stated in the report of Gómez-Míguez et al. (2007). Nevertheless, it must be noted that PLSR fully displayed the importance of the seven monomeric anthocyanins to wine colour, but MLR just showed which anthocyanins showed significant relations.
Using other statistical techniques, several authors have also found certain correlations between the monomeric anthocyanin component and wine colour. Using PCR, Han et al. (2009) observed that Cy3g showed the highest colour value, whereas Mv3g had the least colour value. Cano-López et al. (2006) found that colour intensity correlated significantly with the concentration of pyranoanthocyanins, but not monoglucoside anthocyanins, in micro-oxygenated Monastrell wine by adopting regression analysis. As can be seen, the results of previous studies on the correlation of anthocyanins with colour are not consistent. This is due to the fact that red wine is a complex solution and that various factors can affect wine colour. The amount and composition of anthocyanins in red wine varies greatly with species, cultivar, maturity, season, yield and vinification (Gao et al., 1997; Arozarena et al., 2000; Ho et al., 2001; Gómez-Míguez & Heredia, 2004; Cano-López et al., 2006; Gómez-Míguez et al., 2007; Gómez-Gallego et al., 2011). Factors influencing wine colour or anthocyanin composition all affect their relationships. In order to confirm this, a great number of wines need to be studied under different conditions.
CONCLUSIONS
Correlations between anthocyanin composition and the CIELab parameters of young red wine from Cabernet Sauvignon, Cabernet Gernischt, and Merlot were discussed in this research. Grape variety influenced the correlations significantly. Dp3g was the anthocyanin that contributed the most to the colour of Cabernet Sauvignon and Merlot wine, but for Cabernet Gernischt wine the most important anthocyanin for colour was Mv3ac. MLR and PLSR were both effective methods to draw linkages between anthocyanin components and wine colour, and could verify the results. This work will be helpful for understanding the colour differences between monomeric anthocyanins, and will provide an important basis for studying the influences of monomeric anthocyanins on young red wine colour.
LITERATURE CITED
Arozarena, I., Casp, A., Marín, R. & Navarro, M., 2000. Multivariate differentiation of Spanish red wines according to region and variety. J. Sci. Food Agric. 80, 1909-1917. [ Links ]
Ayala, F., Echávarri, J. & Negueruela, A., 1997. A new simplified method for measuring the colour of wines. I. Red and rosé wines. Am. J. Enol. Vitic. 48, 357-363. [ Links ]
Bakowska, A., 2003. The effects of heating, UV irradiation, and storage on stability of the anthocyanin-polyphenol copigment complex. Food Chem. 81, 349-355. [ Links ]
Boulton, R., 2001. The copigmentation of anthocyanins and its role in the colour of red wine: A critical review. Am. J. Enol. Vitic. 52, 67-87. [ Links ]
Cano-López, M., Pardo-Minguez, F., López-Roca, J.M. & Gómez-Plaza, E., 2006. Effect of microoxygenation on anthocyanin and derived pigment content and chromatic characteristics of red wines. Am. J. Enol. Vitic. 57, 325-331. [ Links ]
Chung, S.J., Heymann, H. & Grün, I.U., 2003. Application of GPA and PLSR in correlating sensory and chemical data sets. Food Qual. Prefer. 14, 485-495. [ Links ]
Cozzolino, D., Smyth, H.E., Lattey, K.A., Cynkar, W., Janik, L., Dambergs, R.G., Francis, I.L. & Gishen, M., 2005. Relationship between sensory analysis and near infrared spectroscopy in Australian Riesling and Chardonnay wines. Anal. Chim. Acta 539, 341-348. [ Links ]
Dalla, C. & Laureano, O., 1994. Effect of pH, sulphur dioxide, alcohol content, temperature and storage time on colour composition of a young Portuguese red table wine. J. Sci. Food Agric. 65, 477-485. [ Links ]
Gao, L., Girard, B., Mazza, G. & Reynolds, A., 1997. Changes in anthocyanins and colour characteristics of Pinot Noir wines during different vinification processes. J. Agric. Food Chem. 45, 2003-2008. [ Links ]
Gómez-Gallego, M.A., Gómez García-Carpintero, E., Sánchez-Palomo, E., Hermosín-Gutiérrez, I. & Gonzalez Vinas, M.A., 2011. Study of phenolic composition and sensory properties of red grape varieties in danger of extinction from the Spanish region of Castilla-La Mancha. Eur. Food Res. Technol. 234, 295-303. [ Links ]
Gómez-Míguez, M., González-Miret, M.L. & Heredia, F.J., 2007. Evolution of colour and anthocyanin composition of Syrah wines elaborated with pre-fermentative cold maceration. J. Food Eng. 79, 271-278. [ Links ]
Gómez-Míguez, M. & Heredia, F.J., 2004. Effect ofthe maceration technique on the relationships between anthocyanin composition and objective colour of Syrah wines. J. Agric. Food Chem. 52, 5117-5123. [ Links ]
Gómez-Plaza, E., Gil-Muñoz, R., López-Roca, J. & Martinez, A., 1999. Colour and phenolic compounds of a young red wine as discriminating variables of its ageing status. Food Res. Int. 32, 503-507. [ Links ]
Gómez-Plaza, E., Gil-Muñoz, R., López-Roca, J. & Martinez, A., 2000. Colour and phenolic compounds of a young red wine. Influence of wine- making techniques, storage temperature, and length of storage time. J. Agric. Food Chem. 48, 736-741. [ Links ]
Han, F.L., Jiang, S.M., He, J.J., Pan, Q.H., Duan, C.Q. & Zhang, M.X., 2009. Anthocyanins in <Cabernet Gernischet> (Vitis vinifera L. cv.) aged red wine and their colour in aqueous solution analysed by partial least square regression. Food Sci. Biotechnol. 18, 724-731. [ Links ]
Han, F.L., Zhang, W.N., Pan, Q.H., Zheng, C.R., Chen, H.Y. & Duan, C.Q., 2008. Principal component regression analysis of the relation between CIELab colour and monomeric anthocyanins in young Cabernet Sauvignon wines. Molecules 13, 2859-2870. [ Links ]
He, F., Liang, N.N., Mu, L., Pan, Q.H., Wang, J., Reeves, M.J. & Duan, C.Q., 2012. Anthocyanins and their variation in red wines I. Monomeric anthocyanins and their colour expression. Molecules 17, 1571-1601. [ Links ]
Heredia, F., Francia-Aricha, E., Rivas-Gonzalo, J., Vicario, I. & Santos-Buelga, C., 1998. Chromatic characterization of anthocyanins from red grapes - I. pH effect. Food Chem. 63, 491-498. [ Links ]
Ho, P., Da Silva, M. da C.M. & Hogg, T.A., 2001. Changes in colour and phenolic composition during the early stages of maturation of port in wood, stainless steel and glass. J. Sci. Food Agric. 81, 1269-1280. [ Links ]
Jackson, R.S., 2008 (3rd ed). Wine science: Principle and applications. Elsevier Academic Press: Oxford, UK. [ Links ]
Jensen, J.S., Demiray, S., Egebo, M. & Meyer, A.S., 2008. Prediction of wine colour attributes from the phenolic profiles of red grapes (Vitis vinifera). J. Agric. Food Chem. 56, 1105-1115. [ Links ]
Kallithraka, S., Tsoutsouras, E., Tzourou, E. & Lanaridis, P., 2006. Principal phenolic compounds in Greek red wines. Food Chem. 99, 784-793. [ Links ]
Mazza, G. & Brouillard, R., 1990. The mechanism of co-pigmentation of anthocyanins in aqueous solutions. Phytochemistry 29, 1097-1102. [ Links ]
Monagas, M., Martín-Álvarez, P.J., Bartolome, B. & Gómez-Cordovés, C., 2005. Statistical interpretation of the colour parameters of red wines in function of their phenolic composition during aging in bottle. Eur. Food Res. Technol. 222, 702-709. [ Links ]
Pérez-Magarino, S. & González-Sanjosé, M.L., 2003. Application of absorbance values used in wineries for estimating CIELab parameters in red wines. Food Chem. 81, 301-306. [ Links ]
Saenz-Navajas, M.P., Tao, Y.S., Dizy, M., Ferreira, V. & Fernandez- Zurbano, P., 2010. Relationship between nonvolatile composition and sensory properties of premium Spanish red wines and their correlation to quality perception. J. Agric. Food Chem. 58, 12407-12416. [ Links ]
Tang, K., Li, Y., Han, Y.H., Han, F.L., Li, J.M., Nie, Y. & Yan, X., 2014. Studies on preparative isolation and stability of seven main anthocyanins from Yan 73 grape. J. Sci. Food Agric. 94, 2472-2481. [ Links ]
Vidal, S., Francis, L., Williams, P., Kwiatkowski, M., Gawel, R., Cheynier, V. & Waters, E., 2004. The mouth-feel properties of polysaccharides and anthocyanins in a wine like medium. Food Chem. 85, 519-525. [ Links ]
Submitted for publication: April 2016
Accepted for publication: November 2016
Acknowledgements: This work was supported by the Project of China National Programmes for Hi-tech Research and Development (863 Program, 2013AA102108) and the Programme for Taishan Scholars, Shandong Province. All wine samples and Yan 73 (Vitis vinifera L.) grapes were provided by ChangYu Winery
* Corresponding author: E-mail address: yxu@jiangnan.edu.cn [Tel: +86 510 85918197; Fax: +86 510 85918201]

