


Services on Demand
Article
 English (pdf)
 Article in xml format
 Article references
Indicators

Related links
-
 Cited by Google
 -
 Similars in Google
Share

 Permalink
South African Journal of Enology and Viticulture
On-line version ISSN 2224-7904
Print version ISSN 0253-939X
S. Afr. J. Enol. Vitic. vol.37 n.2 Stellenbosch 2016
ORIGINAL RESEARCH ARTICLES
Spray deposition and control of Botrytis cinerea on grape leaves and bunches: part 1 (Table Grapes)
J.C. BrinkI; F.J. CalitzII; P.H. FourieI, III, *
IDepartment of Plant Pathology, Faculty of AgriSciences, Stellenbosch University, Stellenbosch, South Africa
IIARC Biometry Unit, Private Bag X5026, Stellenbosch 7599, South Africa
IIICitrus Research International, PO Box 28, Nelspruit 1200, South Africa
ABSTRACT
Insufficient quantity but also quality of spray deposition on susceptible grapevine tissue (i.e. target sites) and favourable conditions for pathogens could lead to control failure during high disease pressure situations. To determine deposition quantity and quality benchmarks for biologically effective spray deposits, bunches and leaves of table grapes (Waltham Cross) were sprayed at various growth stages, using different application volumes of a mixture of fenhexamid and a fluorescent tracer pigment and subsequently dusted with dry conidia of Botrytis cinerea where after infection levels on pedicels, receptacles and leaves were determined. Pigment deposition quantity and quality were determined from photos of sprayed parts taken with a digital camera under a stereo microscope and black light illumination at x30 or x10 magnifications and assessed with digital image and Hoerl regression analyses. The deposition quantity resulting in 75% control of B. cinerea infection (FPC75 values) was calculated from biological efficacy curves (sigmoidal regression analyses) for leaves and for each growth stage, for pedicels and receptacles. Deposition quantity and quality measurements correlated favourably with Botrytis infection. An optimal deposition value for the control of B. cinerea was determined by increasing spray volume, however by increasing spray volume and deposition quantity or quality levels past this optimum will not significantly improve disease control further. It was indicated that efficacy of agricultural chemicals could be influenced by improving both deposition quantity and quality, quantifiable by digital image analyses of fluorescent pigment deposition. FPC75 values obtained in this study can be used as benchmarks to evaluate future spray application in vineyards.
Key words: quality, quantity, volume, fluorescent pigment
INTRODUCTION
Grapevine downy mildew (Plasmopara viticola), powdery mildew (Erysiphe necator) and Botrytis bunch rot (Botrytis cinerea) are economically the most important diseases on grapevines. If favourable environmental conditions prevail and poor management strategies are applied, these diseases often cause severe crop losses. Practical management of these diseases relies almost exclusively on well-timed and/or routine fungicide applications; therefore producers invest heavily in chemical products and spray equipment. Laboratory studies showed that B. cinerea was effectively controlled with the available botryticides, provided that sufficient deposition on susceptible tissue was obtained (Van Rooi, 2001; Van Rooi & Holz, 2003; Brink et al., 2006). Similar efficiency was, however, not achieved when the same fungicides were applied in the vineyards, using conventional spraying methods (Holz et al., 2003). It is therefore highly likely that poor control of diseases in vineyards is often attributed to insufficient deposition on susceptible tissue.
As much as 40-50% of foliar spray was lost to the ground, especially when high spray volumes were applied to run-off (Matthews, 1997).
The primary objective of spray technology is to optimise deposition and activity of the fungicide or pesticide active ingredient, of which the plant surface is a critical component in the spray application process, specifically in the retention of spray droplets (Bukovac et al., 1986; Holloway; 1993; Hunche et al., 2006). Spray application which ensures efficient deposition of the active ingredient on target sites (i.e. susceptible grapevine tissue) is an essential requirement for effective disease management of fruit and foliar diseases in vineyards. There are many reported investigations, comparing the biological efficacy of different fungicide applications. However, there are few investigations, which relate control of the disease / pest directly to information on spray deposition and its distribution on the host. In turn, investigations on the physical distribution of spray deposition often lack bioassays because of the difficulty in obtaining valid data (Barber & Landers, 2002). Spray assessments of these factors should therefore be made directly from host tissue. Artificial targets, such as water-sensitive papers, can be used for spray assessment, but to give a true indication of spray deposits and penetration, the cards orientation and surface properties need to be the same as the target (Holownicki et al., 2002). Therefore, the water-sensitive cards cannot represent an accurate indication of the spray deposition on a 3-dimensional natural target site, such as structural grape bunch parts. Furthermore, this method is not sensitive to spray droplets smaller than 50 μm and the significant influence of spray parameters such as adjuvants, dose response, and growth stage of different bunch parts on spray deposition (Barry & Weber, 2002; Brink et al., 2004).
Fluorescent tracers and residue recovery techniques can be used to provide an overall assessment of quantity of spray deposits (Cunningham & Harden, 1999; Gil et al., 2007; ISO, 2007; Fourie et al., 2009; van Zyl et al., 2010ab; Pergher et al., 2013; van Zyl et al., 2013, 2014). However, they do not give a good indication of application quality such as uniformity or spray distribution on the leaves and bunch parts. Fluorescent tracers are also subject to adsorption and photo degradation (Holownicki et al., 2002). Visual assessment gives an indication of the quality of the application, but the human eye lacks deposition quantity measuring and speed of measurement (Derksen & Jiang, 1995). At the time of this study, there was no appropriate spray assessment protocol that could be used to assess quantity and quality of spray deposition on a susceptible bunch part on a 3-dimensional microscopic level.
Brink et al. (2004) developed and validated a spray deposition assessment protocol using fluorometry, photomicrography and digital image analyses to assess spray deposition on susceptible grape bunch parts. Brink et al. (2006) used this spray assessment technique in developing a protocol that could be used to determine the effect of different spray deposition levels on B. cinerea incidence. However, they could not determine the minimum effective deposition levels needed for effective control of B. cinerea in grape bunches to be used as spray deposition benchmarks to evaluate spray application in vineyards for the control of this and other important grapevine diseases. Sufficient spray deposition levels were not attained to ensure adequate control of Botrytis infections and Brink et al. (2006) indicated several factors resulting in insufficient infections, such as too low spray volumes (or spray deposition), as well as inconsistent conidium and fungicide spray deposition on the structural bunch parts. This inconsistent conidium and fungicide spray deposition on the structural bunch parts was largely due to the 3-dimensional structure of bunches and bunch compactness, which led to variation in conidium and fungicide spray deposition to determine minimum effective deposition values. Brink et al. (2006) recommended that variation in conidium and spray deposition might be minimised by cutting bunches into a two dimensional shape, which would subsequently lead to better linear relations between spray cover and B. cinerea infection levels.
Furthermore, the Brink et al. (2006) protocol did not address deposition quality measurements nor did it include deposition studies on grapevine leaves. Grape leaf blades carry high amounts of B. cinerea and it was hypothesised that pre-blossom leaf infection is an important primary infection event playing an important role in the epidemiology of the pathogen on grapevines (Holz et al., 2003). Young leaves are highly susceptible to Botrytis infection and are infected at especially the leaf base, which remains asymptomatic (Holz et al., 2003). As the leaves mature, they become increasingly resistant to infection due to a thicker cuticle layer and the presence of inhibitory compounds (Langcake & Pryce, 1976).
The aim of this study was i) to improve the spray assessment protocol described and validated by Brink et al. (2004, 2006) to enable spray deposition quantity and quality measurements on grape bunches and leaves, and ii) to determine the minimum effective spray deposition levels needed for effective B. cinerea control on susceptible grapevine tissue, similar to those developed by van Zyl et al. (2013) for Alternaria brown spot control on mandarin citrus leaves.
MATERIALS AND METHODS
Spray application
Grape bunches (study conducted during 2004-2005 season) and leaves (study conducted during 2005-2006 season) were selected from the table grape cultivar Waltham Cross in two vineyards in the Paarl region (Western Cape Province, South Africa) for study purpose to further improve a previously developed spray assessment protocol. Grape bunches were selected for assessments at different berry development stages, namely at berry set, pea-size, bunch closure and pre-harvest, while the 4th or 5th leaves were selected from the apical ends of green shoots between pea-size and bunch closure stages. Bunches were cut into a 2-dimensional shape to minimise variation in conidium and spray deposition, as recommended by Brink et al. (2006). Bunches and leaves were surface-sterilised before use (30 s in 70% ethanol, 2 min in 0.35% sodium hypochlorite, and 30 s in 70% ethanol) and air-dried. Bunches and leaves were sprayed with six different application volumes ranging between 1-11 mL and 0.5-9 mL, for bunches and leaves respectively. Control treatments were left unsprayed. Sprays consisted of a mixture of fenhexamid (Teldor® 500 SC, Bayer Cropscience, Isando, South Africa) at the recommended concentration (75 mL/100 L) (Nel et al., 2003) and Yellow Fluorescent Pigment® (400 g/L, EC) (South Australian Research and Development Institute, Loxton SA 5333 Australia) at 200 mL/100 L (Furness, 2000). Brink et al. (2005) indicated that growth of B. cinerea was not affected by the fluorescent pigment. Sprays were applied by means of a gravity feed mist spray gun (ITW DEVILBISS Spray Equipment Products, 195 Internationale Blvd, Glendale Heights IL 60139 USA) with a fluid nozzle tip of 1.5 mm in diameter in a spray chamber, which consisted of a steel framework (800 x 1410 x 660 mm; L x H x W). Application was conducted at 75 kPa at a spray angle of 45° and 1.4 m from the plant part. For each treatment replicate and assessment purpose, one detached leaf or bunch were positioned horizontally on a mesh tray with the upper or lower leaf surface facing upward. Bunches were sprayed on both sides, whereas leaves were sprayed on one side only.
Image capturing and analysis
From each sprayed bunch, three pedicel samples were taken for spray efficiency assessment. Sprayed pedicels from bunches and leaves were illuminated under black light [six BLB T5/6W fluorescent tubes (Lohuis, Kruisweg 18, Netherlands)], as described in Brink et al. (2004). The fluorescent tubes were installed in a custom-made hexagonal illumination box that fitted closely around the P-Plan 1X lens (xlO.0-63.0 magnification) of a 800 stereoscopic zoom microscope (Nikon SMZ, www.nikon.com). Images were captured with a digital camera (Nikon DMX 1200, www. nikon.com) through a stereoscopic microscope at x30 (pedicels) and x10 (leaves) magnifications. Image analysis was conducted by means of Image-Pro Plus version 6.2 software for Windows (Media Cybernetics, www.mediacy.com). Two images were taken on the sprayed sides of leaves, one on the L1 and the other on the L2 sinus lobes (Guisard & Birch, 2005). The other half of the leaf was used for B. cinerea infection assessment. Images could be analysed for deposition quantity and quality by using the measurement tool in Image-Pro Plus.
Deposition quantity analysis involved removal of green channels from the original colour image. A threshold was done to binarise the image into foreground objects (i.e. fluorescent particles) and background (Fig. 1A). An area of interest (AOI) of 1/100 the size of the image was placed in the top left corner of the image and moved across the image. A count of foreground elements (deposited pigment) was done at each iteration and the total area quantified and expressed as percentage area of pigment particles in relation to the AOI. The median deposition quantity of 100 measurements was used for further analysis.
Euclidian distance map of the binarised image was created for deposition quality analysis of spray deposition on leaves (Fig. 1B). The max-white pixel indicated the point furthest removed from any foreground objects (i.e. pigment particles). A thinning filter was used to attain the skeleton of the background (Fig. 1C). Using the AND function between the distance map and the skeletonised image, a new distance skeleton image was created (Fig. 1D). By analysing a histogram of the grey-scale values of the distance skeleton, the statistics of the distances in pixels between foreground objects was expressed. The black (0 value) was ignored in the statistics. Higher values indicated larger distances between objects, while smaller values indicate smaller distances between objects, and therefore a better quality spray deposition.
Inoculation and incubation
A virulent isolate of B. cinerea, obtained from a naturally infected grape berry, was maintained on potato dextrose agar (PDA; Biolab, Midrand, South Africa) at 5°C. For the preparation of inoculum, the isolate were first grown on tomato (surface sterilised in 70% alcohol for 30 s) quarters. Grape medium (GM) was prepared (1000 mL water, 1.95 g fructose, 0.25 g sucrose, 0.15 g malic acid, 5 g peptone, 5 g NaCl, 15 g bacteriological agar, 1.85 g glucose and 2 g yeast extract), after which conidiophores from the colonised fruit were transferred to the medium in Petri dishes and incubated at 22°C for 7 days. Dry conidia were harvested with a suction-type collector and stored at 5°C until use. Storage time did not affect germination of dry conidia (Spotts & Holz, 1996). To determine the minimum effective spray deposition levels needed for effective B. cinerea control on susceptible grapevine tissue, detached bunches and leaves were inoculated with 3 mg dry conidia, which was dispersed by air pressure into the top of an inoculation tower (Plexiglas, 3 x 1 x 1 m [height x depth x width]) according to the method of Salinas et al. (1989). The conidia were allowed 20 minutes to settle onto bunches and leaves, which were positioned on two separate screens on the floor of the inoculation tower. By using this inoculation technique, approximately three conidia were evenly deposited as single spores on each mm2 of plant surface (Coertze & Holz, 1999). Petri dishes with water agar (WA) were placed next to the bunches or leaves and percentage germination determined 6 h post inoculation (100 conidia per Petri dish, two replicates). Following inoculation, the plant parts were placed on sterile epoxy-coated steel mesh screens (53 χ 28 x 2 cm) in ethanol-disinfected perspex (Cape Plastics, Cape Town, South Africa) chambers lined with a sheet of chromatography paper, of which the base was placed in water to establish high relative humidity (>93% RH). The chambers with inoculated berries and leaves were incubated for 24 h at 22°C. According to Gütschow (2001), sufficient germination, surface colonisation and penetration of grapevine leaves occur within this period. These conditions are similar to what the pathogen commonly encounters on grape bunches or leaves in nature, namely dry conidia on dry plant surfaces under high relative humidity (Gütschow, 2001). Non-inoculated bunches or leaves were used to determine the natural infection levels of B. cinerea.
Assessment of B. cinerea
Incidence of viable B. cinerea conidia, germlings and/or infections, occurring on leaves, receptacles and pedicels was determined by means of isolations onto paraquat medium as per methods described by Brink et al. (2006). Twenty receptacles and 20 pedicels per cluster and 25 sections (5 mm in diameter) per leaf were isolated on Petri dishes containing water agar medium supplemented with paraquat (Grindat & Pezet, 1994). Paraquat terminates host resistance in the cells of the cuticular membrane without damaging host tissue (Grindat & Pezet, 1994) and allows the development of conidia and mycelia on the surface, as well as mycelia in the tissue in the absence of active defense (Coertze & Holz, 1999; Coertze et al, 2001). The plates were incubated at 22°C under diurnal light and the sections were monitored daily for symptom expression and development of B. cinerea. After 11 days, B. cinerea typically sporulated on infected sections. The number of sections yielding sporulating B. cinerea colonies were recorded and used to determine the incidence percentage of B. cinerea.
Minimum effective spray deposition levels for effective B. cinerea control
For upper and lower leaf surfaces, and each bunch part and stage (berry set, pea-size, bunch closure and pre-harvest) combination, regression analyses were conducted for volume vs. spray deposition and spray deposition vs. percentage B. cinerea incidence. The fluorescent pigment deposition quantity and quality needed for 75% control of B. cinerea infection (FPC75 values) on bunch parts and each leaf side was subsequently calculated for each stage (berry set, pea-size, bunch closure and pre-harvest).
Experimental design and statistical analyses
Median values of deposition quantity (percentage area covered by fluorescent pigment) and deposition quality (grey-scale values of skeleton of Euclidian map of binarised images) as well as infection data, were subjected to the appropriate analysis of variance using SAS v. 8.2 statistical software (SAS Institute, 1999). Student's t-Least Significance Difference was calculated at the 5% significance level to compare treatment means of significant effects (Snedecor and Cochran, 1967). Hoerl regression analyses of deposition quantity (y = AxBeCx) and deposition quality [y = A(x+1)BeC(x+1)] and sigmoidal regression analyses [y = A+B/(1+e(-1(x-C)/D))] of infection data related to spray volumes, were calculated to demonstrate treatment effects and trends (Daniel & Wood, 1971). Pearson's correlation analysis was also conducted to compare mean infection values for pedicels and receptacles with deposition data.
RESULTS
Spray deposition on bunches and leaves Bunches
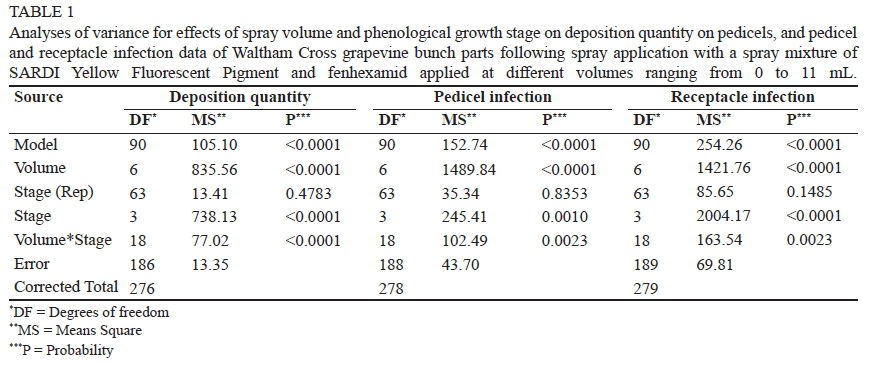
Analysis of variance for effects of spray volume on deposition quantity values on pedicels of Waltham Cross grapevine bunch parts showed a significant 2-factor (volume x stage) interaction (P < 0.0001, Table 1). The interaction yielded very good fits (R2values of 0.921 - 0.984) with Hoerl regression analyses for spray quantity deposition on pedicels at different growth stages (Table 2; Fig. 2). Generally, an increase in deposition quantity occurred across all growth stages as the spray volume was increased with a peak reached at a specific point for each of the curves. At berry set and pre-harvest, the deposition quantity on pedicels decreased with a further increase in spray volume, probably due to the effect of run-off. However, mean deposition quantity values per stage were not significant different between 7, 9 and 11 mL per bunch part (Table 2; Fig. 2). Deposition quantity tended to be higher in the younger growth stages (berry set and pea size) compared with older growth stages (bunch closure and pre-harvest).
Leaves
Deposition quantity
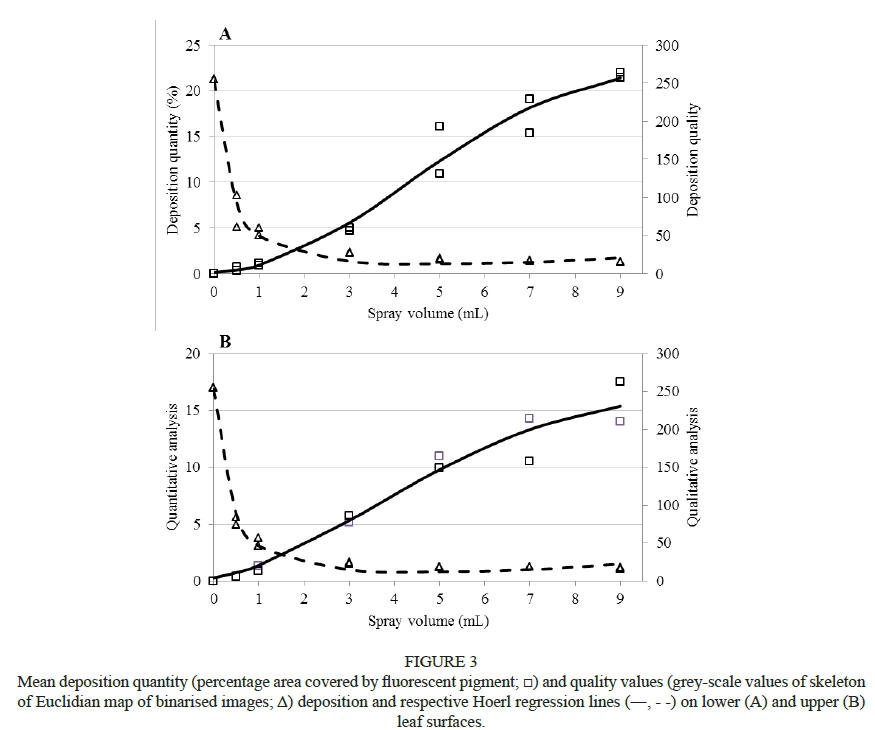
Analysis of variance of the deposition quantity on leaves indicated significant interaction between leaf side x spray volume (P = 0.0440, Table 3). Hoerl regression analyses for deposition quantity values on upper and lower leaf surfaces yielded very good fits (R2 values of 0.984 and 0.987, respectively; Table 4; Fig. 3). Deposition quantity increased on upper and lower leaf surface as spray volume was increased (Fig 3). Student's T-tests revealed that there were no significant differences between mean deposition quantity values on upper and lower leaf surfaces for volume 1 mL to 5 mL however, lower leaf surfaces yielded significantly higher deposition values for 7 mL and 9 mL (17.2% and 21.7%, respectively) compared to upper leaf surfaces (12.4% and 15.8%, respectively).
Deposition quality
Analysis of variance of deposition quality values on leaves (Table 3) indicated a significant effect for spray volume (P < 0.0001), but not for leaf side (P = 0.9521). Deposition quality improved with the increase of spray volume and fitted concave curves yielding very good fits with Hoerl regression for both upper (R2= 0.989) and lower leaf surfaces (R2 = 0.995; Table 4; Fig. 3). Contradictory to deposition quantity which increased significantly as the volume increased, optimal deposition quality was reached at 3 mL for both leaf surfaces with no further improvement as the volume was increased further.
Minimum effective spray deposition levels for effective B. cinerea control
Germination of the inoculated B. cinerea conidia on water agar plates was between 92% and 98%. Incidence of natural B. cinerea infection on bunch parts was very low (< 1%) and the data were therefore not considered in further analyses.
Bunches
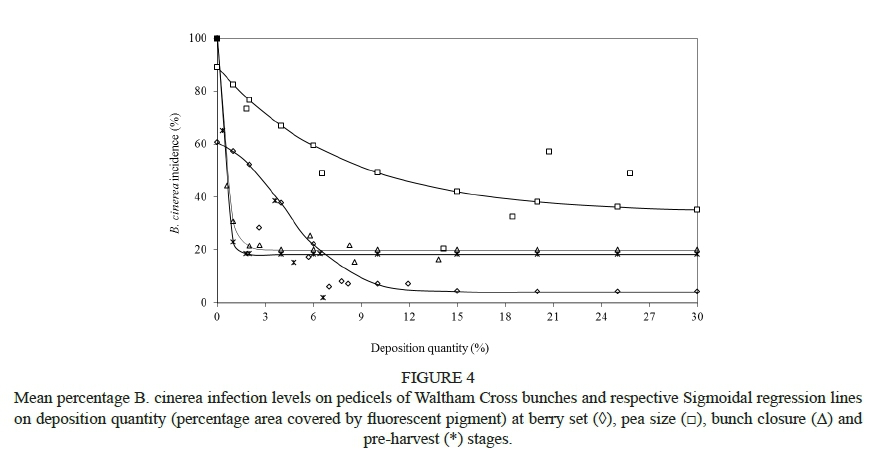
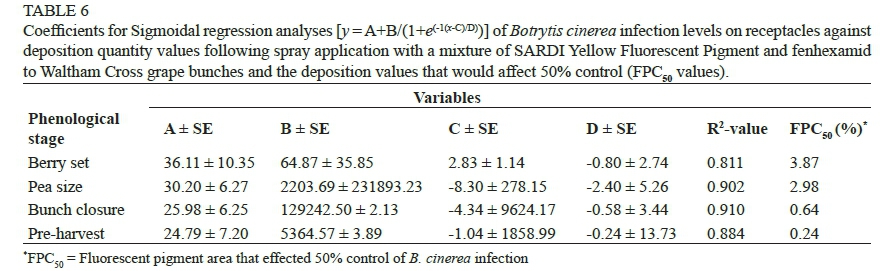
Analyses of variance for effects of spray volume on infection values on pedicels and receptacles indicated significant 2-factor (stage x volume) interactions (P = 0.0023 and P = 0.0023, respectively; Table 1). B. cinerea infection levels on both pedicels and receptacles decreased with increase of spray volume (Fig. 4 and 5). The highest infection levels were obtained at 0 mL of spray mixture for all stages; with pea size and bunch closure showing significant higher infection levels compared with berry set and pre-harvest. Sigmoidal regression analyses for B. cinerea infection levels on pedicels and receptacles over deposition quantity yielded fairly good fits (R2 values of 0.685 - 0.988, and 0.811 - 0.910; Table 5 and 6 and Fig. 4 and 5 for pedicels and receptacles, respectively. B. cinerea infection levels on both pedicels and receptacles decreased with increase of spray deposition quantity (Fig. 4 and 5). The highest infection levels were obtained at 0% spray deposition quantity for all stages. Good correlation (Pearson's correlation of >82%; results not shown) was found between infection levels on pedicels and receptacles. A general reduction in FPC75 values on pedicels from 5.9% to 0.9% was also observed from berry set to pre-harvest (Table 5). No FPC75 values could be calculated from the receptacle treatments, as 75% control of infections could not be reached by any of the deposition values, hence FPC50 values were subsequently calculated. These values showed the same trend as on pedicels as the FPC50 also decreased from berry set to pre-harvest (3.87% and 0.24%, respectively, Table 6).
Leaves
The analysis of variance for the B. cinerea infection values on sprayed leaves indicated significant effects for spray volume (P < 0.0001) but not for leaf side (P = 0.9479; Table 3). The highest mean infection levels were obtained between 0 mL to 1 mL (86.5% - 91.0%). The lowest infection levels were observed on leaves sprayed between 5 mL and 9 mL (8.63% to 0.38%); however, 9 mL did not yield significantly lower infection levels compared to 5 mL (as per Student's T test; results not shown).
Sigmoidal regression analyses of infection values over deposition quantity and quality values indicated that lower leaf surfaces gave markedly poorer regression fits (R2 values of 0.521 and 0.495, respectively) compared to upper leaf surfaces (R2 values of 0.837 and 0.984, respectively) (Table 7; Fig. 6). For 25% infection (FPC75 benchmarks), the deposition quantity and quality was calculated at 8.7% and 23.9, respectively on upper leaf surfaces and 10.7% and 22.8, respectively on lower leaf surfaces (at approximately 4 mL spray volume). The FPC75 values for upper and lower leaf surfaces were therefore comparable (Table 7; Fig. 6).
DISCUSSION
Successful improvements of the previous spray assessment protocol were made with deposition quantity regressions fits improving from between 53% and 59% (Brink et al., 2004) to between 92% and 98% on pedicels and also used a new deposition quantity and quality assessment protocol on grape leaves. Deposition measurements on sprayed leaves (deposition quantity and quality) and bunch parts (quantity) correlated favourably with Botrytis infection levels. It was clearly demonstrated that an increase in spray volume resulted in increased deposition, as shown previously by Brink et al. (2004 & 2006) and deposition quantity on pedicel surfaces decreased prior to the perceived point of run-off. Van Zyl et al. (2010a) used the same spray assessment protocol on leaves and found increased deposition quantity and quality with increasing of spray volume with a backpack sprayer with volumes of 27, 167, 334, 476, 581 and 698 L/ha in Chardonnay vineyards. However, from 476 L/ha for deposition quantity and 334 L/ha for quality, no significant improvement were recorded. This is an indication that grapevine bunch parts and leaves have a maximum capability to retain the spray mixture, where after it is lost due to run-off. Similar detrimental effects of runoff on spray deposition as well as control of Alternaria brown spot of mandarins was also demonstrated by Fourie et al. (2009). The trends were not recorded in this study on leaves, probably since spray volumes were not high enough.
Deposition quantity values on leaves increased as spray volume was increased on both upper and lower leaf surfaces. In general, deposition quantity was better on upper than on lower leaf surfaces at low spray volumes as was also observed by Gaskin et al. (2005) and Van Zyl (2010b). However, using a similar spray technique than Van Zyl et al. (2010a), but at higher spray volumes, the present study found that lower leaf surfaces resulted in higher deposition quantity values at the higher spray volumes (7 and 11 mL) compared to upper leaf surfaces. This might be explained by the observation of the accumulation of spray mixture among the veins of lower surfaces of leaves. Therefore, at higher spray volumes, lower leaf surfaces can hold more water and therefore more deposition than upper leaf surfaces. However, deposition quality was not influenced by leaf side. Deposition quantity on pedicels tended to be higher in the younger growth stages (berry set and pea size) compared with older growth stages (bunch closure - pre-harvest). This might be explained by increasing roughness of pedicel surfaces with maturity, which influenced photomicrography and image analyses.
Deposition values effecting 75% control (FPC75 values) were determined to allow more effective evaluation of spray deposition studies in table grapes. These values could not be determined from receptacles, which is an indication that this part of the bunch was more susceptible and therefore more difficult to control B. cinerea infections (Holz et al., 2003).
On pedicels and receptacles, the highest FPC75 and FPC50 values respectively, were measured early in the season and decreasing as the season progressed. This could possibly be attributed to the increase of host resistance (Holz et al., 2003). However, it might also be due to the decrease of deposition quantity as bunches reach maturity. It is therefore essential that FPC75 values should be obtained for each growth stage, since with the onset of ontogenic resistance, less deposition quantity of fungicide would be required to control disease.
The deposition quantity and quality FPC75 values for upper and lower leaf sides were comparable. This correlates with work on Chardonnay leaves where similar deposition quantity and quality values resulted in similar infection levels (Van Zyl et al., 2010a). This is an indication that the fenhexamid deposition requirement to control B. cinerea infection is similar on both surfaces.
CONCLUSION
This study contributes to the understanding of how spray volume influences spray deposition quantity and quality and its influence on disease control of B. cinerea on Waltham Cross grapevine leaves and bunches. Increasing spray volume increased deposition quantity and quality and a reduction of B. cinerea infections on pedicels, receptacles and grapevine leaves. The efficacy of the fungicide, fenhexamid, was influenced by both deposition quantity (amount of deposit) and quality (spatial distribution of deposit). Deposition quality also improved with spray volume, but only to a certain point; hereafter deposition quantity levels increased significantly with increasing spray volume, although infection levels did not increase significantly. This implies that there is an optimal deposition quality level for the control of B. cinerea on grapevine leaves and by increasing the spray volume and deposition quantity levels past this point will not significantly improve disease control nor improve the quality of spray deposition. This shows the importance of including a deposition quality assessment when research is conducted to improve contact fungicide disease control.
The implication of an optimum deposition quantity and quality level needed to control B. cinerea might be to improve spray application by applying a spray equipment specific spray volume that will give optimal deposition quality and then to adjust the dosage of the fungicide spray mixture rather the spray volume. It should, however, be noted that the study of spray deposition under field conditions would be considerably more complex than laboratory spray deposition on detached plant parts. Future studies should therefore focus on improving spray deposition by optimising spray volume of commercial spray applicators and to evaluate low volume high concentration spray application under field conditions. The FPC75 values obtained in this study can be used as benchmarks to evaluate future spray application studies in table grape vineyards.
LITERATURE CITED
Barber, J.A.S. & Landers, A.J., 2002. The Pros and Cons of volume and rate reduction in orchard spraying. Annual American Society of Agricultural and Biological Engineers Meeting, U.S.A. [ Links ]
Barry, S.I. & Weber, R.O., 2002. The application of pesticides to grape bunches. In: Proc. 2001 Mathematics-in-Industry Study Group, Australia. pp. 28-40. [ Links ]
Brink, J.C., Holz, G., Calitz, F.J. & Fourie, P.H., 2004. Development of a protocol to quantify spray deposits on grape bunches. In: Proc. 7th International Symposium on Adjuvants for Agrochemicals. ISAA 2004 Foundation, South Africa. pp. 230-236. [ Links ]
Brink, J.C., Holz, G., Calitz, F.J. & Fourie, P.H., 2005. A protocol to quantify spray deposits in grape bunches. SA Fruit Journal 4 (2), 50-53. [ Links ]
Brink, J.C., Holz, G. & Fourie, P.H., 2006. Effect of fungicide spray cover on Botrytis cinerea infection in grape bunches. S. Afr. J. Enol. Vitic. 27, 51-56. [ Links ]
Bukovac, M.J., Reichard, D.L. & Whitmoyer, R.E., 1986. The spray application process: Central for the efficient use of growth regulators in tree fruits. Acta Hortic. 179, 33-45. [ Links ]
Coertze, S. & Holz, G., 1999. Surface colonization, penetration. and lesion formation on grapes inoculated fresh or after cold storage with single airborne conidia of Botrytis cinerea. Plant Dis. 8, 917-924. [ Links ]
Coertze, S., Holz, G. & Sadie, A., 2001. Germination and establishment of infection on grape berries by single airborne conidia of Botrytis cinerea. Plant Dis. 85, 668-677. [ Links ]
Cunningham, G.P. & Harden, J., 1999. Sprayers to reduce spray volume in mature citrus trees. Crop Prot. 18, 275-281. [ Links ]
Daniel, C. & Wood, F.S., 1971. Fitting Equations to Data: Computer Analysis of Multi-factor Data for Scientists and Engineers. John Wiley & Sons, New York. [ Links ]
Derksen, R.C. & Jiang, C., 1995. Automated detection of fluorescent spray deposits with a computer vision system. T. Am. Soc. Agr. Eng., ASAE 38, 1647-1653. [ Links ]
Fourie, P.H., Brink, J.C., du Preez, M. & Schutte, G.C., 2009. The effect of runoff on spray deposition and control of Alternaria brown spot of mandarins. Australas. Plant Pathol. 38, 173-182. [ Links ]
Furness, G.O., 2000. SARDI Fluorescent Pigment suspension concentrate. Fact Sheet 1-2000. South Australian Research and Development Institute, SARDI. SARDI Primary Industries and Resources, Australia. [ Links ]
Gaskin, R.E., Steele, K.D. & Foster, W.A., 2005. Characterising plant surfaces for spray adhesion and retention. N. Z. Plant Protect. -SE 8, 179183. [ Links ]
Gil E.,_Escola A., Rosell R.L., Planas S. & Vald L., 2007. Variable rate application of plant protection products in vineyard using ultrasonic sensors. Crop Prot. 26, 1287-1297. [ Links ]
Grindat, D. & Pezet, R., 1994. Le Paraquat, un Outil pour la Révation Rapide d' Infections Fongiques latentes et de Champignons Endophytes. J. Phytopathol. 141, 86-89. [ Links ]
Guisard, Y. & Birch C.J., 2005. Towards developing reliable models of leaf area on grapevines (Vitis vinifera L.). Frutic 5, 305-313. [ Links ]
Gütschow, M., 2001. Resistance to Botrytis cinerea in parts of leaves and bunches of grapevine. Thesis, Stellenbosch University, Private Bag X1, 7602 Matieland (Stellenbosch), South Africa. [ Links ]
Holloway, P. J., 1993. Extended Summaries SCI Pesticide Group Symposium, Third International Symposium on Adjuvants for Agrochemicals. Pestic. Sci. 37, 203-232. [ Links ]
Holz, G., Gütschow, M., Coertze, S. & Calitz, F.J., 2003. Occurrence of Botrytis cinerea and subsequent disease expression at different positions on leaves and bunches of grape. Plant Dis. 87, 351-358. [ Links ]
Holownicki, R., Doruchowski, G., Swiechowski, W. & Jaeken, P,. 2002. Methods of evaluation of spray deposit and coverage on artificial targets. Electronic Journal of Polish Agricultural Universities, Agricultural Engineering 5 (1), 1-9. [ Links ]
Hunche, M., Bringe, K., Schmitz-Eiberger, M. & Noga, G., 2006. Leaf surface characteristics of apple seedlings, bean seedlings and Kohlrabi plants and their impact on the retention and rainfastness of mancozeb. Pest Manag. Sci. 62, 839-847. [ Links ]
ISO (International Organization for Standardization), 2007. Crop protection equipment - Field measurement of spray distribution in tree and bush crops. ISO 22522, www.iso.org/obp/ui/#iso:std:36305:en [ Links ]
Langcake, P. & Pryce, R.J., 1976. The production of resveratrol by Vitis vinifera and other members of the Vitaceae as a response to infection or injury. Physiol. Plant Pathol. 9, 77-86. [ Links ]
Matthews, G.A., 1997. Pesticide application: Current status and further developments. Phytoparasitica 25 (Suppl.), 11S-19S. [ Links ]
Nel, A., Krause, M. & Khelawanalall, N., 2003. A Guide for the Control of Plant Diseases. Government Printer, South Africa. [ Links ]
Pergher G., Gubiani R., Cividino S.R.S., Dell'Antonia D. & Lagazio C., 2013. Assessment of spray deposition and recycling rate in the vineyard from a new type of air-assisted tunnel sprayer. Crop Prot. 45, 6-14. [ Links ]
Salinas, J., Glandorf, D.C.M., Picavet, F.D. & Verhoeff, K., 1989. Effects of temperature, relative humidity and age of conidia in the incidence of spotting on gerbera flowers caused by Botrytis cinerea. Neth. J.Plant Pathol. 95, 51-64. [ Links ]
SAS Institute, 1999. SAS/GRAPH Software: Reference Volume 1, Version 8, Cary, NC: SAS Institute Inc. [ Links ]
Snedecor, G.W. & Cochran, W.G., 1967. (6th ed). Statistical Methods. The Iowa State University Press, AMES, IOWA, USA. [ Links ]
Spotts, R.A. & Holz, G., 1996. Adhesion and removal of conidia of Botrytis cinerea and Penicillium expansum from grape and plum fruit surfaces. Plant Dis. 80, 688-692. [ Links ]
Van Rooi, C., 2001. Infection by dry, airborne Botrytis cinerea conidia and fungicide efficacy on different parts of grape bunches and vinlettes. Thesis, Stellenbosch University, Private Bag X1, 7602 Matieland (Stellenbosch), South Africa. [ Links ]
Van Rooi, C. & Holz, G., 2003. Fungicide efficacy against Botrytis cinerea at different positions on grape shoots. S. Afr. J. Enol. Vitic. 24, 11-15. [ Links ]
Van Zyl, S.A., Brink, J.C., Calitz F.J. & Fourie, P.H., 2010a. The use of adjuvants to improve spray deposition and Botrytis cinerea control on Chardonnay grapevine leaves. Crop Prot. 29, 58-67. [ Links ]
Van Zyl, S.A., Brink, J.C., Calitz F.J. & Fourie, P.H., 2010b. Effects of adjuvants on deposition efficiency of fenhexamid sprays applied to Chardonnay grapevine foliage. Crop Prot. 29, 843-852. [ Links ]
Van Zyl, J.G., Fourie, P.H. & Schutte, C.G., 2013. Spray deposition assessment and benchmarks for control of Alternaria brown spot on mandarin leaves with copper oxychloride. Crop Prot. 46, 80-87. [ Links ]
Van Zyl, J.G., Siewerding, E.G., Viljoen D.J. & Fourie, P.H., 2014. Evaluation of two organosilicone adjuvants at reduced foliar spray volumes in South African citrus orchards of different canopy densities. Crop Prot. 64, 198-206. [ Links ]
Submitted for publication: November 2015
Accepted for publication: August 2016
Acknowledgements: The research was conducted as part of a PhD study at Stellenbosch University and was funded by Winetech, Deciduous Fruit Producers Trust and the National Research Foundation.
* Corresponding author: phfourie@sun.ac.za
