


Services on Demand
Article
 English (pdf)
 Article in xml format
 Article references
Indicators

Related links
-
 Cited by Google
 -
 Similars in Google
Share

 Permalink
South African Journal of Enology and Viticulture
On-line version ISSN 2224-7904
Print version ISSN 0253-939X
S. Afr. J. Enol. Vitic. vol.37 n.2 Stellenbosch 2016
ORIGINAL RESEARCH ARTICLES
Spray deposition and control of Botrytis cinerea on grape leaves and bunches: part 2 (Wine Grapes)
J.C. BrinkI; F.J. CalitzII; P.H. FourieI, III, *
IDepartment of Plant Pathology, Faculty of AgriSciences, Stellenbosch University, Stellenbosch, South Africa
IIARC Biometry Unit, Private Bag X5026, Stellenbosch 7599, South Africa
IIICitrus Research International, PO Box 28, Nelspruit 1200, South Africa
ABSTRACT
Poor control of fruit and foliar diseases in vineyards is often attributed to insufficient spray deposition of susceptible tissue. To optimise spray deposition, a deposition assessment protocol using fluorometry, photomicrography and digital image analyses was developed to determine minimum spray deposition quantity and quality levels needed for effective B. cinerea control in wine grapes (Chenin blanc). Leaves and bunches were sprayed at different growth stages with different volumes of a mixture of fenhexamid and fluorescent pigment. Pigment deposition quantity and quality were determined from photos of pedicels and leaves taken with a digital camera under a stereo microscope and black light illumination at x30 and x10 magnification, respectively. After inoculation with dry airborne conidia of B. cinerea infection levels on pedicels, receptacles and leaves were determined and infection levels and deposition data were subjected to sigmoidal and Hoerl regression analyses, respectively. From these biological efficacy curves the deposition levels that affected 75% control of B. cinerea infection (FPC75 values) were calculated for leaves and for each growth stage for pedicels and receptacles. Deposition measurements on sprayed leaves and bunch parts correlated favourably with Botrytis infection levels. An increase in spray volume resulted in higher deposition quantity and improved quality values with a reduction of B. cinerea infections. However, at a certain point, deposition quality remained constant and infection levels did not decrease significantly with increasing spray volume. Susceptibility of pedicels and receptacles to B. cinerea decreased with maturity. FPC75 values can be used as benchmarks to evaluate spray application in wine grape vineyards.
Key words: Quality, quantity, volume, fluorescent pigment
INTRODUCTION
Botrytis cinerea Pers.:Fr causes grey mould (Nair & Hill, 1992) on grapevines (Vitis vinifera L.) in all vineyards of the world and can severely reduce crop quality and yield. In wine grape production, juice from Botrytis infected grapes is darker, with higher volatile acids, pectin and mucins and bitterer than the must from healthy grapes (Bulit & Dubos, 1994). Low amino nitrogen and high sugar levels can lead to slow fermentation (Somers, 1984). Wines from B. cinerea infected grapes have off-flavours and are sensitive to oxidation and secondary contamination by bacteria making the wine unsuitable for aging (Bulit & Dubos, 1994).
Substantial research was conducted on aspects of B. cinerea in South African vineyards (Coertze et al., 2001; Van Rooi, 2001; Coertze & Holz, 2002; Holz et al., 2003; Van Schoor, 2004). Collectively, these studies found that B. cinerea was most frequently found in the air and on/in plant parts during the pre-bloom until bunch closure stage. Various studies (Coertze et al., 2001; Coertze & Holz 2002; Holz et al., 2003) have found that B. cinerea symptom expression was predominantly associated with the bases of the berry and the pedicel. The next prominent positions occupied were rachises and laterals and not the berry cheek. Young grape leaves were highly susceptible and were infected especially at the leaf base, which often remained asymptomatic (Holz et al., 2003). As the leaves matured, they got increasingly resistant to infection due to a thicker cuticle layer and the presence of inhibitory compounds (Langcake & Pryce, 1976).
The control of B. cinerea infection by chemical, cultural and biological means can only be achieved by reducing inoculum on susceptible plant parts at the appropriate growth stage when propagules are present (Van Rooi & Holz, 2003). The control of plant diseases with a fungicide depends on delivering the chemical to the site of infection (i.e. the structural bunch parts and leaves), at the appropriate time and at a cost that is reasonable to the economics of the crop being produced (Brandes, 1971). Therefore, the main objective is not in spraying a crop per se, but rather in effectively covering established or potentially infected targets (Fulton, 1965). Knowledge of the duration and dynamics of fruit susceptibility to infection is critical for intelligent use of fungicides in managing grape diseases (Weed, 1903).
Identification of target sites naturally revolves around the susceptibility of various plant parts at different phenological stages. B. cinerea (Pearson & Goheen, 1988; Holz et al., 2003), powdery mildew (Erysiphe necator [Schw.] Burr.) (Chellemi & Marois, 1992; Delp, 1954; Gadoury et al., 2003) and downy mildew (Plasmopara viticola [Berk. & Curt.] Berl. & De Toni) (Kennelly et al., 2005) are linked to key phenological stages during which susceptibility to infection is maximal. As for Botrytis, structural bunch parts also appear to be essential in the disease expression of powdery mildew (Gadoury et al., 2001; Gadoury et al., 2003) and downy mildew (Kennelly et al., 2005). This is also true for other bunch rot fungi, such as Penicillium, Aspergillus, Alternaria, Mucor and Rhizopus spp. (Hewitt, 1974; Holz et al., 2003). It is therefore essential that spray assessments should be made directly from host tissue and specifically from the susceptible plant parts. This is also important in choosing a suitable spray assessment protocol.
Artificial targets, such as water-sensitive papers, can be used for spray assessment, but is not ideal as it does not have the same orientation and surface properties of a 3-dimensional natural target site (Holownicki et al., 2002), such as structural grape bunch parts target. Fluorescent tracers and residue recovery techniques (Cunningham & Harden, 1999; Gil et al., 2007; ISO, 2007; Fourie et al., 2009; van Zyl et al., 2010ab; Pergher et al., 2013; van Zyl et al., 2013, 2014) are more suitable, but do not always give a good indication of application quality such as uniformity or spray distribution on the leaves and bunch parts. Visual assessment of fluorescent pigment deposition gives an indication of the quality of the application, but the human eye lacks deposition quantity measuring and speed of measurement (Derksen & Jiang, 1995). At the time of this study, there was no appropriate spray assessment protocol that could be used to assess quantity and quality of spray deposition on a susceptible bunch part on a 3-dimensional microscopic level. Measurement of deposition quality is an important aspect as "a high-level deposit badly distributed is less efficient than a low-level deposit well distributed" (Frick, 1970). A good spray assessment protocol should therefore consist of spray deposition quantity and quality measurements. The importance of including a deposition quality assessment when research is conducted to improve contact fungicide disease control has also been shown by Van Zyl et al. (2010a, 2010b), Chaim et al. (2003) and in Brink et al. (2016). Brink et al. (2004) developed a spray assessment protocol that gives an indication of quantity of spray deposition in grape pedicels using fluorescence microscopy and digital image analyses. This protocol was improved in Brink et al. (2016) to also include deposition quantity and quality assessments from grapevine leaves. These were used to determine benchmark values for effective control of B. cinerea infections on Waltham Cross table grape bunch and leaf tissue (Brink et al., 2016). Van Zyl et al., (2010a, 2010b), Chaim et al. (2003) and Brink et al. (2016) indicated that there are optimal deposition levels for disease control on grapevine leaves, and increasing the spray volume and deposition quantity or quality levels past this point might not significantly improve disease control. Similar to those developed by van Zyl et al. (2013) for Alternaria brown spot control on mandarin citrus leaves, spray deposition benchmark values were determined for table grapes (Waltham Cross, Brink et al., 2016) that could be used to optimise spray application studies in table grape vineyards. However, due to the differences in trellis and canopy management, benchmark values are also needed specifically for wine grapes.
The aim of this study was therefore to use the spray assessment protocol (Brink et al., 2004, 2006, 2016) to enable spray deposition quantity and quality measurements on wine grape bunches and leaves, and to determine the minimum effective spray deposition levels needed for effective B. cinerea control on susceptible Chenin blanc grapevine tissue.
MATERIALS AND METHODS
Spray application
Grape bunches (2004-2005) and leaves (2005-2006) were selected from the wine grape cultivar Chenin blanc in two vineyards in the Paarl region (Western Cape province, South Africa). Grape bunches were selected at berry set, pea-size, bunch closure and pre-harvest, while the 4th or 5th leaves from the apical ends of green shoots were selected between pea-size and bunch closure. Bunches were cut into a 2-dimensional shape to minimise variation in conidium and spray deposition, as recommended by Brink et al. (2006). Bunches and leaves were sprayed with six different application volumes ranging between 1-11 mL and 0.25-7 mL, for bunches and leaves respectively. Control treatments were left unsprayed. Sprays consisted of a mixture of fenhexamid (Teldor® 500 SC, Bayer Cropscience, Isando, South Africa) at the recommended concentration (75 mL/100 L) (Nel et al., 2003) and Yellow Fluorescent Pigment® (400 g/L, EC) (South Australian Research and Development Institute, Loxton SA 5333 Australia) at 200 mL/100 L (Furness, 2000). Brink et al. (2005) indicated that growth of B. cinerea was not affected by the fluorescent pigment. Sprays were applied by means of a gravity feed mist spray gun (ITW DEVILBISS Spray Equipment Products, 195 Internationale Blvd, Glendale Heights IL 60139 USA) with a fluid nozzle tip of 1.5 mm in diameter in a spray chamber, which consisted of a steel framework (800 x 1410 x 660 mm; L x H x W). Application was conducted at 75 kPa at a spray angle of 45° and 1.4 m from the plant part. For each treatment replicate and assessment purpose, one detached leaf or bunch were positioned horizontally on a mesh tray with the upper or lower leaf surface facing upward. Bunches were sprayed on both sides, whereas leaves were sprayed on one side only.
Image capturing and analysis
From each sprayed bunch, three pedicel samples were taken for spray efficiency assessment. Sprayed pedicels from bunches and leaves were illuminated under black light [six BLB T5/6W fluorescent tubes (Lohuis, Kruisweg 18, Netherlands)], as described in Brink et al. (2004). The fluorescent tubes were installed in a custom-made hexagonal illumination box that fitted closely around the P-Plan 1X lens (xlO.0-63.0 magnification) of a 800 stereoscopic zoom microscope (Nikon SMZ, www.nikon.com). Images were captured with a digital camera (Nikon DMX 1200, www. nikon.com) through a stereoscopic microscope at x30 (pedicels) and x10 (leaves) magnifications. Image analysis was conducted by means of Image-Pro Plus version 6.2 software for Windows (Media Cybernetics, www.mediacy.com). Two images were taken in the middle part of each leaf from the sprayed sides of leaves, one on the L1 (closer to the main vein) and the other on the L2 (closer to the leaf margin) sinus lobes (Guisard & Birch, 2005). The other half of the leaf was used for B. cinerea infection assessment. Images could be analysed for deposition quantity and quality by using the measurement tool in Image-Pro Plus.
Deposition quantity analysis involved removal of green channels from the original colour image. A threshold was done to binarise the image into foreground objects (i.e. fluorescent particles) and background (Brink et al., 2016). An area of interest (AOI) of 1/100 the size of the image was placed in the top left corner of the image and moved across the image. A count of foreground elements (deposited pigment) was done at each iteration and the total area quantified and expressed as percentage area of pigment particles in relation to the AOI. The median deposition quantity of 100 measurements was used for further analysis.
As demonstrated in Brink et al. (2016), an Euclidian distance map of the binarised image was created for deposition quality analysis of spray deposition on leaves. The max-white pixel indicated the point furthest removed from any foreground objects (i.e. pigment particles). A thinning filter was used to attain the skeleton of the background. Using the AND function between the distance map and the skeletonised image, a new distance skeleton image was created. By analysing a histogram of the grey-scale values of the distance skeleton, the statistics of the distances in pixels between foreground objects was expressed. The black (0 value) was ignored in the statistics. Higher values indicated larger distances between objects, while smaller values indicate smaller distances between objects, and therefore a better quality spray deposition.
Inoculation and incubation
A virulent isolate of B. cinerea, obtained from a naturally infected grape berry, was maintained on potato dextrose agar (PDA; Biolab, Midrand, South Africa) at 5°C. For the preparation of inoculum, the isolates were first grown on tomato (surface sterilised in 70% alcohol for 30 s) quarters. Grape medium (GM) was made up (1000 mL water, 1.95 g fructose, 0.25 g sucrose, 0.15 g malic acid, 5 g peptone, 5 g NaCl, 15 g bacteriological agar, 1.85 g glucose and 2 g yeast extract), after which conidiophores from the colonised fruit were transferred to the medium in Petri dishes and incubated at 22°C for 7 days. Dry conidia were harvested with a suction-type collector and stored at 5°C until use. Storage time did not affect germination of dry conidia (Spotts & Holz, 1996). Bunches and leaves were inoculated with 3 mg dry conidia, which was dispersed by air pressure into the top of an inoculation tower (Plexiglas, 3 x 1 x 1 m [height x depth x width]) according to the method of Salinas et al. (1989). The conidia were allowed 20 minutes to settle onto bunches and leaves that were positioned on two screens on the floor of the inoculation tower. By using this inoculation technique, approximately three conidia were evenly deposited as single cells on each mm2 of plant surface (Coertze & Holz, 1999). Petri dishes with water agar (WA) were placed next to the bunches or leaves and percentage germination was determined 6 h post inoculation (100 conidia per Petri dish, two replicates). Following inoculation, the plant parts were placed on sterile epoxy-coated steel mesh screens (53 x 28 x 2 cm) in ethanol-disinfected perspex (Cape Plastics, Cape Town, South Africa) chambers lined with a sheet of chromatography paper with the base placed in water to establish high relative humidity (>93% RH). The chambers were incubated for 24 h at 22°C. According to Gütschow (2001), sufficient germination, surface colonisation and penetration of grapevine leaves will occur within this period. These conditions are similar to what the pathogen commonly encounters on grape bunches or leaves in nature; namely, dry conidia on dry plant surfaces under high relative humidity (Gütschow, 2001). Non-inoculated bunches or leaves were used to determine the natural infection levels of B. cinerea.
Assessment of B. cinerea
Incidence of viable B. cinerea conidia, germlings and/or infections, occurring on leaves, receptacles and pedicels was determined by means of isolations onto paraquat medium as per methods described by Brink et al. (2006). Twenty receptacles and 20 pedicels per cluster and 25 leaf discs (5 mm in diameter) per leaf were isolated on Petri dishes containing water agar medium supplemented with paraquat (Grindat & Pezet, 1994). Paraquat terminates host resistance in the cells of the cuticular membrane without damaging host tissue (Grindat & Pezet, 1994), and allows the development of conidia and mycelia on the surface, as well as mycelia in the tissue in the absence of active defence (Coertze & Holz, 1999; Coertze et al., 2001). The plates were incubated at 22°C under diurnal light and the sections were monitored daily for symptom expression and the development of B. cinerea. After 11 days, B. cinerea typically sporulated on infected sections. The number of sections yielding sporulating B. cinerea colonies were recorded, and used to determine the percentage incidence of B. cinerea.
Minimum spray deposition levels for effective B. cinerea control
For upper and lower leaf surfaces, and each bunch part and stage (berry set, pea-size, bunch closure and pre-harvest) combination, regression analyses were conducted for volume vs. spray deposition and spray deposition vs. percentage B. cinerea incidence. The fluorescent pigment deposition needed for 75% control of B. cinerea infection (FPC75 values) on bunch parts and each leaf side was subsequently calculated for each stage (berry set, pea-size, bunch closure and pre-harvest).
Experimental design and statistical analyses
Median values of deposition quantity (percentage area covered by fluorescent pigment) and deposition quality (grey-scale values of skeleton of Euclidian map of binarised images) as well as infection data, were subjected to the appropriate analysis of variance using SAS v. 8.2 statistical software (SAS Institute, 1999). Student's t-Least Significance Difference was calculated at the 5% significance level to compare treatment means of significant effects (Snedecor and Cochran, 1967). Hoerl regression analyses of deposition quantity (y = AxBeCx) and deposition quality [y = A(x+1)BeC(x+1) ] and sigmoidal regression analyses [y = A+B/(1+e(-1(xC)/D))] of infection data related to spray volumes, were done to demonstrate treatment effects and trends (Daniel & Wood, 1971). Pearson's correlation analysis was also conducted to compare mean infection values for pedicels and receptacles with deposition data.
RESULTS
Spray deposition on bunches and leaves Bunches
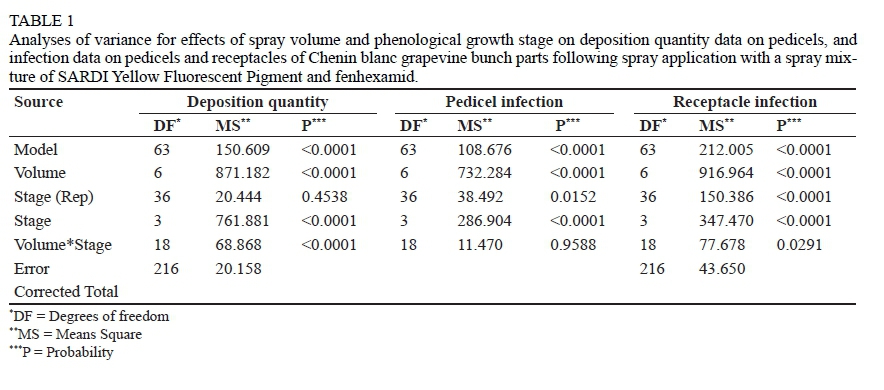
Analysis of variance of effects of spray volume on deposition quantity values on pedicels showed a significant 2-factor (volume x stage) interaction (P < 0.0001; Table 1). Hoerl regression analyses for deposition quantity on pedicels for this interaction yielded good fits for berry set, pea size and bunch closure (R2values of 0.860, 0.861 and 0.958, respectively), but poorer at pre-harvest (R2 = 0.450; Table 2; Fig. 1). There was generally an increase in deposition as spray volume increased for all growth stages. At pea size, the amount of deposition on pedicels decreased with further increase in spray volume probably due to the effects of run-off. However, mean deposition quantity values over all stages were not significantly different following spray volumes between 9 (11.42%) and 11 mL (11.94%; as determined by Student's T-tests). Deposition tended to be higher in the younger growth stages (berry set and pea size) compared with older growth stages (bunch closure and pre-harvest).
Leaves
Deposition quantity
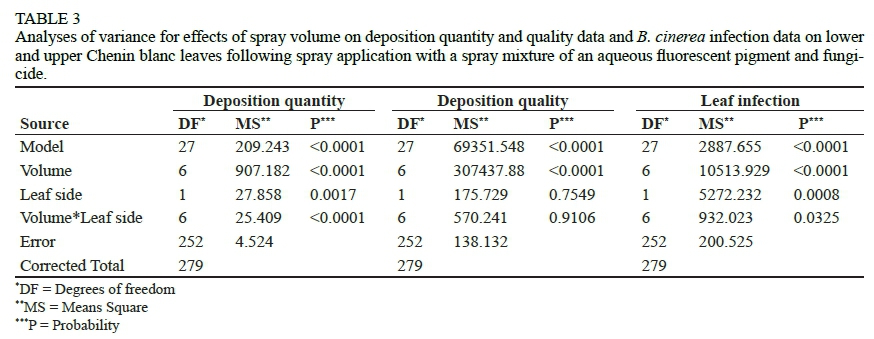
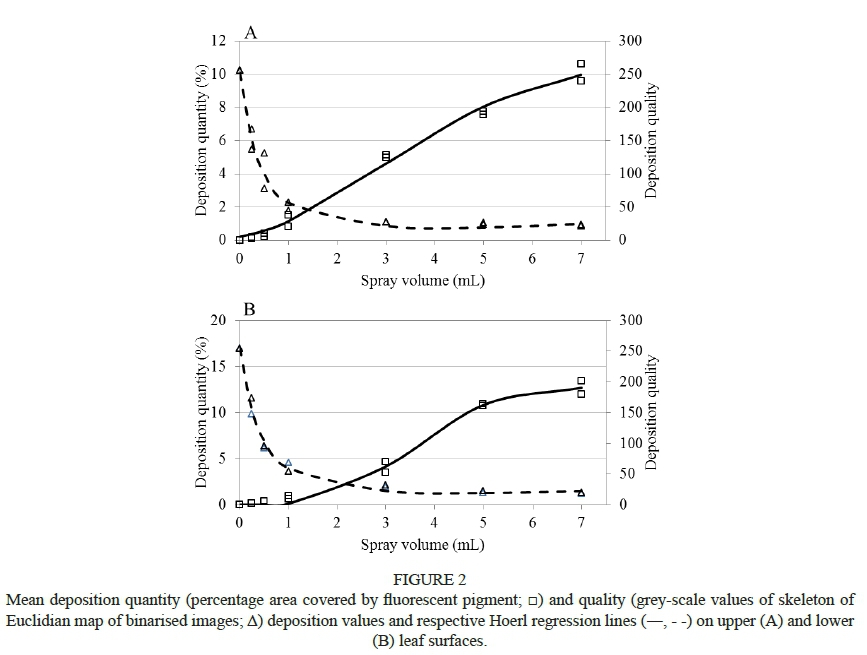
Analysis of variance of the deposition quantity values on leaves indicated significant leaf side x volume interaction (P < 0.0001, Table 3). Hoerl regression analyses for deposition quantity values on upper and lower leaf surfaces (R2values of 0.990 and 0.992, respectively) yielded very good fits (Table 4; Fig. 2). Deposition values increased as spray volume was increased on both leaf sides (Fig. 2). Upper and lower leaf surfaces recorded similar deposition values for each spray volume. However, deposition quantity was generally better on upper than on lower leaf surfaces at low spray volumes and vice versa at the higher spray volumes (5 and 7 mL; Fig. 2).
Deposition quality
Analysis of variance of deposition quality values on leaves (Table 3) indicated significant effects for spray volume (P < 0.0001), but not for leaf side (P = 0.9521). Deposition quality improved with the increase of spray volume and yielded very good fits with Hoerl regression for both upper (R2 = 0.977) and lower leaf surfaces (R2 = 0.990; Table 4; Fig. 2). Other than deposition quantity which increased significantly with increase of spray volume. Optimal deposition quality was reached at 3 mL for both leaf surfaces and did not improve significantly afterwards.
Minimum spray deposition levels for effective B. cinerea control
Germination of the inoculated B. cinerea conidia on water agar plates was between 92% and 98%. Incidence of natural B. cinerea infection on bunch parts was very low (< 1%) and the data was not considered in further analyses.
Bunches
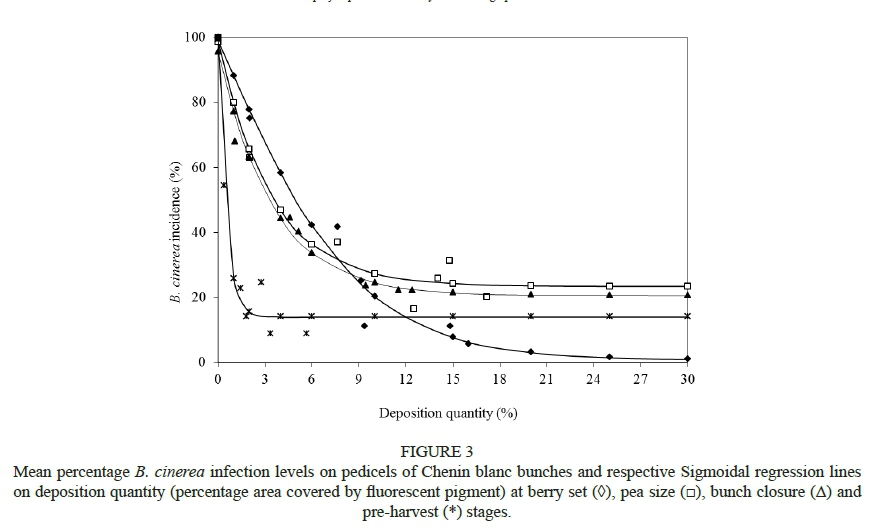
Analyses of variance indicated that spray volume (P < 0.0001) and growth stage (P < 0.0001) had a significant effect on B. cinerea infection levels on pedicels (Table 1). Sigmoidal regression analyses for B. cinerea infection levels on pedicels over deposition quantity yielded very good fits (R2 values of 0.966 - 0.978; Table 5 and Fig. 3). B. cinerea infection levels on pedicels decreased with the increase in spray deposition quantity on all growth stages (Fig. 3). In general, FPC75 values decreased with increased maturity; from 8.9% at berry set to 1.0% at pre-harvest. However, the highest FPC75 value was predicted at pea size (13.2%, Table 5).
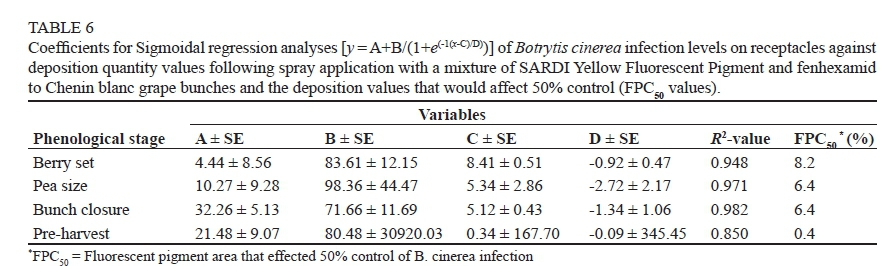
Analyses of variance for effects of spray volume on infection values on receptacles showed significant 2-factor (stage x volume) interactions (P = 0.0291; Table 1). Sigmoidal regression analyses for B. cinerea infection levels on receptacles over deposition quantity yielded very good fits (R2 values of 0.850 - 0.982; Table 6 and Fig. 4). As with pedicels, B. cinerea infection levels on receptacles decreased with increase in spray deposition quantity, showing similar trends. However, for receptacle infection, a clear upper asymptote was observed for berry set and bunch closure stages. At these stages, higher B. cinerea infections were recorded at lower deposition values (1 - 6%) compared to pea size and particularly pre-harvest. No FPC75 values could be calculated from the receptacle treatments, as deposition values could not effect 75% control of infections, therefore FPC50 values were calculated. These values showed the same trend as on pedicels, where the FPC50 value also decreased from berry set to pre-harvest (8.2% and 0.4%, respectively; Table 6).
Leaves
The analysis of variance for the B. cinerea infection data on sprayed leaves indicated a significant spray volume x leaf side interaction (P = 0.0325; Table 3). The highest infection levels were obtained between 0 to 0.5 mL (36.0% - 48.75%) on the lower leaf surfaces. The lowest infection levels were observed on leaves sprayed between 1 and 7 mL (0.5 - 0.75%) and no significant difference was observed in infection levels following sprays with 1 - 7 mL (as per Student's T test; results not shown). Sigmoidal regression analyses of infection values over deposition quantity and quality values indicated fairly good regression fits on upper leaves (R2values of 0.652 and 0.696, respectively), and good fits for deposition quantity on lower leaf surfaces (R2 = 0.810), but a poor fit for deposition quality analysis (R2 = 0.121) on the lower leaf surfaces (Table 7; Fig. 5). FPC75 benchmarks for deposition quantity and quality levels were calculated at 0.58% and 160, respectively on upper leaf surfaces (approx. at 0.5 mL spray volume) and 0.98% and 164.76, on lower leaf surfaces (approx. at 0.25 mL spray volume). The deposition quality benchmark values for upper and lower surfaces of leaves were therefore comparable, but the deposition quantity benchmark value (FPC75) on lower leaf surfaces was markedly higher compared to upper leaf surfaces (Table 7; Fig. 5).
DISCUSSION
In agreement with previous studies (Brink et al., 2004, 2006, 2016) using similar methodology, this study showed that an increase in spray volume resulted in increased deposition quantity and improved quality with a reduction of B. cinerea infections on pedicels, receptacles and grapevine leaves. Deposition measurements on sprayed leaves (deposition quantity and quality) and bunch parts (quantity) correlated favourably with Botrytis infection levels. Deposition quality on leaf surfaces improved with spray volume, but only to a certain point (approximately 3 mL spray volume), where after no further increase occurred. This correlates well with the 3 mL spray volume determined as the turn-point for Waltham Cross table grapes (Brink et al., 2016) and 750 L/ha from backpack mist blower (Van Zyl et al., 2010a) using similar methodology. However, after this point, deposition quantity levels still kept on increasing significantly with spray volume, although infection levels did not decrease further. This was also observed for B. cinerea infection on Waltham Cross bunches and leaves (Brink et al., 2016) and supports work done on California red scale Aonidiella aurantii (Maskell) on citrus, which also indicated that greater coverage does not necessarily result in greater efficacy (Garcerá et al., 2011). Similar detrimental effects of runoff on spray deposition as well as control of Alternaria brown spot of mandarins was also demonstrated by Fourie et al. (2009). The importance of deposition quality was reported previously (Frick, 1970; Van Zyl et al., 2010a, 2010b; Brink et al., 2016).
Deposition values affecting 75% control (FPC75 values) could not be determined for receptacles as with pedicels, which is an indication that this part of the bunch is more susceptible and hence more difficult to control B. cinerea infections (Holz et al., 2003; Viret et al., 2004; Brink et al., 2016). Deposition quantity measurements on pedicels tended to be higher in the earlier growth stages (berry set and pea size) compared with older growth stages (bunch closure and pre-harvest), which might also be due to the increasing roughness of these bunch parts with increasing maturity that influence image analysis (Brink et al., 2006). Nonetheless, the highest FPC75 and FPC50 (respectively) values were predicted for earlier phenological stages and it decreased as the season progressed, which could possibly be attributed to the increase in host resistance (Gütschow, 2001; Holz et al., 2003). This finding supports the importance of spray applications early on in the season (Van Rooi & Holz, 2003; Van Schoor, 2004). FPC75 values obtained for Chenin blanc pedicels were markedly higher compared to FPC75 values from Waltham Cross (Brink et al., 2016), indicating that Chenin blanc bunch parts are more susceptible to B. cinerea infections. Therefore larger quantities of fungicide may be required for control. Chenin blanc is known to be particularly susceptible to infection by B. cinerea under field conditions due to its tight cluster architecture (Orffer, 1979; Vail & Marois, 1991). However, in this study the grapes were cut into two dimensional shapes, therefore cluster tightness could not have had an influence on the observed susceptibility.
Susceptibility of Vitis species to B. cinerea infections have been established based on the berry and/or leaf cuticle thickness (Bonnet, 1903; Krostanova et al., 1989; Mlikota Gabler et al., 2003). Direct penetration of the cuticle has been described (Coertze & Holz, 1999; Coertze et al., 2001; Nelson 1956). Marois et al. (1987), Percival et al. (1993) and Zoffoli et al. (2009) indicated that a reduction in development of the cuticular membrane and deposition of the epicuticular wax layers would lead to increased susceptibility to B. cinerea infection of berries. If presumed that there is a positive correlation between berry and pedicel cuticle thickness, Waltham Cross, being a hybrid species (Hyams, 1952) would have a thicker berry cuticle of between 4 to 10 μπι compared to 1.5 to 3.8 μπι of Chenin blanc (Karadimtcheva, 1981) being from the Vitis vinifera species (Maul & Eibach, 1999). Moreover, Waltham Cross would be exposed to more sunlight due to looser bunch architecture, stricter canopy management in table grapes and therewith reduced canopy density. Additional sunlight exposure might further increase resistance to B. cinerea by thickening of the epicuticular wax layers (Meadows, 2008; Sholberg et al., 2008).
In general, Chenin blanc leaf side did not influence spray deposition or deposition quality benchmarks, as was observed on Waltham Cross (Brink et al., 2016). However, deposition quantities needed to control 75% of infections on Chenin blanc were markedly higher on lower leaf surfaces, indicating that lower leaf surfaces may be more susceptible to B. cinerea. However, Waltham Cross (Brink et al., 2016) had similar FPC75 values for deposition quantity on upper and lower leaf surfaces. This observation was also made for Chardonnay leaves (Van Zyl et al., 2010a). The internal anatomy and surface features of leaves often determine plant resistance to pathogen infection (Smith et al., 1996). Among such characters, aspects of stomata, cuticle and trichome morphology can influence disease resistance (Niks & Rubiales, 2002). Chenin blanc is known for its low number of stomata with only 4 stomata per 100 sq μm compared to the 6 stomata per 100 sq μm of Chardonnay leaves (Manoj et al., 2007). In general, stomata number is independent of susceptibility to B. cinerea (Bernard and Dallas, 1981). Thickness of epidermal, hypodermal cell layers, cuticle and wax contents are positively correlated with resistance to B. cinerea in a wide range of table grape cultivars (Mlikota Gabler et al., 2003). Furthermore, following germination of conidia, direct penetration through the intact cuticle and cell wall, rather than via stomata, appears to be the main infection pathway of B. cinerea as shown on roses (Elad, 1989). The cuticle of upper leaf surfaces of both cultivars would be thicker than that of the lower leaf surfaces (Boso et al., 2010). However, this does not explain the difference in susceptibly of lower leaf surfaces between cultivars. A plausible reason could be higher density of trichomes on the lower leaf surfaces of Chenin blanc compared to that of Waltham Cross. A study by Calo et al. (2006) associated the presence of trichomes with enhanced susceptibility to B. cinerea, following more opportunities for attachment of the fungal spores to the leaf surface as a possible explanation. This complexity of factors that might influence FPC75 values therefore indicate that benchmarks should be obtained for each growth stage and cultivar independently.
CONCLUSION
This study contributes to the understanding of how spray volume influences spray deposition quantity and quality and its influence on disease control of B. cinerea on Chenin blanc grapevine leaves and bunches. Increased in spray volumes increased deposition quantity, quality and control of infection levels; however, at a certain point, deposition quality and infection levels did not improve even though deposition quantity was still increasing. Therefore, higher spray volumes may increase deposition quantity levels but might not significantly improve disease control. Certain spray quantity and quality parameters are based on droplet spectra measurements with water, but does not consider the consequent effect following impact and retention, as well as the process of initial deposit formation on natural plant targets such as the effects of sticking and spreading. However, deposition values obtained from this study take in consideration these spray parameters and furthermore demonstrate their effects on biological efficacy. Furthermore, spray volume had similar effect on spray deposition on wine grapes (Chenin blanc) compared to table grapes (Waltham Cross); however, the same spray deposition differs in reaction to infections between the two cultivars. This is an important observation as it is an indication grapevine cultivars have different FPC75 values. Therefore to optimize disease control via fungicides, grapevine cultivar cannot be ignored and that spray deposition level that might be sufficient for one cultivar may not be sufficient for another. As this study was done on single leaves and pedicels, the influence of spray volume on deposition throughout the canopy could not be considered. Assessment of spray deposition in vineyards would be considerably more complex than laboratory spray deposition on detached plant parts. This study does, however, indicate that the efficacy of agricultural chemicals is influenced by deposition quantity (amount of deposit), quality (spatial distribution of deposit) and cultivar. FPC75 values obtained from this study will be used as benchmarks to evaluate and optimise spray application in vineyards as well as the effect of different spray adjuvants, fungicides and spray parameters such as spray volume and dosage.
LITERATURE CITED
Bernard, A.C. & Dallas, J.P., 1981. Observations on the number of stomata on berries of Vitis vinifera cultivars. Relationship with their reaction to grey mould (Botrytis cinerea). Progres Agricole et Viticole 98, 230-232. [ Links ]
Bonnet, A., 1903. Recherches sur la structure du grain de raisin. Ann . Ecole Natl.Agric., Montpellier, Nouv .SBr.III, 58-102. [ Links ]
Boso, S., Alonso-Villaverde, V., Santiago, J.L., Gago, P., Durrenberger, M., Duggelin, M., Kassemeyer, H.H. & Martinez, M.C., 2010. Macro- and microscopic leaf characteristics of six grapevine genotypes (Vitis spp) with different susceptibilities to grapevine downy mildew. Vitis 49, 43-50. [ Links ]
Brandes, G.A., 1971. Advances in fungicide utilization. Annu. Rev. Phytopathol. 9, 363-387. [ Links ]
Brink, J.C., Holz, G., Calitz, F.J. & Fourie, P.H., 2004. Development of a protocol to quantify spray deposits on grape bunches. In: Proc. 7th International Symposium on Adjuvants for Agrochemicals. ISAA 2004 Foundation, South Africa. pp. 230-236. [ Links ]
Brink, J.C., Holz, G. & Fourie, P.H., 2006. Effect of fungicide spray cover on Botrytis cinerea infection in grape bunches. S. Afr. J. Enol. Vitic. 27, 51-56. [ Links ]
Bulit, J. & Dubos, B., 1994. Botrytis bunch rot and blight. In: Pearson, R.C. & Goheen, A.C. (eds.). Compendium of Grape Diseases. APS Press, Minnesota. pp. 13-15. [ Links ]
Calo, L., Garci'a, I., Gotor C. & Luis, C., 2006. Leaf hairs influence phytopathogenic fungus infection and confer an increased resistance when expressing a Trichoderma a-1,3-glucanase Romero. J.Exp. Bot. 57, 3911- 3920. [ Links ]
Chaim, A., Pessoa, M.C.P.Y. & Ferracini, VL., 2003. Estudo comparativo de pulverizadores utilizados em videiras do Brasil. Memoria Technica Embrapa Meio Ambiente 6471. http://www.infoteca.cnptia.embrapa.br/bitstream/item/13672/1/artcongressA30.pdf. [ Links ]
Chellemi, D.O. & Marois, J.J., 1992. Influence of leaf removal, fungicide applications, and fruit maturity on incidence and severity of grape powdery mildew. Am. J.Enol.Vitic. 43, 53-57. [ Links ]
Coertze, S, & Holz, G., 1999. Surface colonization, penetration, and lesion formation on grapes inoculated fresh or after cold storage with single airborne conidia of Botrytis cinerea. Plant Dis. 83, 917-924. [ Links ]
Coertze, S. & Holz, G., 2002. Epidemiology of Botrytis cinerea on grape: wound infection by dry, airborne conidia. S. Afr. J. Enol. Vitic. 23, 72-77. [ Links ]
Coertze, S., Holz, G. & Sadie, A., 2001. Germination and establishment of infection on grape berries by single airborne conidia of Botrytis cinerea. Plant Dis. 85, 668-677. [ Links ]
Cunningham, G.P. & Harden, J., 1999. Sprayers to reduce spray volume in mature citrus trees. Crop Prot. 18, 275-281. [ Links ]
Daniel, C. & Wood, F.S., 1971. Fitting Equations to Data: Computer Analysis of Multi-factor Data for Scientists and Engineers. John Wiley and Sons, New York. [ Links ]
Delp, C.J., 1954. Effect of temperature and humidity on the grape powdery mildew fungus. Phytopathol. 44, 615-626. [ Links ]
Derksen, R.C. & Jiang, C., 1995. Automated detection of fluorescent spray deposits with a computer vision system. T. Am. Soc. Agr. Eng., ASAE 38, 1647-1653. [ Links ]
Elad, Y., 1989. Effect of abiotic conditions on development of grey mould of rose and scanning electron microscopy. Phytopathol.Mediterr. 28,128-130. [ Links ]
Fourie, P.H., Brink, J.C., du Preez, M. & Schutte, G.C., 2009. The effect of runoff on spray deposition and control of Alternaria brown spot of mandarins. Australas. Plant Pathol. 38, 173-182. [ Links ]
Frick, E.L., 1970. The effects of volume, drop size and concentration, and their interaction, on the control of apple powdery mildew by dinocap. Br. Crop Pr. 2, 23-33. [ Links ]
Fulton, R.H., 1965. Low volume spraying. Annu. Rev. Phytopathol. 3,175 196. [ Links ]
Furness, G.O., 2000. SARDI Fluorescent Pigment suspension concentrate. Fact Sheet 1-2000. South Australian Research and Development Institute, SARDI. SARDI Primary Industries and Resources, Australia. [ Links ]
Gadoury, D.M., Seem, R.C., Pearson, R.C., Wilcox, W.F. & Dunst, R.M., 2001. Effects of powdery mildew on vine growth, yield and quality of Concord grapes. Plant Dis. 85,137-140. [ Links ]
Gadoury, D.M., Seem, R.C., Ficke, A. & Wilcox, W.F., 2003: Ontogenic resistance to powdery mildew in grape berries. Phytopathol. 93, 547-555. [ Links ]
Garcerá, C., Moltó, E. & Chueca, P., 2011. Effect of spray volume of two organophosphate pesticides on coverage and on mortality of California red scale Aonidiella aurantii (Maskell). Crop Prot. 30, 693-697. [ Links ]
Gil E., Escola A., Rosell R.L., Planas S. & Vald L., 2007. Variable rate application of plant protection products in vineyard using ultrasonic sensors. Crop Prot. 26, 1287-1297. [ Links ]
Grindat, D. & Pezet, R., 1994. Le Paraquat, un Outil pour la Revelation Rapide d' Infections Fongiques latentes et de Champignons Endophytes. J. Phytopathol. 141, 86-89. [ Links ]
Guisard, Y. & Birch, C.J., 2005. Towards developing reliable models of leaf area on grapevines (Vitis vinifera L.) Information and Technology for Sustainable Fruit and Vegetable Production. Frutic 5, 305-314. [ Links ]
Gütschow, M., 2001. Resistance to Botrytis cinerea in parts of leaves and bunches of grapevine. Thesis, Stellenbosch University, Private Bag X1, 7602 Matieland (Stellenbosch), South Africa. [ Links ]
Hewitt, W.B., 1974. Rots and bunch rots of grapes. Calif. AES Bull. 868. [ Links ]
Holownicki, R., Doruchowski, G., Swiechowski, W. & Jaeken, P,. 2002. Methods of evaluation of spray deposit and coverage on artificial targets. Electronic Journal of Polish Agricultural Universities, Agricultural Engineering 5 (1), 1-9. [ Links ]
Holz, G., Gütschow, M., Coertze, S. & Calitz, F.J., 2003. Occurrence of Botrytis cinerea and subsequent disease expression at different positions on leaves and bunches of grape. Plant Dis. 87, 351-358. [ Links ]
Hyams, E., 1952. (1st ed.). A note on some hybrid grape vines. The Fruit Year Book. Royal Horticultural Society, England. [ Links ]
ISO (International Organization for Standardization), 2007. Crop protection equipment - Field measurement of spray distribution in tree and bush crops. ISO 22522, www.iso.org/obp/ui/#iso:std:36305:en [ Links ]
Karadimtcheva, B., 1981. Characteristics of the anatomical structure of the grape skin in relation to resistance to grey mold. Gradinar Lozar Nauka. 18, 94-99. [ Links ]
Kennelly, M.M., Gadoury D.M., Wilcox, W.F., Magarey, P.A. & Seem, R.C., 2005. Seasonal development of ontogenic resistance to downy mildew in grape berries and rachises. J. Phytopathol. 95, 1445-1452. [ Links ]
Koch H. & Strub, O., 2006. How fungicides affect the deposit formation on grape. (in German) Mitt. Biol. Bundesanst. Land- Forstwirtsch. 400, 425. [ Links ]
Koch H. & Strub, O., 2007. Effect of fungicides on the dynamics of deposit formation on grapevines. (in German) KTBL-Schrift 456, 47-53. [ Links ]
Krostanova, C., 1989. Anatomical berry skin structures of the Pamid cherven and Pamid cheren clones. Morphol. 38, 30-32. [ Links ]
Langcake, P. & Pryce, R.J., 1976. The production of resveratrol by Vitis vinifera and other members of the Vitaceae as a response to infection or injury. Physiol. Plant Pathol. 9, 77-86. [ Links ]
Manoj, K., Tusher, B. & Sushama, C., 2007. Anatomical variability in grape (Vitis vinifera) genotypes in relation to water use efficiency (WUE). Am. J.Plant Physiol. 2, 36-43. [ Links ]
Marois, J.J., Bledsoe, A.M., Bostock, R.M. & Gubler, W.D., 1987. Effects of spray adjuvants on development of Botrytis cinerea on Vitis vinifera berries. Phytopathol. 77, 1148-1152. [ Links ]
Maul, E. & Eibach, R., 1999. Vitis International Variety Catalogue. Information and Coordination Centre for Biological Diversity (IBV) of the Federal Agency for Agriculture and Food (BLE), Deichmanns Aue 29, 53179 Bonn, Germany. [ Links ]
Meadows, R., 2008. Research fuels sustainable viticulture revolution. Calif. Agr. 62, 127-131. [ Links ]
Mlikota Gabler, F., Smilanick, J.L., Mansour, M., Ramming. D.W. & Mackey, B.E., 2003. Correlations of morphological, anatomical, and chemical features of grape berries with resistance to Botrytis cinerea. Phytopathol. 93, 1263-1273. [ Links ]
Nair, N.G. & Hill, G.K., 1992. Bunch rot of grapes caused by Botrytis cinerea. In: Kumar, J., Chaube, H.S., Singh, U.S. & Mukhopadhyoy, A.N. (eds.). Plant Diseases of International Importance. Vol III: Diseases of Fruit Crops.). Prentice-Hall, New Jersey. pp. 147-169. [ Links ]
Nel, A., Krause, M.& Khelawanalall, N., 2003. A Guide for the Control of Plant Diseases. Government Printer, South Africa. [ Links ]
Nelson, K. E., 1956. The effect of Botrytis infection on the tissue of Tokay grapes. Phytopathol. 46, 223-229. [ Links ]
Niks, R.E. & Rubiales, D., 2002. Potentially durable resistance mechanisms in plants to specialized fungal pathogens. Euphytica 124, 201-216. [ Links ]
Orffer, C.J., 1979. Wine Grape Cultivars in South Africa. Human and Rousseau, Cape Town and Pretoria. [ Links ]
Pearson, R.C. & Goheen, A.C., 1988. Compendium of Grape Diseases. American Phytopathological Society, St. Paul, MN. [ Links ]
Percival, D.C., Sullivan, J.A. & Fisher, K.H., 1993. Effect of cluster exposure, berry contact and cultivar on cuticular membrane formation and occurrence of bunch rot (Botrytis cinerea PERS.: FR.) with 3 Vitis vinifera L. cultivars. Vitis 32, 87-97. [ Links ]
Pergher G., Gubiani R., Cividino S.R.S., Dell'Antonia D. & Lagazio C., 2013. Assessment of spray deposition and recycling rate in the vineyard from a new type of air-assisted tunnel sprayer. Crop Prot. 45, 6-14. [ Links ]
Salinas, J., Glandorf, D.C.M., Picavet, F.D. & Verhoeff, K., 1989. Effects of temperature, relative humidity and age of conidia in the incidence of spotting on gerbera flowers caused by Botrytis cinerea. Neth. J. Plant Pathol. 95, 51-64. [ Links ]
SAS Institute, 1999. SAS/GRAPH Software: Reference Volume 1, Version 8, Cary, NC: SAS Institute Inc. [ Links ]
Smith, P.H., Foster, E.M., Boyd, L.A. & Brown, J.K.M., 1996. The early development of Erysiphe pisi on Pisum sativum L. Plant Pathol. 45, 302309. [ Links ]
Sholberg, P.L., Lowery, T. & Bowen, P., 2008. Effect of early leaf stripping on bunch rot, powdery mildew, and sour rot of wine grapes. In: Burton, E.N. & Williams, P.V. (eds.). Crop Protection Research Advances. Nova Science Publishers, U.S.A. pp. 193-205. [ Links ]
Snedecor, G.W. & Cochran, W.G., 1967. (6th ed). Statistical Methods. The Iowa State University Press, AMES, IOWA, USA. [ Links ]
Somers, T.C., 1984. Botrytis cinerea - consequences for red wines. The Australian Grapegrower and Winemaker, Annual Technical Issue 244, 80-85. [ Links ]
Spotts, R.A. & Holz, G., 1996. Adhesion and removal of conidia of Botrytis cinerea and Penicillium expansum from grape and plum fruit surfaces. Plant Dis. 80, 688-692. [ Links ]
Vail, M.E. & Marois, J.J., 1991. Grape cluster architecture and the susceptibility of berries to Botrytis cinerea. Phytopathol. 81, 188-191. [ Links ]
Van Rooi, C., 2001. Infection by dry, airborne Botrytis cinerea conidia and fungicide efficacy on different parts of grape bunches and vinelettes. Thesis, Stellenbosch University, Private Bag X1, 7602 Matieland (Stellenbosch), South Africa. [ Links ]
Van Rooi, C. & Holz, G., 2003. Fungicide efficacy against Botrytis cinerea at different positions on grape shoots. S. Afr. J. Enol. Vitic. 24, 11-15. [ Links ]
Van Schoor, J., 2004. The ecology of Botrytis cinerea on grape in the Western Cape province. Thesis, Stellenbosch University, Private Bag X1, 7602 Matieland (Stellenbosch), South Africa. [ Links ]
Van Zyl, S.A., Brink, J.C., Calitz F.J. & Fourie, P.H., 2010a. The use of adjuvants to improve spray deposition and Botrytis cinerea control on Chardonnay grapevine leaves. Crop Prot. 29, 58-67. [ Links ]
Van Zyl, S.A., Brink, J.C., Calitz F.J. & Fourie, P.H., 2010b. Effects of adjuvants on deposition efficiency of fenhexamid sprays applied to Chardonnay grapevine foliage. Crop Prot. 29, 843-852. [ Links ]
Van Zyl, J.G., Fourie, P.H. & Schutte, C.G., 2013. Spray deposition assessment and benchmarks for control of Alternaria brown spot on mandarin leaves with copper oxychloride. Crop Prot. 46, 80-87. [ Links ]
Van Zyl, J.G., Siewerding, E.G., Viljoen D.J. & Fourie, P.H., 2014. Evaluation of two organosilicone adjuvants at reduced foliar spray volumes in South African citrus orchards of different canopy densities. Crop Prot. 64, 198-206. [ Links ]
Viret, O., Keller, M., Jaudzems, V. G. & Cole, F.M., 2004. Botrytis cinerea infection of grape flowers: Light and electron microscopical studies of infection sites. Phytopathol. 94, 850-857. [ Links ]
Weed, C.M., 1903 Spraying Crops, Why, When and How. New York Orange Judd Company, New York. [ Links ]
Zoffoli, J.P., Latorre, B.A. & Naranjo, P., 2009. Preharvest applications of growth regulators and their effect on postharvest quality of table grapes during cold storage. Postharvest Biol.Tec. 51, 183-192. [ Links ]
Submitted for publication: November 2015
Accepted for publication: August 2016
Acknowledgements: The research was conducted as part of a PhD study at Stellenbosch University and was funded by Winetech, Deciduous Fruit Producers Trust and the National Research Foundation.
* Corresponding author: phfourie@sun.ac.za
