


Services on Demand
Article
 English (pdf)
 Article in xml format
 Article references
Indicators

Related links
-
 Cited by Google
 -
 Similars in Google
Share

 Permalink
South African Journal of Enology and Viticulture
On-line version ISSN 2224-7904
Print version ISSN 0253-939X
S. Afr. J. Enol. Vitic. vol.37 n.2 Stellenbosch 2016
ORIGINAL RESEARCH ARTICLES
Ecophysiology, vigour, berry and wine characteristics of grapevines growing on and off heuweltjies
S.J. BekkerI; J.E. HoffmanI; S.M. JacobsII; A.E. StreverIII; J.L. van ZylI, *
IDepartment of Soil Science, Stellenbosch University, Private Bag X1, Matieland 7602, South Africa
IIDepartment of Conservation Ecology and Entomology, Stellenbosch University, Private Bag X1, Matieland 7602, South Africa
IIIDepartment of Viticulture and Oenology, Stellenbosch University, Private Bag X1, Matieland 7602, South Africa
ABSTRACT
Heuweltjies are unique landscape features putatively created by the termite Microhodotermes viator through their burrowing and nest-building activities. They have been closely examined in the natural veld of the Western Cape in the recent past and are the focus of many ecological studies, but their effect in cultivated landscapes (e.g. vineyards and orchards) has remained unexplored. This study addresses the vigour and physiology of vines growing on and off heuweltjies, as well as the wine emanating from these vines. This study was conducted on Cabernet Sauvignon and Shiraz in two climatic regions of the Western Cape, namely Stellenbosch (Mediterranean climate) and Robertson (semi-arid climate) respectively, to better understand how differences in heuweltjie characteristics correspond to differences in rainfall and temperature. Through the use ofANOVAs and Fisher's LSD post hoc tests to indicate statistical significance, it was apparent that the soil on and off heuweltjies differed significantly in respect of several physical and chemical properties. Consequently, soil water content was more favourable on heuweltjies, especially in the Stellenbosch area, where only supplementary irrigation was applied. Heuweltjies induce substantial changes in grapevine vigour and grape composition. Differences in grapevine physiology between heuweltjie and non-heuweltjie plots were subtle, but vine vigour was severely altered on the heuweltjie-associated vines, exhibiting excessive vegetative growth in Stellenbosch and leading to variations in berry and wine characteristics on and off the heuweltjies. The opposite was observed in the semi-arid climate of Robertson. The presence of heuweltjies in vineyards presents an opportunity to produce and market wines with a difference in respect of their characteristics and unique origin.
Key words: Termites, soil properties, soil water, canopy density, wine sensory analyses
INTRODUCTION
Many vineyards located in the main wine-producing area of South Africa, namely the Western Cape, possess a very unique element that alters its landscape at a micro-level. This unique element has been brought about by the activity of the harvester termite, Microhodotermes viator, which builds underground nests, leading to the formation of circular, raised earth mounds, locally called 'heuweltjies' (little hills). Heuweltjies are prominent landscape features in the southwestern parts of South Africa. They occupy roughly 14% to 25% of the land surface (Lovegrove & Siegfried, 1986; 1989; Picker et al., 2007), averaging 17 m in diameter and 1.45 m in height (Moore & Picker, 1991). In some areas, heuweltjies can even occupy up to 60% of the surface area in vineyards (Shange et al., 2006) and can modify the landscape considerably. Furthermore, heuweltjies associated with different biomes differ in size, composition and distribution. In the Fynbos biome, heuweltjies are common and can range from 10 to 20 m in diameter and be up to five meters high (Re-belo et al., 2006), with shale or granite layers usually just a few meters beneath the soil surface (Lovegrove & Siegfried, 1986; Knight et al., 1989; F. Ellis, personal communication, 2010). Heuweltjies in the Succulent Karoo biome are approximately 30 m in diameter and one meter high.
Heuweltjies seem to be restricted mainly to areas below the Great Escarpment that separates the higher lying inland plateau from the lower lying coastal region (Ellis, 2001). They can also be found in diverse environments, ranging from the succulent Karoo to the coastal Renosterveld and Fynbos (Picker et al., 2007). The soil and vegetation cover that generally occurs on and between heuweltjies differs significantly. In the central part of a heuweltjie, the soil is more base rich and calcareous compared to the outer, non-calcareous parts or in between the heuweltjies. Heuweltjies are virtually absent on base-poor parent material, such as sandstone. They also contain higher concentrations of nutrients than the soils surrounding them (Midgley & Musil, 1990; Picker et al., 2007). On-mound soils are also more aerated, with increased water availability as well as higher levels of both macro- and micro-elements. The water infiltration and absorption rates on heuweltjies can be impaired and are related to the formation of algal crusts or salinity (Palmer et al., 1999). Considering the above-mentioned, it is evident that on-mound vegetation under natural conditions is distinctly different from that occurring off-mound (Knight et al., 1989; Midgley & Musil, 1990; Picker et al., 2007).
Heuweltjies in all stages of development, ranging from loose soil and frass over young termite colonies to large mounds up to 32 m in diameter, can be distinguished in the landscape (Lovegrove & Siegfried, 1989). The formation of heuweltjies is a slow process and the age of individual mounds can range from 5 215 years (Moore & Picker, 1991) to 30 380 years (Midgley et al., 2002). Mounds form above the nests and thereafter the heuweltjies increase in size, with the concomitant development of a drought-deciduous and halophytic plant community. Once they have passed a certain stage, probably when they are no longer occupied by M. viator (Milton & Dean, 1990), they contract.
The construction of termite mounds results in the mixing of the soil with other materials, e.g. faeces, leaf litter, dry grass and decaying wood, thus changing the chemical and physical properties of the mounds. These changes occur where the accumulation of these materials take place, as well as in the surrounding areas from where these materials are transported (Lee & Wood, 1971; Robert et al., 2007). Due to the redistribution of the soil and other materials in the mounds it is most likely that the subsequent change in texture will be associated with changes in physical properties, like water-holding capacity, infiltration rate, permeability, structural stability and bulk density (Wood & Sand, 1978; Robert et al., 2007). According to Jouquet et al. (2004), who studied the soil structural stability of termite nests (Macrotermes bellicosus), the percentage of clay will increase in the mound soil with a concomitant reduction in sand and coarse silt. This gives rise to an increase in the amount of cations, as well as an increase in cation saturation exhibited in the material of the mounds. The increase in the amount of cations would then also increase the pH in the mound soils (Jouquet et al., 2004).
The difference in chemistry of the soils of the heuweltjie and inter-mound areas is significant, with enrichment in Ca, Mg, K, P, Mn and N (Midgley & Musil, 1990; Moore& Picker, 1991). Similar results of enhanced levels of exchangeable cations, organic C, N, P and pH have been reported from a wide variety of termite mounds (Lee & Wood, 1971; Pomeroy, 1983; Okello-Oloya et al., 1985; Okwakol, 1987; Ekundayo & Aghatise, 1997; Frageria & Baligar, 2005).
According to Lambers et al. (1998), plants that grow more vigorously because of access to more water generally use water more extravagantly and are less water-use efficient. This fast growth leads to higher water stress, as C fixation occurs at the expense of water loss, as stomata have to stay open to take up C. Plants that follow the C3 photosynthesis pathway, e.g. Vitis vinifera, are especially subject to this. In studies by Lovisolo and Schubert (1998), it was found that grapevines grown in wetter conditions tend to have higher stomatal conductance than those under more water-stressed conditions, which also exhibited a higher level of water stress, as was shown by the predawn and midday water potential readings. These results suggest that, while the grapevines on heuweltjies might grow faster due to the potential easier access to water and nutrients, they may also be more water-stressed during the driest part of the season.
Spatial variability in grapevine vigour is quite common in vineyards where heuweltjies occur. It is apparent that differences in micro-site, in particular with regard to soil physical and chemical properties, underlie the spatial variability (Reynolds et al., 2007). Not considering its cause, spatial variability can lead to differences in yield, crop maturity, berry and wine characteristics (Bramley & Hamilton, 2004). These differences are unwelcome when it comes to the management of grapevines and lead to issues concerning the timing and application of certain vineyard management practices, such as irrigation and fertilisation, which are normally standardised over an entire block.
Since heuweltjies cover a large surface area of vineyards in the Western Cape, new possibilities could arise for the South African wine industry in terms of terroir diversity if the planning and management of such vineyards correctly differentiate between grapevines growing on the heuweltjies and those growing off the heuweltjies. However, very little scientific information is available regarding differences in responses associated with grapevines on and off heuweltjies. Quantifying the differences between the heuweltjie areas and those surrounding it, especially regarding wine quality, may assist management decisions on the fate of the grapes produced on heuweltjie areas. Therefore, the interrelationships between heuweltjie characteristics and their impact on the overall vineyard environment must be investigated.
The main aim of this study therefore was to determine the effects of the persistence of heuweltjies in cultivated landscapes in Mediterranean and semi-arid climates on soil characteristics, grapevine vigour and wine quality, and what advantages and disadvantages, if any, heuweltjies lend to wine production.
MATERIALS AND METHODS
Study areas
The study was conducted on wine farms in two grape-growing areas of the Western Cape. The first study area was located on the outskirts of Stellenbosch (34°00'41.87" S, 18°50'45.79" E), and the site was c. 172 m above sea level. The other site was in Robertson (33°47'52.45" S, 19°47'36.13" E), at an altitude of 204 m. The reason for the selection of these two specific areas was the substantial differences in both climate and soil characteristics between Stellenbosch and Robertson. In addition, there was an abundance of distinct heuweltjies on both wine farms. In each study area, four heuweltjies evenly distributed in a vineyard block were selected visually for sampling and experimentation. The study was conducted over the course of 2009 and 2010, primarily during the grapevine growing season. All weather data was obtained from the ARC Institute for Soil, Climate and Water (ISCW) in Pretoria.
The Stellenbosch study area was situated high up on the northern slopes of the Helderberg Mountains, approximately 50 km from Cape Town. Stellenbosch is classified as a relatively high rainfall area (600 to 800 mm p.a.) and receives its rainfall mainly in the winter months, with hot dry summers (i.e. Mediterranean climate). In the summer, average temperatures range from 26.3°C during the day to 15.6°C at night, whereas winter temperatures range from 15°C during the day to 6.6°C at night.
The Robertson Valley is situated on a continental shelf and is influenced by two great mountain ranges, namely the Langeberg to the north and the Riviersonderend to the south. The study area is situated seven kilometres outside of Robertson in the Breede River Valley and is c. 175 km from Cape Town. The valley falls within a low rainfall area (150 to 400 mm p.a.) and can be classified as a semi-arid region. Robertson experiences hot, dry summers and cold winters, with average daytime summer temperatures of 28.1°C and average night time temperature of 14.1°C. The average daytime temperature in winter is 21.1°C, while the average night time temperature is 7.4°C.
Experimental vineyards
Stellenbosch
In Stellenbosch the study was conducted in a Cabernet Sauvignon/101-14 vineyard block. Before the vineyard was established in 2003, soil preparation was done with a delve plough to a depth of 750 mm. Grapevines were established at a planting distance of 1.4 m x 2.6 m and the row direction was north-south. The grapevines were trellised on a four-wire Perold trellising system with movable foliage wires, and with a pole length of 2.4 m above the soil surface. Micro-irrigation was applied using fixed spreaders, at a spreader spacing of 1.9 m and a delivery tempo of 5 mm/hour. A cover crop rotation system was used, consisting of korog (Triticale) and oats (Avena sativa) in alternate rows during 2009, followed by white mustard (Sinapsis alba) in 2010. The trial vineyard was fertilised with post-harvest applications of 100 kg/ha LAN and 70 kg/ha LAN in 2009 and 2010 respectively.
Robertson
In Robertson, four distinct heuweltjies together with their surrounding land were selected in a vineyard planted to Shiraz/110 Richter. Before planting, the soil was deep-ripped down to a depth of 800 mm, followed by cross-ripping in the row direction using a 1.2 m single tine and cutting width of 600 to 750 mm. The vines were then planted at a spacing of 1.2 m x 2.4 m in July 1997. The vines were trellised on the classic four-wire Perold trellising system, with the length of the poles reaching 1.5 m above the soil surface. Drippers were installed for irrigation purposes at one metre spacing and a delivery tempo of 4 L/h. A cover crop was sown every year, but alternated between korog (Triticale) and oats (Avena sativa) on an annual basis.
Soil properties
Morphological properties of soils in the experimental vineyards were described and classified according to the South African Soil Classification System (Soil Classification Working Group, 1991). These descriptions were done in profile pits of 1.2 m depth, dug on the crest and the edge of the heuweltjie, as well as in the adjacent soil surrounding the heuweltjie at each of the four sites in Stellenbosch and Robertson.
Bulk density was determined using the core method (Blake & Hartge, 1986), at 20 cm increments down to a depth of 1.0 m in the same profile pits dug for the soil classification.
Soil samples were taken at five positions on the heuweltjie in the Stellenbosch study area - on the crest of the heuweltjie, on both edges of the heuweltjie and between the crest and the edges on both sides - as well as at two positions surrounding the heuweltjie (Table 1). Because the vineyard block occurred on a slope and nutrients might have leached down-slope over time, it was deemed necessary to take samples at the top of the slope (south side) as well as at the bottom (north side). Samples were taken at five depths: 0 to 20 cm, 20 to 40 cm, 40 to 60 cm, 60 to 80 cm and 80 to 100 cm, using a Thompson auger. Fewer sampling points were chosen in Robertson, since the vineyard block was level and therefore less variation was expected regarding nutrient levels. In this area the soil was sampled at three positions, namely on the crest of the heuweltjie, on its edge and at one position in the adjacent soil surrounding the heuweltjie.
The soil samples taken at the positions described in Table 1 were used for chemical and particle size analysis. Chemical analyses included pH in water and KCl (White, 1997), electrical conductivity of the saturated paste (Page et al., 1982), extractable cations using the ammonium acetate method (The Non-affiliated Soil Analysis Work Committee, 1990) and total C and N by dry combustion using a Eurovector CNH analyzer (Eurovector, Milan, Italy). The P content of the soil was determined by using the Bray 2 method (The Non-affiliated Soil Analysis Work Committee, 1990). Textural analyses were only done on soils occurring on and off the heuweltjies at two sites in each study area. The sand fractions (2.0 to 0.05 mm) were separated by sieving, according to the method described by Gee and Bauder (1986), while the silt-clay fractions (<0.05 mm) were determined using the pipette method (Gee & Bauder, 1986).
At both sites, soil water content was measured every month using a CPN neutron water probe. In Stellenbosch, readings were carried out over a depth of 1.0 m in increments of 150 mm in PVC access tubes that were installed at four positions on each heuweltjie and two positions in the adjacent soil surrounding the heuweltjies. Evapotranspiration (ET) was calculated according to the water balance equation (Hillel, 1980), as follows:
ET = P+I - ΔS
where ET = evapotranspiration, P = precipitation, I = irrigation and AS = change in soil water content.
Physiological response
Four vines on each heuweltjie and four vines off the heuweltjie (amounting to 16 vines on the heuweltjie and 16 off the heuweltjie in each study area) were selected for measuring physiological responses. Measurements began in December 2009, with the last measurement taking place in April 2010. On each vine, a healthy mature leaf situated in the bunch zone was chosen for measurement. Stomatal conductance was measured on the basal side of each leaf in mmol/m2/s using a leaf porometer (Model SC-1) (Decagon Devices, Pullman, Washington). Leaf stem water potential was measured in healthy, fresh leaves with a pressure chamber (Pockman & Sperry, 2000) from December to March, when the vines were subjected to water stress. Predawn (04:00 to 05:00) and midday (12:00 to 14:00) readings were taken to obtain the maximum and minimum leaf water potentials to indicate the amount of water stress endured by the vines.
Vegetative growth
Canopy density was derived from photosynthetic active radiation readings using a ceptometer. The ceptometer was placed in the canopy and parallel with the bunch zone to indicate possible differences in light penetration, which in turn influences the rate of maturity, berry colouration and berry composition. Four vines were selected on and off the heuweltjie at all four sites to carry out measurements.
The trunk circumference of six vines growing on each of the four heuweltjies and six vines growing on the adjacent soil surrounding the heuweltjies was measured to determine differences in vigour. Measurements of the trunk using a measuring tape were taken 100 mm above the graft union between the rootstock and scion on all four sites on and off the heuweltjie, both in Stellenbosch and Robertson.
In winter, twelve vines were pruned in each study area, both on and off the heuweltije, and the pruning mass of each vine was weighed separately. Grapevines were pruned according to the traditional short bearer system used in commercial wine farming in South Africa. The majority of the lateral and water shoots had already been removed because pruning had commenced in Robertson, and their mass consequently could not be measured.
Grape composition and wine quality
For grape analyses, approximately 50 berries were picked by hand (c. one month before harvest) at each site in both Stellenbosch and Robertson to measure juice total soluble solids (TSS), total titratable acidity (TTA) and pH. The
grapes were selected randomly from bunches on and off the heuweltjie. Care was taken to sample berries from all parts of the bunch, i.e. front, back, top and bottom. Once the grape berries had been picked, they were analysed on the same day to prevent any changes in TSS and TTA. The grapes were crushed and the sugar concentration was measured in °B using a refractometer. Fifty mL of juice from each site was then pipetted into a glass beaker and used for the determination of TTA and pH. This was done through titration with NaOH using a Metrohm 785 DMP Titrino (Metrohm, South Africa).
Experimental wines were made on a small scale from bunches that were harvested on and off the heuweltjies. The grapes were randomly harvested by hand and the wines were made according to the standard method of the Department of Viticulture and Oenology at Stellenbosch University. Four replicate wines were made from each site, namely on-heuweltjie and off-heuweltjie in Stellenbosch. In Robertson, wines were made from the grapes of only three sites due to financial limitations. After the wine was bottled, it was chemically analysed with a Winescan (Foss, Hillerod, Denmark), after which it was sent to the Department of Food Science at the university for sensory analyses. A descriptive analysis was carried out to indicate differences in the recognised organoleptic profiles between the wines emanating from heuweltjie and non-heuweltjie plots. The analysis entailed tasting the wine, as well as objective categorisation of the wine according to taste and aroma by a panel of ten trained tasters. The panel used a 100 mm unstructured line scale to analyse the wines for the respective sensory attributes (Table 2). Four replicates each of the following eight Cabernet Sauvignon wines from Stellenbosch and six Shiraz wines from Robertson were tasted for a spectrum of sensory attributes:
• Stellenbosch: Sample H1C = On 1, Sample H1O = Off 1, Sample H2C = On 2, Sample H2O = Off 2, Sample H3C = On 3, Sample H3O = Off 3, Sample H4C = On 4, Sample H4O = Off 4.
• Robertson: Sample H1C = On 1, Sample H1O = Off 1, Sample H2C = On 2, Sample H2O = Off 2, Sample H3C = On 3, Sample H3O = Off 3.
The wine samples were presented to the judges in a completely randomised order for tasting. The sample size was 40 mL and the treatments were served at room temperature (21°C) in ISO wine-tasting glasses covered with plastic lids to concentrate the aroma in the headspace. The data was sourced on Compusense (Compusense, Canada). All tastings were conducted in a light- and temperature-controlled room (21°C).
Statistical analyses
In order to avoid pseudo-replication (for soil water content, stomatal conductance, water potentials and canopy density/ light readings), data points for each sampled leaf or individual measurement were combined to arrive at a mean for each heuweltjie and non-heuweltjie plot. These means were then used for the statistical analyses. Physiology results obtained were statistically analysed using factorial analysis of variance (ANOVAs), followed by Fisher's LSD post hoc test (Statistica 9.0, Tulsa, OK), while growth, berry characteristics and wine chemical attributes were analysed through the use of descriptive statistics and paired t-tests (Microsoft Excel, 2007). For the berry and wine chemical analyses, berries from individual grapevines on the heuweltjie were combined before analysis, and the same procedure was followed for the non-heuweltjie area. Berries for the wine chemical and sensory analyses were treated in the same way. Least significant difference (LSD) values were calculated to facilitate comparison between treatment means. Means that differed at p < 0.05 were considered to be significantly different.
For the descriptive sensory analysis of the wine, a randomised complete block design was used, with eight treatments and four replications for the Cabernet Sauvignon, and six treatments and four replications for Shiraz. All data were subjected to test-retest analyses of variance (ANOVA) using SAS® software (Version 9; SAS® Institute Inc., Cary, USA) to test for reliability, i.e. temporal stability (Judge*Replication interaction) and internal consistency (Judge*Level interaction) (SAS®, 2002). The Shapiro-Wilk test was used to test for non-normality (Shapiro & Wilk, 1965). If non-normality was significant (P < 0.05) and caused by skewness, the outliers were identified and removed until the data were normal or symmetrically distributed (Glass et al., 1972). Using SAS® line plots indicating temporal stability and internal consistency, single odd judges were identified and removed. PanelCheck software (Version 1.3.1, Nofima, Norway) was used to substantiate the latter results, therefore testing for panel reliability. The final ANOVA was performed after the above-mentioned procedures had taken place, after which the least significant difference (LSD) was calculated at the 5% significance level to compare treatment means.
Discriminant analysis (DA) and principal component analysis (PCA) were performed on the responses for the different judges of the different treatments. Multivariate data analyses were performed using XLStat software (Version 2009.5.0.1, Addinsoft, SARL, Paris, France). The DA was performed to classify the wines produced from the heuweltjie and non-heuweltjie plots according to sensory attributes. Similarly, the PCA was performed to determine the association between the sensory attributes of the wines produced from the respective heuweltjie and non-heuweltjie plots. These attributes were then correlated with specific chemical characteristics.
RESULTS AND DISCUSSION
Morphological soil properties
In Stellenbosch, two soil forms (Acrisols according to the International Soil Classification System (World Reference Base for Soil Resources, 2014)) occurred in the trial vineyard. The crests of the heuweltjies were all classified (soil form and family) as Oakleaf buchuberg, while the surrounding soil had the same general attributes and was classified as Tukulu olivedale. In contrast to the Oakleaf, which showed no signs of wetness, the subsoil of the surrounding Tukulu soil exhibited grey mottles, indicating periodic wetness. There was a visible change in clay content and texture from the A horizon to the B horizon on the crest of heuweltjies. This clay accumulation in the B horizon was probably caused by bioturbation, where termites bring clay into their nests and mix it with faeces to engineer tunnels and galleries. At this stage, however, termites were no longer active in the soil due to the disturbance of ploughing and other cultivation practices.
There was more soil variation in Robertson than in Stellenbosch. Three of the four heuweltjie crests in Robertson were classified as belonging to the Augrabies hefnaar soil form and family, while the fourth was a prominent Brandvlei kolke (form and family). All four soils had a high concentration of CaCO3, and lime concretions were present (Calcisols according to the International Soil Classification System (World Reference Base for Soil Resources, 2014)). Much of the calcrete hardpans had been destroyed by deep ploughing, but remnants were still visible. The low rainfall contributed to the low degree of leaching, and the accumulation of free lime and the formation of carbonate-rich horizons. Four different soil forms and families could be distinguished in the soil surrounding the heuweltjies, namely Oakleaf buchuberg and Valsrivier zuney (Luvisols), Oudtshoorn dysselsdorp (Durisol) and Augrabies spoegrivier (Calcicol according to the International Soil Classification System (World Reference Base for Resources, 2014)). No carbonates were present in the off-heuweltjie soils, which fits the termite model, i.e. formation of carbonates is induced by termite activity in these soils.
The B horizons of heuweltjie soils were considerably thicker than their off-heuweltjie counterparts, especially in Robertson. These differences are well indicated by the transitional depthbetween the B and C horizons. In Robertson, the transition occurred on average at 730 mm and 450 mm on the heuweltjie and off-heuweltjie sites respectively. In Stellenbosch, the transitional depths were the same in one replication, but at the other three replications the transition occurred on average at 783 mm in contrast to 550 mm in the heuweltjie and non-heuweltjie soil respectively. The importance of soil depth in respect of rooting, water and nutrient availability, as well as other factors, is well known and probably one of the causal reasons for the better plant performance on heuweltjies under natural conditions.
Chemical soil properties pH
The pH(KCl) of the heuweltjie plots in Stellenbosch was fractionally higher than in the corresponding non-heuweltjie plots; however, due to the high degree of leaching of basic cations under high rainfall conditions, the differences between all the sampling positions and at all depths were insignificant (data not shown). In Robertson, heuweltjie plots had a significantly higher pH(KCl) than non-heuweltjie plots overall (data not shown). When specific depths were compared, significantly higher pH values were observed between the HC and HO, as well as between the HO and HE plots at the 60 to 80 cm and 80 to 100 cm depths (data not shown). The Robertson finding supports the results of Ellis (2004), who showed in a large study covering the arid and semi-arid regions of the South Western parts of South Africa that pH(H2O) followed the sequence heuweltjie crest > heuweltjie edge > off-heuweltjie.
Electrical conductivity (ECe)
The ECe values in Stellenbosch were generally low, ranging from 51.8 mS/m to 96.48 mS/m. Slightly higher values from the HO and HE plots in comparison to the HC plots could be ascribed to the concave shape of the heuweltjies, as Na, which makes up the greatest percentage of the salt concentration that influences the ECe value, is very mobile and tends to move to the edges of the heuweltjie as well as to its adjacent soil (F. Ellis, personal communication, 2010). However, differences between the HC, HE and HO plots were very small and insignificant in Stellenbosch.
In Robertson, the ECe varied considerably between the HC and HO plots, as well as between the HO and HE plots at all depths, with values ranging from 99.5 mS/m to 679 mS/m. On average, ECe displayed the highest values in the topsoil, after which it decreased down to 60 cm, only to increase again deeper down to 100 cm. This trend occurred on all plots. Statistically, significantly higher values (averaged over depth) were observed on the HO (546 mS/m) plots than on both the HC (318 mS/m) and HE (200 mS/m) plots (p < 0.05), but differences between the latter two were insignificant. Comparing the ECe of the three sites according to the classification of Saayman (1981), differences in grapevine response are to be expected, namely:
HE = 200 mS/m (no salt effect)
HC = 318 mS/m (symptoms of salt damage)
HO = 546 mS/m (serious salt damage)
Contrary to expectation, the vineyard performed excellently, even in the off-heuweltjie areas, a fact that can probably be ascribed to the use of high-frequency drip irrigation.
Extractable cations
It was apparent that the chemistry of the soils in Stellenbosch, both on and off the heuweltjie, is dominated by Ca. Even while Ca does not occur in high concentrations, it still eclipsed the next highest value, which is Mg, by an average of 55%. The average Ca value over all depths for the different treatment plots was as follows: HC = 5.16 cmol/kg; HOn = 3.44 cmol/kg; HOs = 4.53 cmol/kg; HEn = 3.74 cmol/ kg; HEs = 3.99 cmol/kg. The overall conclusion was that Ca was present in higher concentrations in the heuweltjie soils compared to non-heuweltjie soils. Heuweltjie plots also exhibited significantly higher Mg concentrations than non-heuweltjie soils, although the values were extremely low overall (0.69 to 1.27 cmol/kg). Sodium concentration did not differ between sites, but K was significantly higher in non-heuweltjie than in heuweltjie soils at two depths only, viz. at 40 to 60 cm and at 60 to 80 cm.
In Robertson, the heuweltjie plots showed a slight increase in exchangeable cation values compared to the non-heuweltjie plots in the surrounding soils, except in the case of Na. The Ca value of the HC plots averaged approximately 2 cmol/kg higher than the corresponding values on the HE plots, which in turn averaged 4 cmol/kg more than the HO plots. The average Ca value for the HC plots over all depths was 12.22 cmol/kg, HO was 8.38 cmol/kg and HE 10.34 cmol/kg. Significant differences in the Ca content occurred in the 40 to 60 cm and 80 to 100 cm samples between the HC(+) and HO(-) plots, with (+) being the superior variable and (-) the inferior variable.
For Mg, the HE plots displayed the highest values, followed by HC and HO. The average Mg value over all depths for the HC plots was 1.52 cmol/kg; for HO it was 1.20 cmol/kg and for HE 2.08 cmol/kg. For Mg, significant differences were observed in the 40 to 60 cm sample between HC(+) and HO(-), and in the 80 to 100 cm sample between HC(-) and HE(+), as well as at the same depth between HO(-) and HE(+). The K content of heuweltjie and non-heuweltjie plots displayed insignificant differences at all depths.
The Na values exhibited a different trend to the other cations, with HO plots displaying the highest values, followed by HE and HC. The average Na value over all depths for the HC plots was 0.62 cmol/kg; for the HO it was 0.87 cmol/ kg and for HE 0.69 cmol/kg. Only one significant difference was observed in the Na content between the heuweltjie and non-heuweltjie plots, namely in the 80 to 100 cm sample between HC(-) and HO(+).
Extractable phosphorous
At both locations, extractable P did not differ significantly between heuweltjie and non-heuweltjie soil at any of the depths, although P concentrations averaged over depth tended to be highest on the Edge plots (73 mg/kg) compared to Crest (47 mg/kg) and Off (44 mg/kg) plots in Robertson. In Stellenbosch the average P value over all depths for the HC plots was 10 mg/kg, HOn = 19 mg/kg, HOs = 12 mg/kg, HEn = 10 and HOs = 11 mg/kg.
Total carbon and nitrogen
A higher overall C and N percentage was observed in the top 20 cm of all the plots and can be ascribed to the accumulation and decomposition of plant litter and detritus on the soil surface. The results also showed that C and N percentages declined with an increase in depth. In Stellenbosch the average total C percentage over all depths for the HC plots was 1.22%; HOn = 0.92%; HOs = 0.98%; HEn = 0.93% and HEs = 0.98%, while the average total N percentage over all depths for HC plots was 0.09%; HOn = 0.07%; HOs = 0.06%; Hen = 0.05% and HEs = 0.09%. The total C and N percentages of the Crest plots were significantly higher when compared to the values of the Edge and Off plots at the same depths. Differences in the C and N values between the Edge and Off plots were negligible. Significant differences between heuweltjie and non-heuweltjie total C contents were found in the 0 to 20 cm sample between HC and HO, and in the 80 to 100 cm between HC and HO, as well as between HC and HE. Differences in total N content proved insignificant at all depths.
The results obtained in the Stellenbosch study area concurred well with the findings of Shange et al. (2006), who also reported significantly higher values of total C percentage on the heuweltjie compared to in the adjacent soils. This is due to the foraging habits of the harvester termite, which feeds on leaves, twigs and general plant litter. Termites excrete this material, and their faeces, along with the decomposed plant litter, have a combined effect of increasing the total C and N percentage. The darker colour of the soils observed on the heuweltjie is also further evidence of a higher percentage of organic material and supports results obtained in the current study.
In Robertson the total C and N percentages followed the same trend as in Stellenbosch, i.e. a decrease with depth, while total C also decreased, as follows: HC > HE > HO. Differences between heuweltjie and non-heuweltjie total C and N contents were insignificant at all depths.
Soil physical properties
Texture
The clay percentages of the Stellenbosch soils on the heuweltjies were significantly higher than those of the adjacent surrounding soils (Table 3). This result can be attributed partly to the fact that the termites selectively transport clay particles from other horizons into their nests and combine it with faecal material to build their tunnels and gallery walls (López-Hernández, 2001). Evidence of the natural soil-forming process of clay illuviation is absent in the soil of the heuweltjies, due to bioturbation caused by the termites.
When the heuweltjie soils are compared to the surrounding soil, differences in the distribution of sand particles throughout the soil profile are trivial. Speculation that there might have been a fair degree of mixing of the sand fractions due to termite activity led to graphs of cumulative sand percentage against depth being drawn up to indicate the extent to which such mixing of the sand had taken place. Fig. 1(A) indicates a very small variation in the distribution in comparison to almost no sand mixing that is indicated in Fig. 1(B). This small, yet vital, difference can be attributed to bioturbation from termite activity that takes place in the heuweltjie soils and is especially noticeable in the 0 to 20 cm soil layer.
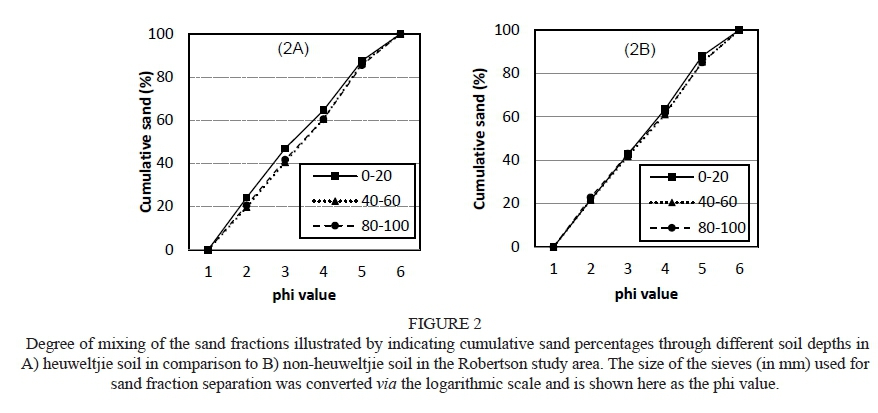
The soils of the Robertson study area were much lower in clay content than those of Stellenbosch due to the difference in parent material from which the soils are derived (data not shown). In contrast to Stellenbosch, the clay content in the heuweltjie soil (% clay in the B-horizon) was significantly lower at all depths than in the non-heuweltjie soils (% clay in the B-horizon). From an examination of Figs 2A and 2B it is clear that a significant difference occurs in the sand particle distribution of the heuweltjie soils in comparison to the adjacent, surrounding soils and it is fair to say that a higher degree of mixing occurred in the sand fraction of the heuweltjie soils than of the non-heuweltjie soils.
It can be concluded that termites play an intricate part in altering the soil texture at specific depths through their foraging and burrowing activities. Due to the extensive cultivation and soil tillage, much of these alterations have been nullified. However, differences in the distribution of different textural classes between heuweltjie and non-heuweltjie soils do occur and, while these are small, they are relatively significant and pave the way for further alterations in the soil physical properties.
Bulk density
In both the Stellenbosch and Robertson study areas, no differences in bulk density were measured between heuweltjie and non-heuweltjie plots at any depth. On average, bulk densities were 1.55 g/cm3 and 1.54 g/cm3 on heuweltjies and off heuweltjies respectively in Stellenbosch, while the corresponding values in Robertson were 1.44 g/ cm3 and 1.49 g/cm3. Similar values obtained on and off heuweltjies are probably due to the influence of humans, through deep ploughing and soil tillage practised in the vineyard blocks where the experimentation took place. These results were rather unexpected, since past studies have shown that termites form macro-pores, loosen the soil and change the soil structure by burrowing (Mando, 1997). This reduces bulk density while at the same time increasing soil porosity. The higher soil organic matter levels originating from termite activity can also have a significant effect on modifying the bulk density. Organic matter tends to reduce bulk density (Arvidsson, 1998; Chan, 2002; Rivenshield & Bassuk, 2007).
Soil water content (SWC)
The average total SWC of heuweltjie soils ranged from 61.8 mm in February to 174.9 mm in May, while non-heuweltjie soils exhibited values that ranged from 55.8 mm in February to 165 mm in May (Table 4). When compared statistically, a significant difference was noted between the heuweltjies and non-heuweltjies regarding SWC in November and December. Deeper soil on the heuweltjies also contributed to more available water in those landscape positions than elsewhere. Differences in SWC seemed to become less prominent as the season progressed and rainfall increased in autumn. The early, more favourable SWC on heuweltjies, however, coincides with the period of fast grapevine shoot growth and is the major reason for more vigour at those sites compared to the surrounding area. The ET values are also indicative of the advantage of the heuweltjies over the non-heuweltjies in terms of SWC in the Stellenbosch study area. On the heuweltjies, average ET values ranged from 2.1 mm/day in December to 0.4 mm/day in April. In comparison, the ET values on the non-heuweltjie plots ranged from 1.7 mm/day in December to 0.6 mm/day in April. The average ET per day was higher on the heuweltjie than the non-heuweltjie areas until April, after which heavy winter rains started and the grapevines went into their dormant phase.
The higher soil water content on the heuweltjies can probably be attributed to clay transported into the nests by termites that gave rise to a higher total porosity and a larger water-holding capacity. Therefore, it can be concluded that grapevines growing on heuweltjies in the Stellenbosch area will be less prone to stress induced by water deficiencies than the vines associated with non-heuweltjies. These higher soil water contents could significantly mitigate the effects of climate change and global warming on the plant in terms of a higher availability of soil water, and heuweltjies could thus provide specific, yet very beneficial, heterogeneity to cultivated landscapes.
Opposite trends were observed when the heuweltjie and non-heuweltjie soil water contents of the Robertson study area were compared to those of Stellenbosch over the course of the seven trial months. The average SWC of the heuweltjie soils in the Robertson study area ranged from 51.0 mm in November to 60.8 mm in May, while it ranged from 64.3 mm in February to 73.2 mm in April in the non-heuweltjie soil, thus clearly depicting a lower soil water content on the heuweltjies compared to non-heuweltjie plots (Table 4). There were no differences in SWC between the heuweltjie and non-heuweltjie plots in November, January and March at depths of 80 to 100 cm, with the non-heuweltjie plots displaying higher values. In November, the non-heuweltjie plots at a depth of 50 to 80 cm also exhibited significantly higher soil water content than the heuweltjie plots. No difference could be discerned between the ET values of the heuweltjie -and non-heuweltjie plots from November to May.
As previously stated, SWC has a significant effect on the growth and physiology of grapevines; however, with the results from Robertson being opposite to those from Stellenbosch, the hypothesis was stated that growth would be less vigorous on the heuweltjies than in the surrounding soils and that growth stages would be advanced due to lower water contents.
Stomatal conductance and leaf water potential
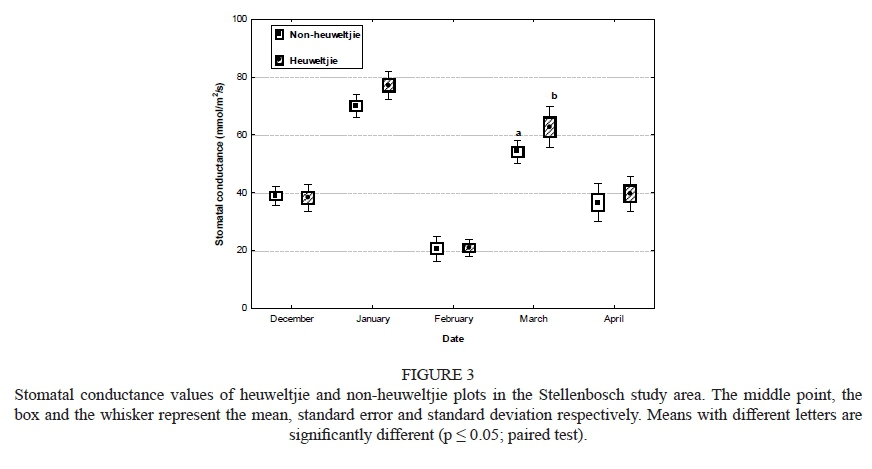
In Stellenbosch, grapevines growing on the heuweltjies had higher stomatal conductance than those on the non-heuweltjie plots in January and March (Fig. 3). No differences were observed for December, February and April. Stomatal conductance in February was very low, probably due to the amount of cloud cover on the day of measurement. Overall, the stomatal conductance for grapevines growing on the heuweltjies was always higher than that of non-heuweltjie vines, which supports the canopy density results. This trend means that the stomata are more open and active on the heuweltjie, an indication that water may be more available in the termite-affected soil.
In Robertson, the stomatal conductance was slightly lower than that recorded for Stellenbosch, but no significant differences were found between heuweltjie and non-heuweltjie plots (data not shown). The Robertson region is significantly drier than Stellenbosch, and irrigation therefore is more important. Throughout the study period, the Robertson plots were irrigated much more frequently. This may be the reason why there were minimal differences in stomatal conductance on and off heuweltjies in this study area. The untimely occurrence of a hail storm hampered further measurements in March and April.
No significant differences were found in predawn or midday leaf water potential between heuweltjie and non-heuweltjie plots in either of the two study areas (data not shown). Generally, lower water potentials were found in Stellenbosch. While predawn water potential was relatively low in Robertson in December, this situation changed considerably in January and February, when the level of stress experienced by the grapevines was apparently very low (the Ψ values were between 0 and -100 kPa in max January and February). Similar to stomatal conductance, irrigation, which was applied much more frequently in Robertson, strongly affected the level of stress experienced by the plant. In Stellenbosch, the more mesic wine-growing area, irrigation was used much less, and Ψ values were max concomitantly lower.
Midday leaf water potentials integrate the water stress produced by the combination of weather conditions, SWC and other soil characteristics, as well as management practices such as irrigation. In Robertson, with progressive aridity later in the season, Ψmin. values were lower than in Stellenbosch, despite more frequent irrigation. This is an indication that these grapevines were experiencing stress during the day, when stomatal conductance was high and the plant was transpiring at its maximum. However, due to frequent irrigation, the grapevines were able to recover during the night and utilise the residual soil water, which may explain the high values.
Canopy density
In the Stellenbosch study area, a very clear pattern was discerned upon observation of the canopy light measurements at different stages during the season. According to the ceptometer values (Table 5), the vegetative growth on the heuweltjie experienced a lag phase in the early summer. After this initial delay, the vegetative growth of the vines on the heuweltjie increased considerably, surpassing the growth of the non-heuweltjie vines. Canopy light readings were similar in December and January, with higher canopy light readings obtained on the heuweltjie plots when compared to non-heuweltjie plots during the rest of the season. There also were no differences in average light radiation and percentage light radiation reaching the bunch zone in December and January, and the first significant differences emerged only in February. Lower average light radiation and a higher percentage of light radiation reaching the bunch zone of the heuweltjie plots continued from February until April.
Photographs (not shown) suggested that the initial lag phase in vegetative growth could be ascribed to a significant delay in the time of bud burst on the heuweltjie soils. At the start of the growing season, soil temperature is the main soil factor that influences bud burst and growth. Due to their higher water content, the heuweltjie soils will have a slightly lower temperature compared to that of the surrounding soils and therefore bud burst will be delayed. As the growing season progresses, water is gradually withdrawn from the soil through absorption by the vine's root system, evaporation and desiccation, and therefore becomes the limiting property that replaces soil temperature as the main factor influencing vine growth. Since the heuweltjie contains more water for a longer period of time than the surrounding soils, the growth of the vine tends to be more vigorous on the heuweltjies than on the adjacent surrounding soils. Similar results were also reported by Shange et al. (2006) for grapevines growing in the Stellenbosch region.
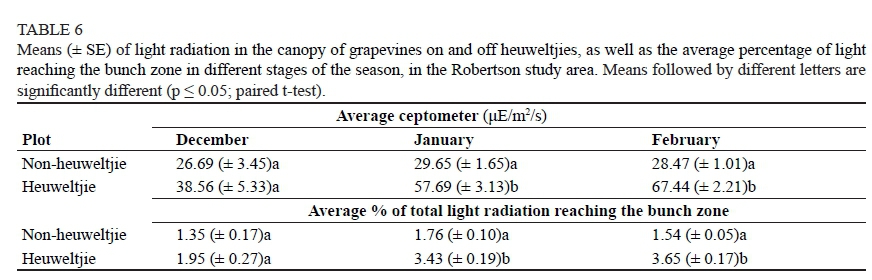
In the Robertson study area, however, the trends observed in canopy light interception were opposite to those in Stellenbosch. Heuweltjie plots exhibited higher absolute canopy light readings in January and February. The total light radiation reaching the bunch zone reflected a pattern similar to that of the absolute canopy light readings (Table 6). It seemed that, as the growing season progressed, a greater difference emerged between heuweltjie and non-heuweltjie plots due to sparser shoot and leaf biomass on the heuweltjies. The damage caused by the unforeseen hail storm on 2010-02-24 in the Robertson study area meant that canopy light measurements ground to a halt before the bulk of the data was collected.
Trunk circumference
Grapevines associated with the heuweltjies in Stellenbosch exhibited significantly larger trunk circumference values than the non-heuweltjie ones (data not shown). The average trunk circumference was 17.1 cm on the heuweltjie compared to 15.6 cm on the non-heuweltjie vines. Trends obtained in the Robertson study were similar to those of Stellenbosch.
The average value on the heuweltjies was 16.7 cm compared to the 14.8 cm on the non-heuweltjie plots. The higher trunk circumference values of the vines associated with the heuweltjies supports the conclusion of Ellis (2004) that the soil is more fertile on heuweltjies. This ensures that a more suitable environment is created for vigorous growth. If the grapevine has free access to all its needs in terms of nutrients and water, higher vigour will be the result, and both sets of heuweltjies showed this potential in their higher trunk circumference, which was the result of long-term trends in growth. However, in the short to medium term, the more limited soil water availability and possibly the more stressful growing conditions on the heuweltjies in Robertson gave rise to less vigorous growth in terms of shoots and leaves.
Pruning mass
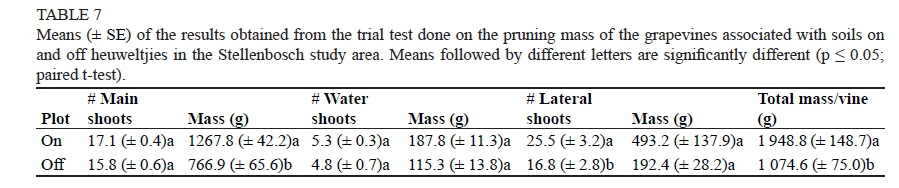
There were major differences in the vigour of the grapevines growing on and off heuweltjies (Table 7). Main shoots, water shoots as well as lateral shoots seemed to benefit from the altered soil characteristics found on the heuweltjies in terms of quantity as well as mass, although significant differences only emerged when comparing the number of lateral shoots, main shoot mass and the total pruning mass per vine. The differences in shoot quantity between heuweltjie and non-heuweltjie plots were most substantial in the laterals, with the heuweltjie vines comprising almost nine shoots more per vine than the corresponding non-heuweltjie vines, thus creating a denser canopy. Due to the faster growth and the increased length of the main shoots on the heuweltjies, the tipping of shoots was started earlier, which caused the stimulation of lateral shoot growth. This is the reason for the higher number as well as longer length of lateral shoots on the heuweltjie vines in comparison to the non-heuweltjie vines. The higher number of lateral shoots inevitably led to a higher lateral shoot mass per vine. Heuweltjie vines also contained on average 1.25 times more main shoots per vine than non-heuweltjie vines, with the mass of the total main shoots per vine on average being almost 500 g higher.
In Robertson, the heuweltjie vines tended to have less growth of their main shoots than the corresponding non-heuweltjie ones (Table 8). However, the differences were not significant. Total vegetative growth in terms of pruning mass could not be determined, however, since the water shoots and lateral shoots were removed before the final pruning and weighing took place.
Berry analyses
In the Stellenbosch study area, the sugar concentration of berries produced on the heuweltjies tended, on average, to be c. one °B lower in comparison to grapes from the adjacent soil. In addition, TTA was significantly higher on the heuweltjies (Fig. 4), indicating a slower maturation of the grape bunches from the heuweltjies. Grapevines associated with the heuweltjies exhibited a more luxurious growth in Stellenbosch, and consequently véraison and ripening were delayed due to excessive shading within the canopy. This caused a significant decrease in the sugar content, particularly with regard to fructose, with a concomitant increase in acidity, more specifically malic acid.
Differences in berry composition between heuweltjie and non-heuweltjie plots in the Robertson study area were insignificant (data not shown). The only noticeable trend that could be discerned was in juice pH, glycerol and fructose. Higher pH values and fructose concentrations were found in the heuweltjie berries, while the glycerol concentration tended to be lower in comparison with non-heuweltjie berries.
Wine
Wine chemical analysis
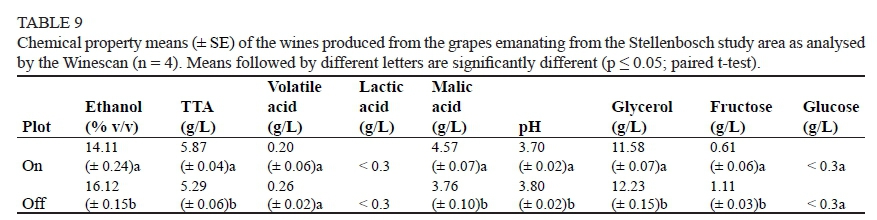
In the Stellenbosch area, heuweltjie wines had reduced fructose levels and increased TTA and malic acid concentration when compared with non-heuweltjie wines (Table 9). The alcohol percentage was also significantly lower for the wines emanating from the heuweltjie plots when compared to non-heuweltjie plots, with an average ethanol content of 14.11% and 16.11% and an average glycerol content of 11.58 g/L and 12.22 g/L respectively. All results specified here differed significantly between heuweltjie and non-heuweltjie plots. The foregoing wine analysis results were probably caused by more luxurious grapevine growth on the heuweltjies in Stellenbosch, which delayed véraison and ripening due to increased shading within the canopy. This clearly supports the research on shading of bunches conducted by Smart (1982), who found a decrease in sugar, anthocyanin and phenol levels and an increase in titratable and malic acid contents, but a decrease in tartaric acid contents. He also found a higher pH and K content associated with wines made from shaded canopies. No significant differences could be discerned in the volatile acid, lactic acid and glucose contents between the heuweltjie and non-heuweltjie wines (Table 9).
Contrary to expectations, differences in wine chemical characteristics between heuweltjie and non-heuweltjie plots in the Robertson study area were insignificant (data not shown).
Wine sensory analysis
In terms of specific chemical and sensory attributes, the heuweltjie plots in Stellenbosch were completely at one end of the spectrum, while the non-heuweltjie plots were on the opposite side (Fig. 5). The different heuweltjie wines displayed very similar sensory attributes and were mostly characterised by their high concentration of malic and TTA (as also shown in the wine chemical results). On2 and On3 exhibited small hints of sweet and vegetative characters, while On1 and On4 exhibited a more berry-fruity, sour, bitter and astringent character. No specific sensory attribute was highlighted in the heuweltjie wines and it was considered "more mild and bland" than the non-heuweltjie wines. Much less variation was detected within the latter wines, except in the case of Off4. Plots Off1, Off2 and Off3 all seemed to exhibit the same sensory attributes, such as vegetative, sweet-associated and alcohol burn. Off4 was significantly different compared to the other Off plots and displayed a more astringent, bitter, sour and berry-fruity character. The main difference between the heuweltjie and non-heuweltjie plots was that all of the sensory attributes were significantly heightened in the Off plots. The On plots showed far less distinctiveness in terms of sensory attributes, and wines with less complexity were the result.
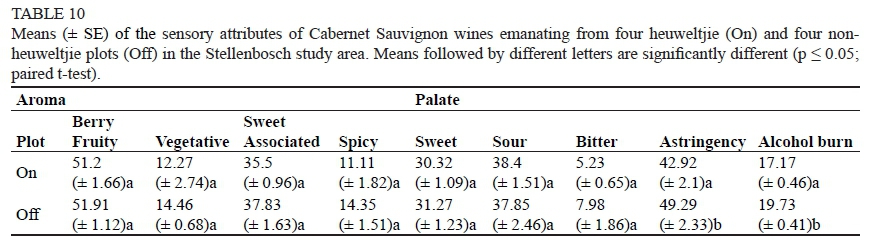
The only significant difference between the heuweltjie and non-heuweltjie wines of Stellenbosch was found in the astringency and the alcohol burn, being higher in the non-heuweltjie wines (Table 10).
A very interesting, yet significant, relationship could be discerned between the wine quality and the growth of the associated vines. These growth characteristics of the grapevines were undoubtedly a factor influencing wine chemical attributes such as malic acid and TTA (Fig. 6), thus also establishing it as a causal factor in the occurrence of certain specific sensory attributes. This can also have a significant impact on sensory attributes such as general fruitiness and vegetative character. Attributes such as the vegetative character found in wines are normally associated with a more vigorously growing vine (Marais et al., 1999; Scheiner et al., 2012) although this relationship was not supported by the aroma data in Table 10. Differentiation in vineyard growth tends to induce major microclimate diversity, even within the boundaries of a vineyard block, thus differences in wine quality are bound to occur.
According to the PCA bi-plot on the sensory attributes (Fig. 5) of the wine produced from On3, it had a fruity flavour, a reasonably sweet taste and was relatively low in acidity. It is also clear that On3 wine was very high in volatile acids (a negative attribute for wine), which could have been the cause of the different wine sensory attributes when compared to On1 and On2.
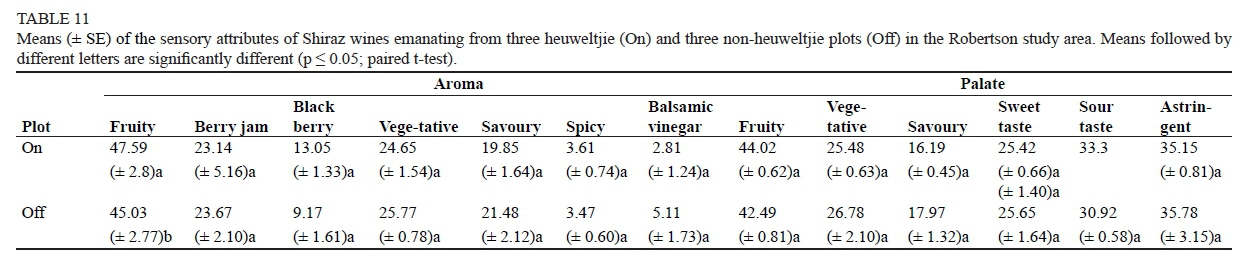
The wine produced from site Off2 was dissimilar to that of the other Off-plots (Fig. 7). It can be deduced, by examining Fig. 7 and Table 11, that the wine produced from location Off2 had a strong savoury flavour, an aroma that was savoury-like and slightly vinegary, as well as a reasonably high degree of astringency. The wine produced from Off2 had the highest pH, percentage ethanol and fructose content. The only significant difference between the heuweltjie and non-heuweltjie wines of Robertson was found in the fruitiness, being higher in the non-heuweltjie wines.
The results from the wine sensorial evaluations indicate that there was a substantial variation in chemical properties of wines from the heuweltjie and non-heuweltjie plots, although only in the high-rainfall area. Although inconclusive in some cases, alcohol, sugar and acid percentages were all affected by the presence of heuweltjies in vineyards. The results obtained in the Stellenbosch study area display the most substantial variation in the abovementioned attributes, which raises further questions concerning the possible role that climate, and more specifically rainfall, could play as a collaborator in such a scenario.
CONCLUSIONS
Substantial differences in vigour between grapevines on and off heuweltjies in the same vineyard could be attributed to different soil forms, each with its own properties. The effect of soil properties also extended further, to soil-plant water relations, grape and wine biochemical composition, as well as wine sensory attributes. It was also evident that the response of grapevines to heuweltjies was more prominent in Stellenbosch, a higher rainfall region, than in the semiarid Robertson area. Although the soil chemical properties were generally marginally more beneficial on heuweltjies compared to the surrounding vineyard, soil water availability seems to be the determining factor, even though the trial vineyards received irrigation.
The significant differences in water content between the heuweltjie and non-heuweltjie soil immediately bring to mind the question of whether irrigation could be adapted to provide in the different water demands of the two soil forms. Although different irrigation frequencies would be ideal, the shape, size and irregular pattern of heuweltjie incidence make different irrigation frequencies impractical. The second possible adaptation to accommodate heuweltjies that springs to mind is the use precision agriculture to apply fertilisers separately. Different vineyard management practices could also be implemented on the heuweltjies to accommodate excessively vigorous growth, thus ensuring a more open canopy. Dense canopies create their own microclimate, which can be favourable or deleterious to grape quality, but management strategies need to be modified to accommodate such variation. The tendency of vigorous grapevines to produce large shoots with long internodes and big leaves, as well as a high number of lateral shoots, will severely alter the planning of specific management practices such as shoot repositioning, shoot thinning, tipping, topping and leaf removal. Pruning is one adaptation that can easily be implemented as a response to differences in vigour between grapevines on and off heuweltjies.
Heuweltjies introduce a unique characteristic to many South African vineyards, namely distinct demarcated soil and grape variation that can produce different wines within the same vineyard. Due to the extensive variation between heuweltjie and non-heuweltjie grapevines in terms of berry characteristics and the timing of specific phenological stadia, specifically ripening, harvesting of the grapes should be undertaken separately. This is of particular importance in blocks where there are many heuweltjies, whereas it becomes of lesser significance where the occurrence of heuweltjies is low. Since the results of this study show that wine characteristics varied so significantly between heuweltjie and non-heuweltjie plots, wine making should also be done separately, where possible, to prevent any loss of desired chemical and sensory attributes, as well as a subsequent decrease in quality through mixing of the two different wines. However, all the above-mentioned recommendations are labour intensive and may prove economically unrealistic, depending on each specific scenario. The presence and origin of heuweltjies in vineyards do, however, present a unique opportunity to produce and market wines with a difference.
LITERATURE CITED
Arvidsson, J., 1998. Influence of soil texture and organic matter content on bulk density, air content, compression index and crop yield in field and laboratory compression experiments. Soil Tillage Res. 49, 159-170. [ Links ]
Blake, G.R. & Hartge, K.H., 1986. Bulk density. In: A. Klute (ed.). Methods of soil analysis. Part 1. Physical and mineralogical methods. Am. Soc. Agr., Madison, Wisconsin, USA. pp. 363 - 375. [ Links ]
Bramley, R.G.V. & Hamilton, R.P., 2004. Understanding variability in winegrape production systems 1. Within vineyard variation in yield over several vintages. Aust. J. Grape Wine Res. 10, 32-45. [ Links ]
Chan, K.Y., 2002. Bulk density. In: Lal, R. (ed.). Encyclopedia of Soil Science. Marcel Dekker Inc., New York. pp. 1305 - 1307. [ Links ]
Ekundayo, E.O. & Aghatise, V.O., 1997. Soil properties of termite mounds under different land use types in a Type paleodult of midwestern Nigeria. Environ. Monit. Assess. 45, 1-7. [ Links ]
Ellis, F., 2001. Land degradation on old land surfaces affected by termite activity in arid and semi-arid regions of South Africa. Published in Cartographic Modeling of Land Degredation, Proceedings of the workshop held in Ghent (September) in the framework of the Bilateral Co-operation between Flanders and South Africa. [ Links ]
Ellis, F., 2004. Soil variation on and between heuweltjies in arid and semiarid regions of South Africa. Unpublished paper, Arid Zone Ecology Forum, Victoria West, Northern Cape. [ Links ]
Frageria, N.K. & Baligar, V.C., 2004. Properties of termite mound soils and responses of rice and bean to N, P and K fertilization on such soil. Communic. Soil. Sci. Plant Anal. 35, 15-16. [ Links ]
Gee, G.W. & Bauder, J.W., 1986. Particle size analysis. In: A. Klute (ed). Methods of soil analysis, No 9, Part 1. Am. Soc. Agr., Madison, Wisconsin, USA. pp. 383 - 411. [ Links ]
Glass, G.V., Peckham, P.D. & Sanders, J.R., 1972. Consequences of failure to meet assumptions underlying fixed effects analyses of variance and covariance. Rev. Educ. Res. 42, 238-488. [ Links ]
Hillel, D., 1980. Applications of soil physics. Academic Press, New York. [ Links ]
Jouquet, P., Tessier, D. & Lepage, M., 2004. The soil structural stability of termite nests: Role of clays in Macrotermes bellicosus (Isoptera, Macrotermitinae) mound soils. Eur. J. Soil Biol. 40, 23-29. [ Links ]
Knight, R.S., Rebelo, A.G. & Siegfried, W.R., 1989. Plant assemblages on Mima-like earth mounds in the Clanwilliam district, South Africa. S. Afr. J. Bot. 55, 465-472. [ Links ]
Lambers, H., Chapin III, F.S. & Pons, T.L., 1998. Plant physiological ecology. Springer, New York. [ Links ]
Lee, K.E. & Wood, T.G., 1971. Termites and soils. Academic Press, New York. [ Links ]
López-Hernández, D., 2001. Nutrient dynamics (C, N and P) in termite mounds of Nasutitermes ephrae from savannas of Orinoco Llanos (Venezuela). Soil Biol. Biochem. 33, 747-753. [ Links ]
Lovegrove, B.G. & Siegfried, W.R., 1986. Distribution and formation of Mima-like earth mounds in the Western Cape province of South Africa. S. Afr. J. Sci. 82, 432-436. [ Links ]
Lovegrove, B.G. & Siegfried, W.R., 1989. Spacing and origin(s) of Mimalike earth mounds in the Western Cape Province of South Africa. S. Afr. J. Sci. 85, 108-112. [ Links ]
Lovisolo, C. & Schubert, A., 1998. Effects of water stress on vessel size and xylem hydraulic conductivity in Vitis vinifera. J. Exp. Bot. 49, 693-700. [ Links ]
Mando, A., 1997. Effect of termites and mulch on the physical rehabilitation of structurally crusted soils in the Sahel. Land Degrad. Dev. 8, 269-278. [ Links ]
Marais, J., Hunter, J.J. & Haasbroek, P.D., 1999. Effect of canopy microclimate, season and region on Sauvignon blanc grape composition and wine quality. S. Afr. J. Enol. Vitic. 20, 19-30. [ Links ]
Midgley, J.J. & Musil, C.F., 1990. Substrate effects of zoogenic soil mounds on vegetation composition in the Worcester-Robertson valley, Cape Province, South Africa. S. Afr. J. Bot. 56, 158-166. [ Links ]
Midgley, J.J., Harris, C., Hesse, H. & Swift, A., 2002. Heuweltjie age and vegetation change based on 513 and 14C. S. Afr. J. Sci. 98, 202-204. [ Links ]
Milton, S.J. & Dean, W.R.J., 1990. Mima-like mounds in the southern and Western Cape: Are the origins so mysterious? S. Afr. J. Sci. 86, 207-208. [ Links ]
Moore, J.M. & Picker, M.D., 1991. Heuweltjies (earth mounds) in the Clanwilliam district, Cape Province, South Africa: 4 000-year-old termite nests. Oecologia 86, 424-432. [ Links ]
Okello-Oloya, T., Spain, A.V. & John, R.D., 1985. Selected chemical characteristics of the mounds of two species of Amitermes (Isoptera, Termitinae) and their adjacent surface soils from northeastern Australia. Rev. Ecol. Biol. Sol. 22, 291-311. [ Links ]
Okwakol, M.J.N., 1987. Effects of Cubitermes testaceus (Williams) on some physical and chemical properties of soil in a grassland area of Uganda. Afr. J. Ecol. 25: 147-153. [ Links ]
Page, A.L., Miller, R.H. & Keeney, D.R., 1982. Methods of soil analysis, Part II. Agronomy No. 9. American Society of Agronomy, Madison. [ Links ]
Palmer, A.R., Novellie, P.A. & Loyd, J.W., 1999. Community patterns and dynamics. In: Dean, W.R.J. & Milton, S.J. (eds.). The Karoo: Ecological patterns and processes. Cambridge University Press, Cambridge. pp. 208 - 223. [ Links ]
Picker, M.D., Hoffman, M.T. & Leverton, B., 2007. Density of Microhodotermes viator (Hodotermitidae) mounds in Southern Africa in relation to rainfall and vegetative productivity gradients. J. Zool. 271, 3744. [ Links ]
Pockman, W.T. & Sperry, J.S., 2000. Vulnerability to xylem cavitation and the distribution of Sonoran desert vegetation. Am. J. Bot. 87, 1287-1299. [ Links ]
Pomeroy, D.E., 1983. Some effects of mound-building termites on the soils of a semi-arid area of Kenya. J. Soil Sci. 34, 555-570. [ Links ]
Reynolds, A.G., Senchuk, I.V., Van der Reest, C. & Savigny, C., 2007. Use of GPS and GIS for elucidation of the basis for terroir: spatial variation in an Ontario Riesling vineyard. Am. J. Enol. Vitic. 58, 145-162. [ Links ]
Rebelo, A.G., Boucher, C., Helme, N., Mucina, L. & Rutherford, M.C., 2006. Fynbos biome (Chapter 4). In: Mucina, L. & Rutherford, M.C. (eds.). The vegetation of South Africa, Lesotho and Swaziland. Strelitzia 19, South African National Biodiversity Institute, Pretoria. pp. 53 - 219. [ Links ]
Rivenshield, A. & Bassuk, N.L., 2007. Using organic amendments to decrease bulk density and increase macroporosity in compacted soils. Arboric. Urban For. 33, 140-146. [ Links ]
Robert, O.E., Frank, U.O. & Agbonsalo, O., 2007. Influence of activities of termites on some physical and chemical properties of soils under different land use patterns: A review. Int. J. Soil. Sci., 2, 1-14. [ Links ]
Saayman, D., 1981. Wingerdvoeding. In: Burger, J. & Deist, J. (eds). Wingerdbou in Suid-Afrika. Nietvoorbij, Stellenbosch, South Africa. pp. 371 - 375. [ Links ]
Scheiner, J., Vanden Heuvel, J.E., Pan, B. & Sacks, G.L., 2012. Modeling impacts of viticultural and environmental factors on 3-isobutyl-2- methoxypyrazine in Cabernet franc grapes. Am. J. Enol. Vitic. 63, 94-105. [ Links ]
Shange, P., Carey, V.A., Fey, M. & Strever., A.E., 2006. The challenge of Heuweltjie soils for viticulture in the South Western Cape, South Africa. Poster presented at the 29th Nat. Congress of S.A.S.E.V., 14-17 November, Somerset West, South Africa. [ Links ]
Shapiro, S.S. & Wilk, M.B., 1965. An analysis of variance for normality (complete samples). Biometrika 52, 591-611. [ Links ]
Smart, R.E., 1982. Vine manipulation to improve wine grape quality. In: Webb, A.D. (ed.). Grape and Wine Cent. Symp. Proc., University of California, Davis. pp 1 - 19. [ Links ]
Soil Classification Working Group, 1991. Soil classification - A taxonomic system for South Africa. Memoirs on natural agricultural resources of South Africa No. 15, Dept. of Agricultural Development, Pretoria, South Africa. [ Links ]
The Non-affiliated Soil Analysis Work Committee, 1990. Handbook of standard soil testing methods for advisory purposes. Soil Science Society of South Africa, Pretoria. [ Links ]
White, R.E., 1997 (3rd ed). Principles and practice of soil science: The soil as a natural resource. Blackwell Science, Oxford, UK. [ Links ]
Wood, T.G. & Sand, W.A., 1978. The role of termites in ecosystems. In: Brian, M.W. (ed.). Production ecology of ants and termites. International Biological Program 13. Cambridge University Press, New York. pp. 245 - 392. [ Links ]
World Reference Base for Soil Resources, 2014. International soil classification system for naming soils and creating legends for maps. World Soil Resources Reports 106. FAO of the United Nations, Rome. [ Links ]
Submitted for publication: June 2016
Accepted for publication: September 2016
Acknowledgements: The authors gratefully acknowledge Winetech for providing project funding. Dr F. Ellis is thanked for his interest in the project and his guidance during several field trips.
* Corresponding author: E-mail address: johanvz@sun.ac.za
