


Services on Demand
Article
 English (pdf)
 Article in xml format
 Article references
Indicators

Related links
-
 Cited by Google
 -
 Similars in Google
Share

 Permalink
South African Journal of Enology and Viticulture
On-line version ISSN 2224-7904
Print version ISSN 0253-939X
S. Afr. J. Enol. Vitic. vol.37 n.2 Stellenbosch 2016
ORIGINAL RESEARCH ARTICLES
The development of alcoholic fermented beverages utilizing plums with the application of innovative beverage fermentation technology
G. Williams*; J. van Wyk; C. Hansmann
Department of Food Science and Technology, Cape Peninsula University of Technology, P.O. Box 1906, BELLVILLE 7535, South Africa. Authors E-mail addresses: garethw@elsenburg.com; vanwykj@cput.ac.za; hansmannc48@gmail.com
ABSTRACT
The adaptation of existing technologies toward producing a white wine style alcoholic fermented plum beverage was undertaken. The Independent Variables (ID) were yeast strains (Saccharomyces cerevisiae VIN13 and Saccharomyces bayanus N96), with formulations containing various percentage pulp concentrations at (40%, 50% and 60%). The Dependent Variables (DV) constituted key quality parameters for white wines, namely methanol content, ethanol content, titratable acidity (TA), objective colour, total soluble solids (TDS), pH and sensory profile were measured. Methanol was not detected in the samples, ethanol content, TA, colour, TDS and pH were within the range typical for white wine. The overall sensorial profile of the beverage samples, fruity aroma and sweet associated aroma were rated significantly higher as the pulp concentration increased from 40% to 50% (p < 0.05). Exhibiting comparable sensory attributes namely fruity aroma, sweet-associated aroma, yeasty aroma, sweet taste, sour taste, bitter taste, astringency and fruity flavour, that was typically associated with white wines. The results showed that existing technology can be adapted to produce an alcoholic fermented plum beverage of which the key quality parameters and attributes are comparable to white wines.
Key words: Alcoholic fermented beverage, plums, fermentation, sensory profile, ethanol
INTRODUCTION
The South African plum fruit industry is well established and for the most part focused on supplying plums to the export market. The majority of South African plums are exported to northern hemisphere countries for the duration of their winter and spring seasons (Anon, 2011). South Africa's major plum producing areas situated in the Western Cape Province are the Little Karoo, Paarl, Wolseley/Tulbagh and Stellenbosch areas. The aforementioned areas account for more than half of the plum production, making the Western Cape the leader in plum production. This is largely a result of the favourable weather conditions and the Mediterranean type climate (cold winters and hot, dry summers) (Anon, 2011). However, in spite of the abundant availability of this crop locally, very low volumes are processed or preserved. According to the Department of Agriculture Forestry and Fisheries (DAFF) only 2% of all plums produced in South Africa are utilized by the processing industry (Anon, 2011). This indicates the potential to utilize plums to a greater extent to create value-added niche commodities. Successful expansion of the marketability of underutilized plums could contribute to efficient risk management, enhancing the stability of farming systems and enhance local empowerment (Jaenicke & Lengkeek, 2008). Therefore, many organisations from both the government and non-government sectors are actively promoting the processing of fruit, since fresh produce largely go to waste due to difficulties in effectively handling seasonal gluts. The handling problems include insufficient capacity to store large quantities of fresh produce without incurring heavy losses, local markets that are too small for the large quantities of fresh produce in season and ineffective distribution and transportation to meet the demand in other areas (e.g. urban areas) (Gomez & Ricketts, 2013). Due to these constraints, rural producers are often forced to give produce away or let it rot. To prevent this loss, attention is drawn towards converting such gluts into value-added products to be sold commercially in the retail market.
Processing of fruits into value-added products is the best alternative to control the huge losses. Processed fruit products generally include minimally processed fruit products such as fresh-cut fruit, fermented fruit products such as cider, wine and vinegar, traditional thermally processed fruit products such as jam, jelly, juice and beverages, novel non-thermal processed fruit products such as juice and beverages (Rupasinghe & Yu, 2012). Processing may be achieved by using preservatives such as sugar, salt and vinegar, by drying, concentration or fermentation. Though production of alcoholic fermented beverages is mainly done by the fermentation of grape juice, it is also produced extensively from fruits other than grapes across the globe (Jarvis, 2001; Kumar et al., 2009; Isitua & Ibeh, 2010). According to McCance & Widdowson (2015), the individual sugars present in plums are glucose, fructose and sucrose. During fermentation, yeast converts one mole of sugar into two moles of ethanol and two moles of CO2 via glycolysis (Embden-Meyerhof pathway). A significant portion of sugar is used for the formation of biomass and other by-products (e.g. glycerol, organic acids, esters and higher alcohols), resulting in only 92 - 93% of sugars being available for conversion into ethanol. Hence, using plums to develop fermented alcoholic beverages is a viable proposition in terms of value-addition and therefore, increased utilization of this crop.
To a great extent alcoholic fermented beverage quality is related to overall aroma and therefore to the volatile compounds responsible for these aromas which produce a sensorial effect (Sáenz-Navajas et al., 2010). To fully be aware of chemical compounds within alcoholic fermented beverages that contribute desirable sensory characteristics, it is important to obtain some information regarding both volatile composition and sensory properties (Capone et al., 2013). Gas chromatography is one of the important techniques of analysis for volatile components which contribute to the aroma of alcoholic fermented beverages. Equally important is the formation and the detection of methanol by using gas chromatography. Methanol is considered to be highly toxic whereby the ingestion or inhalation can cause blindness or death (Blinder et al., 1988). Methanol in alcoholic fermented beverages is formed from the demethoxylation of esterified methoxyl groups of the pectin polymer. Pectins which are present in fruits are composed of the methyl ester of alpha-1.4-linked, D-galactopyranose units and is the general term for pectic substances which form the characteristic sugar-acid gels. Thus, the use of pectolytic enzymes is of major importance to this study since it removes methoxyl groups from methylated pectic substances (pectin).
However, even more important than instrumental assays, sensory analysis achieves the qualitative and quantitative detection and description of sensory components of a product by a trained panel ofjudges (Meilgaard et al., 1999). Quantitative Descriptive Analysis is an informative tool and technique often used to provide complete sensory description of a product, including alcoholic fermented beverages (Murria et al., 2001). Results obtained from descriptive analysis enable the relation of specific ingredients or process variables to specific changes in sensory attributes of food products in general including the alcoholic fermented beverages that are the focus of this study. From a product development perspective, descriptive data is essential in directing efforts to focus on those product variables that are identified as essential to achieve the desired sensory profile (Stone & Sidel, 2003). Multivariate analysis, particularly Principal component analysis (PCA) is frequently used as the statistical tool of analysis and has been applied to sensory results (Noble & Ebeler, 2002).
The aim of this study was to measure methanol, ethanol, titratable acidity, objective colour, total soluble solids and sensory profile as a function of yeast and percentage pulp in order to adapt existing technologies toward producing new fermented fruit beverage products using plums, an underutilized agricultural produce.
MATERIALS AND METHODS
Preparation of the alcoholic fermented plum beverages
Fruit preparation
Songold plums were obtained from Sandrivier (Wellington, South Africa) and African pride plums were obtained the Agricultural Research Council (Infruitec-Nietvoorbij, Stellenbosch, South Africa). Only mature fruit were included when selecting plums for use in this study, where mature fruit is defined as having a oBrix level of 12 or more (McCance & Widdowson, 2015). Plums received from the suppliers were placed into plastic fruit crates (20 kg) and placed in cold storage at (4°C) for a maximum of two weeks to control the ripening. After storage, only plums that were free from mould were thoroughly washed before cutting. Plums were cut in half by hand using stainless steel paring knives, after which the stones were removed to prepare the fruit for the pulping process. Pulping was achieved using a fruit-pulper fitted with a 2 mm stainless steel sieve (Jas Enterprises, Rakhial Ahmedabad, India). The plum halves were fed slowly through the fruit pulper to prevent blockage and it also allowed peels to be separated from the pulp. Pasteurization of the pulp was performed to ensure preservation of the pulp. This operation was carried out by using a tube-in-tube heat exchanger at a temperature of 92°C for 10 - 60 sec, followed by hot-filling the pulp into 250 mL foil-laminate juice pouches, followed by heat sealing. The pouches were then placed in frozen storage at -15°C, thereby ensuring stability and consistent quality throughout the study.
Product development
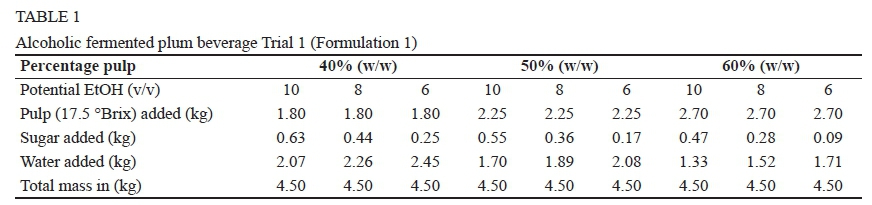
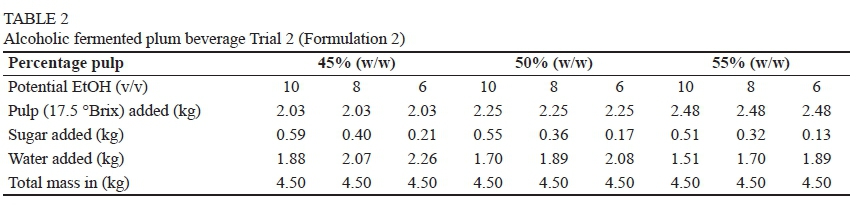
Preliminary trials were conducted to establish formulations. A range of formulations were developed by combining different ratios of pulp at 17.5 °Brix and added sucrose (Hulett Refineries Ltd., Durban, South Africa), as summarised in the resulting formulations, namely Formulations 1 (Table 1) and 2 (Table 2) were prepared, inoculated, fermented, clarified and bottled. The resultant alcoholic fermented plum beverages were evaluated by wine researchers at the Post-harvest and Wine Technology division (Agricultural Research Council, Nietvoobij, Stellenbosch, South Africa).
The tasting sessions were conducted such that each sample (i.e. treatment combination) was evaluated twice, but on two separate days. Eighteen samples per session were presented to each panellist in ISO standard wine tasting glasses which were placed on a tray labelled with the relevant information. All samples were clearly marked with the percentage pulp, added sugar and yeast strain that were used. Approximately 100 mL per glass was served throughout. Seven male judges, ranging in age from 25 to 65 participated in these taste sessions. These judges were all trained wine tasters and had extensive knowledge and experience in wine research and wine tasting.
After the two tasting sessions for each pulp-sugar-yeast strain combination, a general discussion took place, at the end of which the expert judges reached consensus on which formulation would produce the most sensorially acceptable beverage, based on flavour, i.e. aroma and taste. The best formulation was found to be Formulation 1 with the pulp percentage between 40 - 60% (Table 1), as well as those samples that contained 10% ethanol (EtOH), this being the typical average EtOH content in white wine (Tabilo-Munizaga et al., 2014).
Production of alcoholic fermented plum beverages The selection of yeast strains used in the study was based on them being the most widely used commercially in the South African wine industry, as well as their capacity to enhance flavour or aroma through their ability to produce esters (Swiegers & Pretorius, 2005). The two yeast strains that were used in the study were namely Saccharomyces cerevisiae (hybrid) VIN13 (ester forming) (Anchor Yeast, Cape Town, South Africa) and Saccharomyces bayanus N96 (Anchor Yeast, Cape Town, South Africa) used in the fermentation of the must. Sugar (sucrose, Hulett Refineries Ltd., Durban, South Africa) was also used in the formulation. Wine was fermented in "Oom Tas" bottles with a capacity of 5 L, equipped with fermentation traps (Wine Machinery, Stellenbosch, South Africa). Kieselguhr, a commercial filtering aid, coarse pre-filter pads (Fibrafix AF 30, Filtrox, St. Gallen, Switzerland) and 4.5 μm fine filter pads (Filtrox, St. Gallen, Switzerland) were used in the filtration process. After filtration, the samples of alcoholic fermented plum beverages were filled into 275 mL clear bottles and hermetically sealed with crown corks, also known as crown seal or crown cap closures.
Fermentations were carried out at a temperature of 15°C in a wine cellar at the Agricultural Research Council (Nietvoorbij, Stellenbosch, South Africa). The formulations, consisting of varying plum pulp, sugar and water concentrations (Table 1) were prepared was inoculated with 1.5 g of either VIN13 or N96 yeast strains. Thereafter, pectolytic enzymes were prepared and 1.2 mL of each preparation was added to the pulp to increase the yield (Pectinex Ultra Mash, Novozymes, Bagsvaerd, Denmark) and to assist with clarification (Pectinex Ultra Clear, Novozymes, Bagsvaerd, Denmark), Since it enhances sedimentation of the must. Fermentations were performed in 52 fermentation vessels ("Oom Tas" bottles), each fitted with a fermentation trap (Wine Machinery, Stellenbosch, South Africa). The fermentation traps were inspected on a weekly basis to observe fermentation activity in the form of visible bubbles caused by CO2 released during the fermentation. After five weeks, the traps were monitored daily for three weeks during which time the fermentation traps showed no further activity which indicated that the evolution of CO2 had ceased and that the fermentation process was complete.
Since the fermentation vessels were not disturbed or physically displaced during fermentation, at the end of the fermentation, the lees were completely settled, obviating a further standing period. The clear fermented beverage in each "Oom Tas" bottle was racked from the lees at the cellar (at a temperature of 15°C). The beverage samples were then transferred into 10 L stainless steel vessels equipped with pressure inlet and outlet valves. Before the filtration procedure commenced, 50 g of Kieselguhr was added to each stainless steel vessel. Using pressure filter assemblies equipped with a coarse pre-filter (Fibrafix AF 30, Filtrox, St. Gallen, Switzerland), followed by a 4.5 μm filter pad (Filtrox, St. Gallen, Switzerland) and nitrogen gas at 200 kPa, the samples were filtered and bottled. Each bottle was capped with a crown closure and each batch yielded 12 bottles (275 mL) of alcoholic fermented plum beverage. Bottled beverage samples were subjected to pasteurization in a dry oven at a temperature of 80°C for 45 min, followed by cooling in water at 10°C.
Chemical analyses
Materials
Unless otherwise specified, all the chemicals used in this study were of Analar grade and chemical reagents were prepared according to standard analytical procedures.
Linearity curve
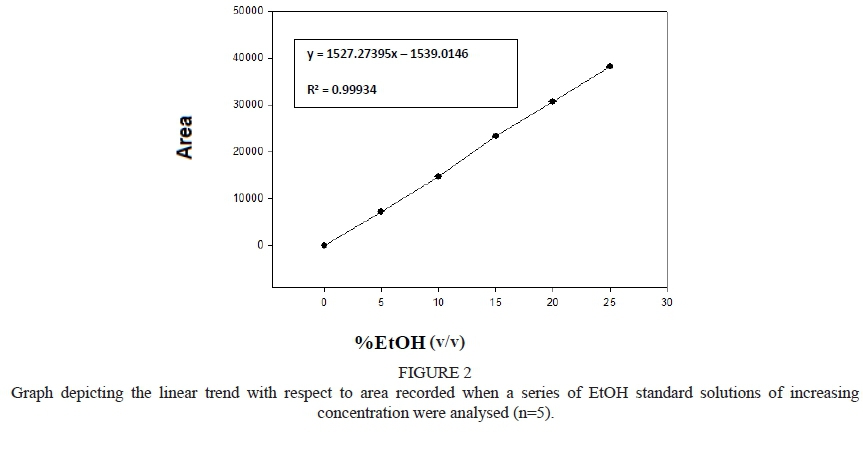
Ethanol (EtOH) and methanol (MeOH) (Merck, Darmstadt, Germany) used in GC analysis were of chromatography grade. Milli-Q water (Millipore, Bedford, MA, USA) (18.2 ΜΩ/cm) was used for dilutions of standards. A linearity curve was constructed using standard solutions at 0.5, 1, 2, 3 and 4% (v/v) for MeOH (Fig. 1) and standard solutions at 5, 10, 15, 20 and 25% (v/v) for EtOH (Fig. 2). Five standards per concentration (n = 5) were analysed and the multiple correlation coefficient (R2) and regression coefficient (R) were used to determine whether the peak areas plotted would be linear over the concentration range. The linearity curve was also assessed to ensure that the method was sufficiently sensitive over the concentration range of MeOH and EtOH levels anticipated to be present in the alcoholic fermented plum beverage samples. The limits of detection (LOD) and limits of quantification (LOQ) limits were calculated based on the standard deviation (SD) of the response and the slope (S) of the calibration curve at levels approximating the
LOD according to the formula: LOD = 3(SD/S). The LOQ was determined using the response SD and the slope of the calibration curve according to the formula: LOQ = 10(SD/S). The calibration curve was created using SigmaPlot® 2001 for Windows® (Version 6:10, SPSS Inc., Chicago, IL, USA).
Repeatability
The repeatability or relative precision of the method was established by measuring replicates of standard solutions of MeOH and EtOH of known concentration over two consecutive sessions on the same day and over two consecutive days, i.e. intra-day and inter-day assays. Five replicates of the MeOH and EtOH standards were analysed in two sessions on one day and the intermediate precision was determined by analysing two sets of 10 replicates of MeOH and EtOH standards on two consecutive days.
Gas chromatography (GC) assay
The MeOH and EtOH in the alcoholic fermented plum beverages were analyzed separately, both without any extraction process preceding the assay. A one mL aliquot of each sample was pipetted into a two mL screw-cap clear glass vial with a septum (Chemetrix, South Africa), followed by injection. An Agilent 7890 A GC system equipped with a split/splitless injector and a flame ionisation detector was used (Agilent Technologies, Waldbron, Germany). The analysis for MeOH was performed with an HP 88 column (100 m χ 0.25 mm internal diameter, 0.2 μηι film thickness; J&W Scientific, Folsom, California, USA). The analysis for EtOH was performed with a DB23 column (60 m χ 0.25 mm internal diameter, 0.15 μηι film thickness; J&W Scientific, Folsom, California, USA). The GC parameters for both MeOH and EtOH were set as follows: the temperature of the injector and detector was set at 250°C and 300°C, respectively. The oven temperature was set at 150°C and the samples analyzed isothermically for 6 min. Nitrogen (Air Liquide, Gauteng, South Africa) was used as the carrier gas at 22.3 kPa, with a split vent of 40 mL.min1. Injections of 1 μL were made in split-mode with a speed ratio of 50:1. The EtOH and MeOH (Merck, Germany) in the samples were identified by comparing the retention times of the samples with those of 99.9% HPLC grade MeOH and EtOH standard solutions. Quantification of MeOH and EtOH was performed using Chemstation software (version B.04.01) (Agilent Technologies, Waldron, Germany) after determining the detector response factor for both MeOH and EtOH in each sample.
Titratable acidity
The titratable acidity (TA) of the alcoholic fermented plum beverage samples was determined by titrating a 5 mL aliquot of alcoholic fermented plum beverage with 0.1 N NaOH to a pH endpoint of 8.2 using an automated titrator (Crison compact titrator, version D, Alella, Spain). The TA of the samples was measured in grams malic acid per litre.
Total soluble solids analysis
The total soluble solids (TSS) content of the plum pulp and alcoholic fermented fruit beverage samples were measured in °Brix using an Atago Palette PR-101 refractometer (Tokyo, Japan).
Spectrophotometric measurements
Alcoholic fermented plum beverage samples were placed in 2 mL sample cuvettes. Spectrophotometric measurements for colour of the alcoholic fermented beverage samples were performed using a colorimeter (Model CM - 5, Konica Minolta Sensing Inc., Osaka, Japan). Each measurement was based on the CIELab colour co-ordinates, namely L*, a*, b*, C and h. Colour values were expressed as L* (whiteness or brightness/darkness), a* (redness/greenness), b* (yellowness/ blueness), C (Chroma) expresses the degree of colour for an area viewed on CIELab colour coordinates viewed in relation to its brightness, which is calculated as (a* + b*)½, while h (hue angle) is derived from the two coordinates a* and b* and is determined as arctan b*/a*, Hue angle is expressed on a 360° grid where 0° = bluish-red, 90° = yellow, 180° = green, 270° = blue and 360° = red (Sahin & Sammu, 2006).
Sensory evaluation
Sensory panel composition
Nine female judges and one male, ranging in age from 25 to 65, participated in the study. They were selected based on availability and product interest. Most of them had extensive experience with descriptive analysis of a wide range of products.
Panel Training
The training of the panel was conducted according to the consensus method described by Lawless and Heyman (1998). The panellists were informed about the background and objectives of the study and instructed on the sensory evaluation procedure. They were instructed to remove the plastic cap from the serving glass, swirl the glass three times in an anti-clockwise rotation and then evaluate the aroma of the alcoholic fermented plum beverage sample. Thereafter, they were instructed to evaluate the flavour, taste and mouthfeel by sipping a mouthful of the beverage. The panel was also instructed to cleanse their palate in-between samples using water and unflavoured water biscuits.
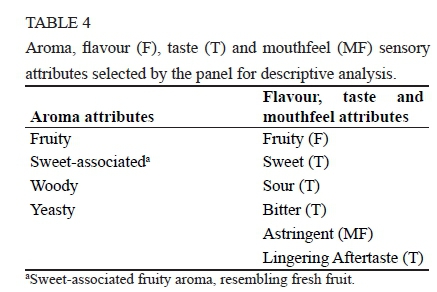
During the first part of the training, panellists were exposed to a number of reference standard samples (Table 3) to familiarise themselves with the product and the analysis protocol. Thereafter, panellists were given alcoholic fermented plum beverage samples, where the panellists were then instructed to compare the aroma attributes of the reference standards to the aroma of the samples. Flavour, taste, aroma and mouthfeel terminology, also known as descriptive terms (or descriptors) were suggested and deliberated by the panel members and each new term was recorded. Aroma was defined as the fragrance or odour perceived through orthonasal analysis, while flavour referred to the retronasal perception in the mouth. The term 'taste' was used to describe the basic taste modalities, i.e. sweet, sour, salty and bitter. Mouthfeel was described as the tactile sensation that occurred in the oral cavity after sipping the alcoholic fermented plum beverage (Gawel et al., 2000). Relationships and redundancies among the terms were discussed and definitions and actual reference standards for the prevailing sensory descriptors were obtained (Table 3).
During 24 one-hour training sessions, the alcoholic fermented plum beverage samples were analyzed and compared to one another by the panel based on the descriptors. During these training sessions twelve aroma and six flavour, taste and mouthfeel descriptors were generated for the beverage samples. Ten of these terms were selected for inclusion in the sensory analysis based on their frequency of being mentioned by the panel during the training phase. The selected descriptors, i.e. sensory profiling attribute terms included four aroma descriptors, one flavour descriptor, four taste descriptors and one mouthfeel descriptor (Table 4). A score sheet was then developed which was used by the panel to score the intensity of each of the 10 descriptors on a 100 mm unstructured line scale anchored on both sides with two word descriptors - "Absent" and "Prominent". During the final training sessions, the panel practised intensity ratings of individual attributes on the line scales using the standards representing intensity extremes for all of the descriptors. Maximum and minimum intensity values for the ten attributes were discussed and compared to the attribute intensity scores that had been awarded by the panel.
Samples and sample serving
Bottled alcoholic fermented plum beverage samples were used for the descriptive sensory analysis of the beverage. Samples were presented to the panel in International Standards Organization (ISO) standard wine tasting glasses, placed on a traysheet labelled with relevant information regarding the samples in question that represented the experimental design described in section 2.4. Samples were labelled with random three-digit codes and presented to each panellist. Approximately 30 mL per glass was served, each covered with a plastic cap to prevent evaporation and loss of volatiles.
Intensity rating
The panel was requested to use the score cards to rate the intensities of the 10 attributes for each of the alcoholic fermented plum beverages during six sessions spread out over two weeks. One session was conducted per day and a maximum of 12 samples were analyzed per session. Panellists were requested to take a 10 min break after every 3 samples to avoid sensory fatigue. Each sample was analyzed in triplicate, on three non-consecutive days in order to test for panel reproducibility and reliability.
Experimental design
The physicochemical experimental design was a 3 x 2 design with three pulp concentrations and two yeast strains VIN13 and N96. The response variables were titratable acidity, °Brix, pH, ethanol (EtOH), methanol (MeOH) and colour (L*, a*, b*, C, h). The sensory evaluation experimental design comprised of 3 x 2 x 10 x 3 factors, namely three pulp concentrations, two yeast strains, ten panellists and three sensory evaluation sessions. The response variables were fruity aroma, sweet-associated aroma, woody aroma, yeasty aroma, sweet taste, sour taste, bitter taste, lingering aftertaste and fruity flavour.
Data analysis
The physicochemical data was subjected to a multivariate analysis of variance (ANOVA) to ascertain whether the main effects resulted in significant differences in response variables. The Duncan's multiple comparison post hoc test was used to test significant differences (p < 0.05) between individual means. The sensory evaluation data was subjected to factor analysis (Principle component analysis (PCA)) and multivariate ANOVA IBM® SPSS® statistical software (Version 22; IBM Corporation, New York, USA) was used for data analysis. Microsoft® Excel 2010 software (Maryland, USA) was used to construe a spider plot as a graphic summary of the data.
RESULTS AND DISCUSSION
Linearity
An acceptable linearity was demonstrated between the specific MeOH and EtOH peak areas and concentrations of the injected standards over a range of concentrations, between 0.5 - 4% (v/v) for MeOH and 5 - 25% (v/v) for EtOH, respectively (Table 5). The correlation coefficient (R2) = 0.99946 and regression coefficient (R) for MeOH was 0.99934 (Fig. 1) and the EtOH correlation coefficient (R2) = 0.99972 and regression coefficient (R) was 0.99967 the (Fig. 2). This clearly indicated that the linearity was satisfactory for MeOH and EtOH. The LOD for MeOH was 0.00000142 μg/mL and the LOQ was 0.00000473 μg/mL (Table 5). The LOD for EtOH was 0.000603 μg/mL and the LOQ was 0.00201 μg/mL (Table 5).
The calibration procedure was performed according to the AOAC guidelines (Anon, 2002), and the results confirmed that the concentration range of interest over five points having equal spacing was a suitable calibration pattern, while a high correlation co-efficient of > 0.99 is proof of a good quality linear fit. A similar study done on alcoholic fermented beverages by Farina et al. (2007) also showed a correlation coefficient of > 0.99. Hence, the methods used to determine R2 and R for MeOH and EtOH were validated using the calibration procedure, confirming that the method was reliable.
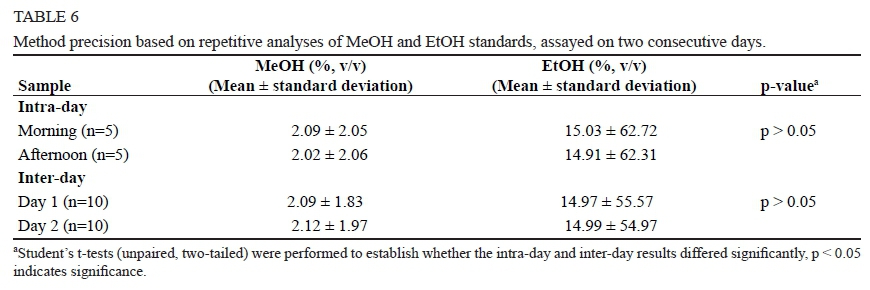
Precision
The analytical precision was summarised in Table 6 for both MeOH and EtOH. Repeatability precision was determined by analysing aliquots of the same sample numerous times. This includes simultaneous and consecutive replicates of the sample (Van Wyk & Britz, 2012). Five replicates of the MeOH and EtOH standards were analysed in two consecutive sessions on one day (simultaneous replicates). The intermediate precision was determined by analysing 10 sample replicates of the MeOH and EtOH standards on two consecutive days. The mean ± standard deviation (SD) was calculated and the probability was non-significant (p > 0.05) (Table 6) in all cases, indicating acceptable precision of the analytical methods.
Physicochemical analysis
According to Wills et al. (1983) the major acid in plums is malic acid, followed by quinic acid and citric acid. Thus the Titratable acidity (TA), expressed as grams malic acid per litre, ranged between 7.64 - 12.95, increasing significantly (p < 0.05) as the pulp concentration increased from 40% (w/w) to 60% (w/w) pulp concentration (Table 7). This observed increase is the result of incorporating more pulp in the formulation with a simultaneous increase in acidity originating from the pulp. These results were congruent with those reported by Joshi et al. (2012) in a similar study on alcoholic fermented plum beverages. The TA of white (grape) wines is typically 7.5 - 9.0 g/L. Hence, the TA of the fermented plum beverages was similar to that of grape wines, albeit that the latter is expressed as tartaric acid (Buglass, 2011). The total soluble solids (TSS), measured in °Brix, ranged from 8.30 to 8.95 (Table 7). Even though there were no significant differences (p > 0.05) among treatments (yeast or % pulp), the results obtained were similar to the results reported by Joshi, Sharma & Devi (2009) for alcoholic fermented beverages from plums, with the TSS ranging from 7.2 - 7.6.
The pH values ranged between 3.45 - 3.55 with differences not significant (p > 0.05) among treatments (Table 7). Hence, the significantly higher TA observed with 60% pulp did not translate into significantly lower pH values. However, the pH range observed in this study is comparable to that of white wines produced in South Africa where the pH ranges between 3.11 - 3.84 (Nieuwoudt et al., 2002), and which is favourable for storage stability of wines, since this relatively low pH inhibits spoilage (Jackson, 2008).
The %EtOH (v/v) ranged between 11.60 - 11.99% (Table 7), which was slightly higher than the target %EtOH based on the beverage formulations, namely 10% (v/v). However, the %EtOH (v/v) measured in this study can be compared to the ethanol content of a typical South African white wine style such as Sauvignon Blanc where the %EtOH (v/v) ranges between 11.8 - 11.9 %EtOH (v/v) (King et al., 2010). Differences in %EtOH among treatments were not significant (p > 0.05) (Table 7).
MeOH was not detected in the present study and therefore could not be quantified (Table 7). This result is important because the production of MeOH in alcoholic fermented beverages is not only considered an undesirable component in the final product, but is identified to be toxic to humans when consumed even in relatively low concentrations (Campos et al., 2010). The undetectably low MeOH levels in this study compare favourably with other studies, for example, the methanol content in South African young white wines were reported in a study by Louw et al. (2010) to range between 25 - 83 mg/L.
The alcoholic fermented beverage samples were observed to be "yellow" in colour. The results (Table 7) confirmed that there were no significant differences (p > 0.05) between treatments in terms colour space coordinates L*, a*, b*, C and h. The ranges of all the colour coordinates in all treatments were L* = 94.18 - 94.85, a* = +2.22 - +4.30, b* = +10.74 -+17.20, C = 10.13 - 16.82 and h = 84.88 - 87.94. The CIELab colour coordinates typical of white wine measured during a twelve month shelf-life period by Recemales et al. (2006) were L* = 100.11, a* = -0.21, b* = +3.87, C = 5.15 and h = 106.03. The most notable differences between these and the measurements for the plum beverage in this study were low positive values for a* (redness) and low positive b* values (yellowness), while the white wines had very low negative a* (green) and comparatively lower positive b* (yellow) values (Recemales et al., 2006), indicating a more intense yellow colour for the fermented plum beverage samples. However, when comparing the CIELab colour coordinates of alcoholic fermented plum beverages produced in this study to that of white wines, it is clear that the two types of alcoholic beverages are similar in terms of colour. Hence, the processing parameters as described in section 2.1.4 resulted in alcoholic fermented plum beverages that were comparable to typical white wines in terms of all the aforementioned physicochemical parameters.
Sensory evaluation
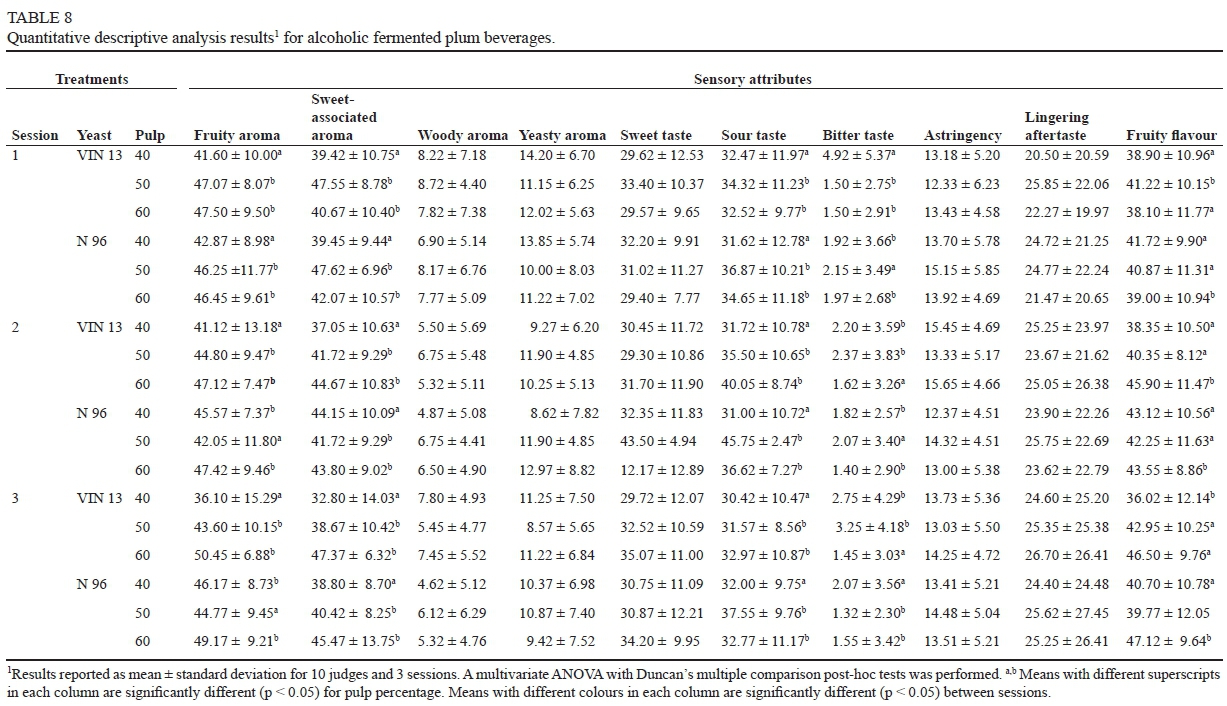
Principal component analysis (PCA) was performed to summarise the sensory data. When reviewing the PCA results, the correlation was not strong enough between dependent variables (DV), namely fruity aroma, sweet-associated aroma, woody aroma, yeasty aroma, sweet taste, sour taste, bitter taste, lingering aftertaste and fruity flavour. This means that the information inherent in each DV was unique, as it did not influence the response to any other. The Kaiser-Meyer-Olkin Measure of Sampling Adequacy (KMO) test result was 0.695, with the ideal value > 0.8, but since it was significant (p < 0.001), the components with Eigen values > 1.00 were extracted. The extraction yielded three components, with component 1 explaining only 26.53% of the total cumulative variance, component 2 only 43.70% and component 3 only 59.99% of the total cumulative variance. Hence, the three components explained less than 60% of the total cumulative variance, while the ideal is > 80%. Moreover, this means that 40% of the information contained in the data would be lost when using this data reduction tool. Hence, PCA was not a suitable tool to explain variability in the judgement of the trained panellists concerning the response variables. Instead, a spider plot was used to summarise the data (Fig. 3). The lines on the spider plot, describing the individual curves corresponding to the different treatments, are virtually superimposed (Fig. 3). This signifies that the treatments had a minimal effect on the sensory characteristics, resulting in panel responses that showed that he panel did not find considerable differences between the samples. Overall, woody aroma ranged between 4.62 - 8.72 and yeasty aroma ranged between 8.57 - 14.20 (Table 8). Hence, both aroma attributes were scored at the lower end of the line scale (Figure 3). The mean scores for lingering aftertaste ranged between 20.50 - 26.70, i.e. although double the highest score for yeasty aroma, it was still closer to "Absent" on the line scale. Fruity aroma and sweet associated aroma were rated significantly higher as the pulp concentration increased from 40% to 50% (p < 0.05), but was not rated significantly different (p > 0.05) as the pulp concentration increased from 50% to 60%. However, the scores for fruity flavour at 60% pulp concentration were significantly different (p < 0.05) for all three sessions, with this pulp concentration resulting in the most intense fruity flavour. The result (Table 8) agrees with that observed on the spider plot (Figure 4) where overall 60% pulp concentration resulted in the highest fruity flavour. The differences in sweet taste between samples were not significant (p > 0.05). Hence, the different treatments did not affect the panel's response in terms of sweet taste. This agrees with the sugar levels that were measured in °Brix which were all very similar and not significantly different (p > 0.05) (Table 7). Sour taste was rated significantly lower (p < 0.05) for 40% pulp concentration, than for 50% and 60%, while the panel rated the sour taste most intense in most of the samples containing 50% pulp (Table 8). As far as TA is concerned, these results partially agreed with the results in Table 7, with the lowest TA recorded for 40% pulp. However, contrary to the sensory results for sour taste, the highest TA was measured for 60% and not for 50% pulp (Table 7), while the pH at all pulp concentrations were similar (Table 7). The panel's overall response for sourness ranged between 31.00 - 45.75, i.e. approximately midway between "Absent" and "Intense". This anomaly could be explained by the fact that fruitiness was most intense at 60% pulp concentration thereby making the higher level of sourness more acceptable to the panel. Bitter taste was rated significantly different (p < 0.05) for 40% pulp concentration samples. However, the results showed inconsistency in the sense that no clear trend was identifiable, since in some cases the bitterness in 50% pulp concentration samples were rated most prominent, while in other cases the 40% pulp concentration samples were rated most bitter. This could be attributed to the fact that phenols present in plum alcoholic fermented beverage samples can cause both a bitter and astringent sensation, which are easily confused by panellists (Noble, 1999). Therefore, the influence of astringency in samples could have confounded the panel's response to bitterness (Noble, 1999). Further credence is lent to this hypothesis, since astringency was also not rated significantly different (p > 0.05) (Table 8). Hence, the processing parameters used in this study produced alcoholic fermented plum beverages that exhibited comparable sensory attributes namely fruity aroma, sweet-associated aroma, yeasty aroma, sweet taste, sour taste, bitter taste, astringency and fruity flavour , that were typically associated with white wines (Sokolowsky et al., 2015).
CONCLUSIONS
The study aimed to measure the Dependent Variables (DV) which constitute the key quality parameters for white wines (Sokolowsky et al., 2015), in response to two independent variables (ID), in order to adapt existing technologies towards producing an white wine style alcoholic fermented plum beverage samples. From the results in this study it can be seen that the DV measured were similar to corresponding parameters of white wines. While the different treatments did not affect the sensory profile significantly (Figure 4), the alcoholic fermented plum beverage samples had sensory properties similar to that of white wines (Sokolowsky et al., 2015). In terms of the balance between the acidity, fruity aroma, sweet associated aroma and fruity flavour, 50% pulp concentration would result in the fermented beverage with the greatest sensory appeal. The alcohol level in this beverage is similar to that of white wine, hence is projected to appeal to typical consumers of white wine. Moreover, in a further study the technology developed will be applied to develop red wine styled alcoholic fermented beverages with high overall consumer acceptability, using alternative fruit varieties (red-fleshed plums and selected berries).
LITERATURE CITED
Anonymous. 2002. AOAC requirements for single laboratory validation of chemical methods. Draft 2002-11-07. Available at http://www.aoac.org/AgMaterials/additives/aoacslv.pdf. [ Links ]
Anonymous. 2011. A profile of the South African plum market value chain. Retrieved March 12, 2013, from http://www.daff.gov.za. [ Links ]
Blinder, F., Voges, E. & Lauge, P. 1988. The problem of methanol concentration admissible in distilled fruit spirits. Food Additives and Contaminants, 5, 343-351. [ Links ]
Buglass, A.J. 2011. Handbook of alcoholic beverages: Technical, Analytical and Nutritrional aspects. Volume I. John Wiley & Sons Ltd., West Sussex, United Kingdom, P. 272. [ Links ]
Campos, C.R., Silva, C.F., Dias, D.R., Basso, L.C., Amorim, H.V. & Schwan, R.F. 2010. Features of Saccharomyces cerevisiae as a culture starter for the production of the distilled sugar cane beverage, cachaça in Brazil. J. Appl. Microbiol. 108, 1871-1879. [ Links ]
Capone, S., Tufariello, M. & Siciliano, P. 2013. Analytical characterisation of Negroamaro in red wines by "Aroma Wheels". Food Chem. 141, 29062915. [ Links ]
Farina, L., Boido, E., Carrau, F. & Dellacassa, E. 2007. Determination of volatile phenols in red wines by dispersive liquid-liquid microextraction and gas chromatography-mass spectrometry detection. J. Chromat. A, 11, 46-50. [ Links ]
Gawel, R., Oberholster, A. & Leigh Francis, I. 2000. A 'Mouth-feel wheel': terminology for communicating the mouth-feel characteristics of red-wine. Aust. J. Grape and Wine Res. 6, 203-207. [ Links ]
Gómez, M.I. & Ricketts, K.D. 2013. Food value chain transformations in developing countries: Selected hypotheses on nutritional implications. Food Policy, 42, 139-150. [ Links ]
Hunterlab, 2002. Universal software® User's Manual Version 2.5. Pp. 2223, Hunter Associates Laboratory, Ruston, Virginia, USA. [ Links ]
Isitua, C.C. & Ibeh, I. 2010. Novel method of wine production from banana (Musa acuminata) and pineapple (Ananas comosus) wastes. Afr. J. Biotechnol. 9, 7521-7524. [ Links ]
Jackson, R.S. 2008. Post Fermentation treatments and related topics. In: Wine Science Principles and Applications (3rd edition). Pp. 423-424, Academic Press, San Diego, California, USA. [ Links ]
Jaenicke, H. & Lengkeek, A. 2008. Marketing the products of underutilized crops - challenges and opportunities for pro-poor economic development. Acta Horticult. 770, 87-94. [ Links ]
Jarvis, B. 2001. Cider, perry, fruit wines and other fermented fruit beverages. In: Fruit Processing (2nd edition). Pp. 111-148, Aspen Publishers Inc, Gaithersburg, Maryland, USA. [ Links ]
Joshi, V.K., Sharma, R., Girdher, A. & Abrol, G.S. 2012. Effect of dilution and maturation on physicochemical and sensory quality of Jamun (Black plum) wine. Indian J. Nat. Prod. Resources 3, 222-227. [ Links ]
Joshi, V.K., Sharma, S. & Devi, M.P. 2009. Influence of different yeast strains on fermentation behaviour, physicochemical and sensory qualities of plum wine. Nat. Prod. Rad. 8(4), 445-451. [ Links ]
King, E.S., Kievit, R.L., Curtin, C., Swiegers, J.H., Pretorius, I.S, Bastian, S.E.P. & Francis, I.L. (2010). The effect of multiple yeasts co-inoculations on Sauvignon Blanc wine aroma composition, sensory properties and consumer preference. Food Chem. 122, 618-626. [ Links ]
Kumar, Y.S., Prakasam, R.S. & Reddy, O.V.S. (2009). Optimization of fermentation conditions for mango (Magnifera indica L.) wine production by employing response surface methodology. Int. J. Food Sci. Technol. 44, 2320-2327. [ Links ]
Lawless, H.T. & Heymann, H. 1998. Descriptive analysis. In: Sensory evaluation of food. Principles and practices (1st edition). Pp. 362-368, Chapman & Hall, New York, USA. [ Links ]
Louw, L., Tredoux, A.G.J., Van Rensberg, P., Kidd, M. Naes, T. & Niewoudt, H.H. 2010. Fermentation-derived aroma compounds in varietal young wines from South Africa. S. Afr. J. Enol. Vitic. 31, 213-225. [ Links ]
McCance, R. A. & Widdowson, E. M. 2015. The Composition of Foods. 7th summary edition. CPI group (UK) Ltd., Croydon, London, United Kingdom. [ Links ]
Meilgaard, M., Civille, G.V. & Carr, B. 1999. Sensory Evaluation Techniques. (3rd edition). P. 387, CRC Press, Boca Raton, Florida. [ Links ]
Murria, J.M., Delahunty, C.M.A. & Baxter, I.A. 2001. Descriptive sensory analysis: past, present and future. Food Res. Int. 34, 461-471. [ Links ]
Nieuwoudt, H.H., Prior, B.A., Pretorius, I.S. & Bauer, F.F. 2002. Glycerol in South African table wines: An assessment of its relationship to wine quality. S. Afr. J. Enol. Vitic. 23, 22-29. [ Links ]
Noble, A.C. & Ebeler, S.E. 2002. Use of multivariate statistics in understanding wine flavour. Food Rev. Int. 18, 1-21. [ Links ]
Noble, A.C. 1999. Why do wines taste bitter and feel astringent? In: Chemistry of Wine Flavour. Pp. 156-165. ACS Symposium Series 714, American Chemical Society, Washington DC, USA. [ Links ]
Recemales, A.F., Sayago, A., González-Miret, M.L. & Hernanz, D. 2006. The effect of time and storage conditions on the phenolic composition and colour of white wine. Food Res. Int. 39, 220-229. [ Links ]
Rupasinghe, H. & Yu, L.J. 2012. Emerging preservation methods for fruit juices and beverages. In: Food Additives. Pp. 65-82. In Tech - Open Access Publisher, Rijeka, Croatia. ISBN: 978-953-51-0067-6. [ Links ]
Sáenz-Navajas, M., Campo, E., Fernández-Zurbano, P., Valentin, D. & Ferriera, V. 2010. An assessment of the effects of wine volatiles on the perception of taste and astringency in wine. Food Chem. 121, 1139-1149. [ Links ]
Sahin, S. & Sammu, S.G. 2006. Physical properties of foods. Technology and Engineering. P. 167, Springerlink, New York, USA. [ Links ]
Sokolowsky, M., Rosenberger, A. & Fischer, U. 2015. Sensory impact of skin contact on white wines characterized by descriptive analysis, time- intensity analysis and temporal dominance of sensations analysis. Food Qual. Pref. 39, 285-297. [ Links ]
Swiegers, J.H & Pretorius, I.S. 2005. Yeast modulation of wine flavour. J. Appl. Microbiol. 57, 131-175. [ Links ]
Tabilo-Munizaga, G., Gordon, T.A., Villabos-Carjaval, R., Moreno-Osorio, L., Salazar, F.N., Pérez-Won, M. & Acuna, S. 2014. Effects of high hydrostatic pressure (HHP) on the protein structure and thermal stability of Sauvignon blanc wine. Food Chem. 155, 214-220. [ Links ]
Van Wyk, J. & Britz, T.J. 2012. A rapid high-performance liquid chromatography (HPLC) method for the extraction and quantification of folates in dairy products and cultures of Propionibacterium freudenreichii. Afr. J. Biotechnol. 11, 2087-2098. [ Links ]
Wills, R. B. H., Scriven, F. M. and Greenfield, H. (1983), Nutrient composition of stone fruit (Prunus spp.) cultivars: Apricot, cherry, nectarine, peach and plum. J. Sci. Food Agric. 34, 1383-1389. [ Links ]
Submitted for publication: June 2016
Accepted for publication: September 2016
Acknowledgements: The authors would like to thank Cape Peninsula University of Technology and Western Cape Department of Agriculture for the dedicated efforts and financial support. We would additionally like to thank ARC Infruitec-Nietvoorbij for technical support, for the use of the experimental wine cellars and providing fruit throughout the study.
* Corresponding author: E-mail address: garethw@elsenburg.com
