


Serviços Personalizados
Artigo
 Inglês (pdf)
 Artigo em XML
 Referências do artigo
Indicadores

Links relacionados
-
 Citado por Google
 -
 Similares em Google
Compartilhar

 Permalink
South African Journal of Enology and Viticulture
versão On-line ISSN 2224-7904
versão impressa ISSN 0253-939X
S. Afr. J. Enol. Vitic. vol.37 no.2 Stellenbosch 2016
ORIGINAL RESEARCH ARTICLES
Effect of irrigation using diluted winery wastewater on Vitis vinifera L. cv. Cabernet sauvignon in a sandy alluvial soil in the Breede River Valley - Vegetative growth, yield and wine quality
C.L. HowellI, *; P.A. MyburghI; E.L. LateganI; C. SchoemanII; J.E. HoffmanIII
IARC Infruitec-Nietvooibij, Private Bag X5026, 7599, Stellenbosch, South Africa
IIDepartment of Viticulture and Oenology, Stellenbosch University, Private Bag X1, Matieland 7602
IIIDepartment of Soil Science, Stellenbosch University, Private Bag X1, Matieland 7602
ABSTRACT
The re-use of winery wastewater for irrigation was investigated in a field trial with micro-sprinkler-irrigated Cabernet Sauvignon/99Richter in the Breede River Valley region of South Africa. Irrigation with winery wastewater diluted with river water to 100, 250, 500, 1 000, 1 500, 2 000, 2 500 and 3 000 mg/L chemical oxygen demand (COD) was compared to irrigation with river water. Under the prevailing conditions, plant water status did not respond to irrigation using diluted winery wastewater. Leaf and shoot element contents did not respond consistently to irrigation using diluted winery wastewater. There were no differences in vegetative growth or yield or juice characteristics, with the exception of juice pH. Consequently, water use and water status of the grapevines also were not affected. The results indicate that a summer interception crop may increase the evapotranspiration of vineyards substantially. The irrigation of grapevines using diluted winery wastewater did not have detrimental effects on wine colour and sensory wine characteristics, and the grapevines did not respond to the COD level per se. This indicates that sufficient aeration occurred between irrigations, which allowed organic carbon breakdown. The low salinity and sodicity levels in the diluted winery wastewater could be a further explanation of why the grapevines did not respond to the wastewater irrigation. In heavier soils, regions with lower winter rainfall, situations where the winery wastewater contains more potassium or where no interception crop is cultivated during summer, grapevine responses may be more pronounced.
Key words: Chemical oxygen demand, grapevines, off-flavours, water quality, wine
INTRODUCTION
Although wineries produce large volumes of low-quality wastewater that can contain high levels of organic matter, K+ and Na+, information on the actual volumes produced is extremely limited. Recent studies have shown that c. 3 to 5 m3 of winery wastewater is produced per tonne of grapes crushed (Mosse et al., 2011). The chemical status of winery wastewater is generally worse than the legislated limits for irrigation with wastewater (Department of Water Affairs, 2013). On the other hand, limited irrigation water supplies could be restricted further in future irrigation water allocations (Van Zyl & Weber, 1981; Petrie et al., 2004). Where wineries are surrounded by vineyards, irrigation using diluted winery wastewater could be used instead of water from natural resources. If winery wastewater could be re-used with no detrimental impacts on either grapevines or subsequent wine quality and chemical composition, it could be a possible viable alternative to using either river or recycled municipal water.
Currently, the Department of Water and Sanitation is drafting new General Authorisations for wineries. Depending on the permitted water quality limits and volumes stipulated by the new authorisations, diluting winery wastewater with other irrigation water may well become a more viable practice in the future. Re-using winery wastewater in this way will be beneficial, particularly where there are water shortages. In such situations, re-using winery wastewater will have a positive impact on grape yields if additional irrigation could be applied. Water saving and higher yields will also contribute to the sustainability and economic viability of wine production. In addition to these benefits of re-using diluted winery wastewater for irrigation, the nutrients in the wastewater could reduce the necessity to apply fertilisers and, consequently, reduce the cost of fertilisation (Neilsen et al., 1989a; Kumar et al., 2014). In particular, K+ in winery wastewater could make a meaningful contribution to the annual K+ requirements of the grapevine. Where winery wastewater was diluted on a field scale for vineyard irrigation, additional K+ applied to the vineyard via the diluted winery wastewater ranged, on average, from 6.6 kg/ha/year for the river water control to 177.3 kg/ha/ year where winery wastewater was diluted to 3 000 mg/L chemical oxygen demand (COD) (Howell et al., 2015). Land application of wastewater can increase soluble and exchangeable forms of K+ more rapidly than the application of conventional, inorganic fertilisers, and most of the K+ is available immediately (Arienzo et al., 2009). Although it appears that the N load in diluted winery wastewater would be inadequate to supply the grapevine's requirement, P and K+ applied via diluted winery wastewater should be adequate for a grape yield of 10 t/ha (Howell et al., 2015). At present, there also is increasing pressure on producers to use water in a more environmentally friendly way.
In the first study of its kind, winery wastewater diluted up to 3 000 mg/L COD did not pose any salinity hazard, since the electrical conductivity (ECiw) of the irrigation water was well below 2 dS/m (Howell et al., 2015). Considering the other classical water quality criteria, viz. pH and sodium adsorption ratio (SAR), dilution of winery wastewater up to 3 000 mg/L COD produced irrigation water of which the quality would permit sustainable vineyard irrigation under the prevailing conditions, viz. Mediterranean climate and sandy soil. Although extensive literature is available regarding the effect of irrigation with wastewaters of various origins on plant responses, much less information is available for fruit trees and grapevines. Where sewage water was used to irrigate grapevines by means of drip irrigation of c. 22 mm water per week from September until March, there was an increase in yield compared to good-quality reservoir water for one season (McCarthy, 1981). The use of sewage water rather than good-quality reservoir water did not affect cane mass. However, when sewage water was used for irrigation, harvest petiole Mg+, Na+ and Cl- increased (McCarthy, 1981). Although wine P, K+ and Mg2 were higher in response to irrigation with sewage water, concentrations were not excessively high (McCarthy & Downton, 1981). In contrast, wine Na+ and Cl- were substantially higher. There were no differences with regard to wine quality. Irrigation with municipal wastewater increased N, P and K+ in apple tree leaves, and increased trunk diameter (Neilsen et al., 1989b). In a similar trial, petiole P, K+ and Ca2+ of Okanagan Riesling grapes increased where municipal wastewater was used for irrigation (Neilsen et al., 1989a). Furthermore, wastewater irrigation increased yield. With regard to sweet cherries, municipal wastewater increased leaf N, P, K+, B3+ and Mn2+, whereas Ca2+ and Mg2+ were reduced (Neilsen et al., 1991). Where table grape vineyards were irrigated with treated wastewater, yield was not affected after six years (Netzer et al., 2014), but petiole Na+ increased substantially. The use of recycled municipal wastewater for irrigation reduced leaf N of Soultanina grapevines, whereas leaf P and K+ increased (Paranychianakis et al., 2006). Yield was also reduced substantially, and this was probably due to a reduction in average leaf area (Paranychianakis et al., 2004).
Although there is extensive literature on the irrigation of grapevines with saline water (Walker et al., 1997; Stevens et al., 1999; Ben-Asher et al., 2006; Stevens et al., 2011), there is no information on the effect of using winery wastewater diluted to a pre-determined COD level on grapevine growth, yield and juice responses. Where "simulated" winery wastewater was used for vineyard irrigation, there were no substantial differences in ripeness parameters, yield and vegetative growth after one year (Mosse et al., 2013). Although high K+ concentrations in artificial wastewater promoted the accumulation of harvest petiole K+, petiole Ca2 was reduced substantially. When artificial wastewater contained organic matter together with high K+ levels, petiole Ca2 was not reduced to the same extent. The use of Na+-based artificial wastewater increased petiole Na+ levels substantially. In a glasshouse study, where winery wastewater was applied either undiluted, or diluted in different ratios, to potted Shiraz grapevines, petiole K+ contents were below the recommended levels, irrespective of the level of dilution (Kumar et al., 2014). In addition to the different levels of winery wastewater dilution, there also were treatments in which solutions of differing K+ and Na+ nutrient loads were used to irrigate grapevines. Increasing K+ concentrations increased petiole K+ (Kumar et al., 2014). The authors concluded that their results indicated that these artificial solutions should not be used to study winery wastewater effects. Regarding field-scale trials, in two paired field trials where grapevines were irrigated with either mains water or winery wastewater there was no difference in the sensorial evaluation of the wines (Kumar et al., 2014). Furthermore, where grapevines were irrigated with winery wastewater, wine Na+ levels were still below 100 mg/L, whereas wine K+ ranged from 1 220 mg/L to 1 400 mg/L, which was within industry norms for red wines in Australia (Kumar et al., 2014).
It has been reported previously that winemakers are reluctant to use winery wastewater for vineyard irrigation due to its high Na+ and K+ (Kumar et al., 2014). Potassium is the predominant cation involved in the pH balance of grape juice and wine, and there is a good relationship between pH and K+ concentration in juice and wine (Kodur, 2011, and references therein). During winemaking, high wine K+ increases the precipitation of tartaric acid, consequently reducing free tartaric acid (Kodur, 2011). Therefore, a high concentration ofK+ in wine makes pH adjustment difficult and expensive (Kumar et al., 2014). High juice K+ can lead to a reduced tartaric/malic acid ratio, which is undesirable for the production of high-quality wines (Mpelasoka et al., 2003). Elevated berry K+ will modify the effect of other cations present and is thought to have an impact on fermentation and microbial activity, as well as on other wine properties such as taste, bitterness and sourness (Boulton, 1980; Kumar et al., 2014). According to Jackson and Lombard (1993), high juice K+ is not only associated with high pH, but also poor colour, of red wines. Although high concentrations of K+ in the soil are correlated with levels in the plant, the effect of soil K+ on juice levels is small, unless excessive K+ is applied. Although the application of wastewater with high K+ levels will increase soil fertility, long-term application may cause an accumulation of soil K+ (Kumar et al., 2014) and decrease the soil's hydraulic conductivity (Arienzo et al., 2009).
The objective of this study was to determine the effect of using diluted winery wastewater rather than river water for vineyard irrigation on grapevine water status, growth, yield and evapotranspiration (ETc), as well as on juice and wine quality characteristics, in order to make recommendations for the refinement of the General Authorisations for wineries.
MATERIALS AND METHODS
Experiment vineyard
The re-use of winery wastewater for irrigation was investigated in a field trial with micro-sprinkler-irrigated Cabernet Sauvignon/99Richter in the Breede River Valley region of South Africa. The locality (33°41' latitude) has a Mediterranean climate. Based on the growing degree days (GDD) from September until March (Winkler, 1962), the specific locality is in a class V climatic region for wine quality potential (Le Roux, 1974). According to the Köppen-Geiger climate classification, the Rawsonville climate is classified as a Csa, which means that the region has a temperate climate with hot, dry summers (Peel et al., 2007). The vineyard was located on an alluvial flood plain of the Du Toitskloof Mountains, with sandy soil of the Longlands form (Soil Classification Working Group, 1991). The soil was deep delved to 1.0 m before planting. Grapevines were planted at 2.4 m χ 1.2 m and trained onto a four-strand lengthened Perold trellis (Booysen et al., 1992). Vertical shoot positioning was carried out to prevent shoots from sprawling into the work rows. An interception crop of Pennisetum glaucum (pearl millet) was cultivated in the work rows in summer. It produced 10.4 ± 0.8, 6.0 ± 1.0 and 6.4 ± 0.9 t/ha dry matter for the 2010/2011, 2011/2012 and 2012/2013 seasons respectively (Fourie & Theron, 2014). A standard winter cover crop of Avena sativa L. cv. Pallinup (oats) was cultivated and produced 5.4 ± 0.3, 4.7 ± 1.0, 6.7 ± 1.2 and 7.5 ± 1.1 t/ha dry matter for the 2009/2010, 2010/2011, 2011/2012 and 2012/2013 seasons respectively.
Experiment layout
Irrigation using winery wastewater diluted to 100, 250, 500, 1 000, 1 500, 2 000, 2 500 and 3 000 mg/L COD respectively, was compared to irrigation using river water abstracted from the Holsloot River. All treatments were replicated three times in a randomised block design. Experiment plots comprised two rows of six grapevines each, with two buffer grapevines at each end and a buffer row on each side. Each experiment plot covered 104 m2. Treatments were applied from 2009/2010 until 2012/2013. In the 2009/2010 season, it was only possible to apply the diluted wastewater treatments after harvest due to delayed completion of the infrastructure. Details of the irrigation infrastructure and dilution procedures (Myburgh et al., 2015), as well as an assessment of the water quality and nutrient load of the diluted winery wastewater, were reported by Howell et al. (2015). On average for the vintage period from February to May, the pH, ECiw and SAR in winery wastewater diluted to 3 000 mg/L was 4.8 ± 0.4, 0.66 ± 0.18 and 2.4 ± 0.5 dS/m respectively. The K+ and Na+ were 119 ± 56 mg/L and 45 ± 9 mg/L respectively. Taking the amounts of irrigation water applied into account, the additional K+ applied to the vineyard via the diluted winery wastewater ranged, on average, from 6.6 kg/ha/year for the river water control, to 177.3 kg/ha/year where winery wastewater was diluted to 3 000 mg/L COD.
Soil water content
The objective was to apply irrigation only within the grapevine root zone, i.e. < 90 cm, in order to prevent leaching to the deeper layers. The soil water content in the experiment vineyard was measured using the neutron scattering technique. Access tubes were installed in the grapevine row in all plots. Soil water content was measured over 30 cm increments to a depth of 1.8 m. A field calibration was carried out to convert neutron counts to volumetric soil water content. Soil water content was measured weekly from October, as well as before and after irrigation. After irrigation stopped in either April or May, soil water content was measured every two weeks throughout the winter.
Grapevine water status
Grapevine water status was quantified by measuring grapevine water potential in mature, unscathed leaves on primary shoots by means of the pressure chamber technique (Scholander et al., 1965), according to the protocol described by Myburgh (2010). Predawn (ΨPD) and midday (ΨL) leaf water potentials, as well as midday stem (ΨS) water potential, were measured in one leaf per plot. For ΨS measurements, leaves were covered in aluminium bags (Choné et al., 2001; Myburgh, 2010) for at least one hour before measurements were carried out. Since the diluted wastewater irrigations only commenced after harvest in 2010, grapevine water status was not determined in the 2009/2010 season. During the 2010/2011 season, ΨPD, and Ψs were measured during berry development (December) and berry ripening (March). During the 2011/2012 and 2012/2013 growing seasons, and were only measured on selected days during berry ripening.
Vegetative growth
Cane mass
To quantify growth vigour, cane mass at pruning (July) was measured per experiment plot using a hanging balance. Shoot mass per plot (kg) was converted to tonnes per hectare.
Leaf and shoot chemical status
In order to allow maximum exposure to the wastewater via the irrigation, leaf samples were collected prior to harvest in the 2010/2011 to 2012/2013 seasons instead of during November (at fruit set), which is the recommended time for grapevine leaf sampling. Thirty mature, unscathed leaves opposite a bunch on the second spur were sampled per plot in accordance with the protocol of Conradie (1994). Petioles were immediately separated from the leaf blade. Due to the high costs of chemical analyses, only leaf blades and shoot samples of replication 2 were analysed. Samples of the other two replications were dried and stored, only to be analysed if replication 2 indicated that the leaf and/or shoot chemical status consistently responded to the level of dilution of the winery wastewater. Shoot samples consisting of four primary canes per plot were collected at pruning in July. All of the samples were dried in a fan oven at 60°C for 24 hours. The dried leaf blade and shoot contents were determined by a commercial laboratory (BEMLAB, Strand). Leaf and shoot N were measured by means of a nitrogen analyser using the methods described by Horneck and Miller (1998). Samples were prepared for the analysis of P, K+, Ca2+, Mg2+, Na+, Mn2+, Fe2+, Cu2+, Zn2+ and B3+ and analysed by means of an ICP-OES spectrometer (PerkinElmer Optima 7300 DV, Waltham, Massachusetts, U.S.A.), using the methods described by Isaac and Johnson (1998).
Yield and its components
To determine berry mass at harvest, ten randomly selected bunches were picked from each experiment plot for all the treatments. Twenty berries were sampled from each of these bunches in order to obtain a sample of 200 berries. Berry mass was determined in the laboratory by weighing the samples using an electronic balance. At harvest, all bunches of the experiment grapevines on each plot were picked and counted. Grapes were weighed using a top loader mechanical balance to obtain the total mass per experiment plot. The number of bunches per grapevine was calculated by dividing the total number of bunches per plot by the number of experimental grapevines per plot. Grape mass per grapevine (kg/grapevine) was calculated and converted to yield (t/ha).
Evapotranspiration
The ETc was determined by calculating the soil water balance on a weekly basis as described by Myburgh and Howell (2007). Monitoring soil water content to 1.8 m showed that almost no deep percolation occurred during the irrigation season. Consequently, drainage losses were not accounted for in the soil water balance equation. Daily ETc was used to calculate mean monthly values.
Juice characteristics
Grape samples were collected at harvest from all experiment plots and analysed for total soluble solids (TSS), total titratable acidity (TTA) and pH according to the standard procedures of the winery at the Infruitec-Nietvoorbji Institute of the Agricultural Research Council (ARC) near Stellenbosch. Berries sampled at harvest were crushed gently and the resultant juice was squeezed through cheesecloth. To determine total N, the juice was digested with selenic acid and concentrated sulphuric acid. Total N was then determined by means of a nitrogen analyser using the methods described by Clesceri et al. (1998). To determine P, K+, Ca2+, Mg2+ and Na+, juice samples were digested by adding concentrated nitric acid, allowing it to stand overnight and then adding perchloric acid. Following the nitric acid/perchloric acid digestion, the abovementioned elements were determined using an inductively coupled plasma emission spectrometer (Liberty 200 ICP AES, Varian, Australia).
Wine quality
Grapes were harvested when they reached the target sugar content of 24°B. Four wastewater irrigations were applied prior to harvest in 2010/2011 and 2011/2012, whereas three wastewater irrigations were applied prior to harvest in 2012/2013. Wines were made from the grapes (c. 40 kg) of each experiment plot according to the standard procedure for making red wine used by the experimental winery at the ARC Infruitec-Nietvoorbij, as described by Myburgh (2011b). After six months, the wines were evaluated sensorially by a panel of at least 12 industry experts. In order to determine whether the wines were safe for tasting, i.e. free of harmful bacteria, the wine samples were first analysed for the presence of bacteria by a commercial laboratory (BEMLAB, Strand) in all three seasons. Wines were evaluated on a 100 mm-long unscaled line for wine colour, overall intensity, vegetative character, berry character, spicy character, acidity, body, astringency and overall quality. The panel was also asked to give an indication of the occurrence of off-flavours (off-odours and off-tastes) and any other atypical red wine characteristics. Following tasting, the alcohol, extract, residual sugar, glucose, fructose, volatile acidity, tartaric acid, malic acid, total acidity and pH of the wines were analysed by a commercial laboratory (Koelenhof Winery, Stellenbosch) as described by Schoeman (2012). The ion composition of the wine was analysed using the same procedure as described above for the juice.
Statistical analyses
The data were subjected to an analysis of variance, using STATGRAPHICS®. Least significant difference (LSD) values were calculated to facilitate comparison between treatment means. Means that differed at p < 0.05 were considered to be significantly different.
RESULTS AND DISCUSSION
Soil water content
During the four seasons, irrigation using diluted winery wastewater had no effect on the soil water status compared to irrigation using river water. Therefore, only trends in the mean soil water content for each season will be presented and discussed.
2009/2010 season
When the fieldwork commenced, the vineyard was drip irrigated once a week for 12 hours from the end of November until February, when the micro-sprinkler system was installed. Since the grower applied the drip irrigation according to a continuous deficit strategy, the soil was relatively dry at that stage (data not shown). Consequently, the objective of the first micro-sprinkler irrigation was to wet the total soil volume thoroughly using river water. Since the infrastructure was only completed at the end of January 2010, irrigation using diluted winery wastewater only commenced after the grapes had been picked. Three irrigations were applied during the post-harvest period. Due to late ripening of the 2010 harvest, the winery was still crushing grapes when the first two irrigations were applied. The relatively high soil water content indicated that most layers were still saturated when the soil water content was measured shortly after the irrigation was stopped. However, the soil water content in the 150 to 180 cm layer only showed an increase six days later (data not shown). This indicated that percolation from the saturated shallower soil layers into the deep layer must have occurred in the first few days following the irrigation. Smaller irrigations, viz. approximately 55 mm each, were applied when the wastewater treatments commenced. These irrigations only wetted the soil to a depth of c. 90 cm, and the soil water content measurements showed that no percolation occurred into the deeper layers. As a result, the soil water content in the deepest layers remained fairly constant in the period following the first irrigation. The day after the third irrigation was applied in May, there was 85 mm of rainfall. The combined effect of the irrigation and the rainfall saturated the upper soil layers to such an extent that deep percolation substantially increased the soil water content in the deepest layers.
2010/2011 season
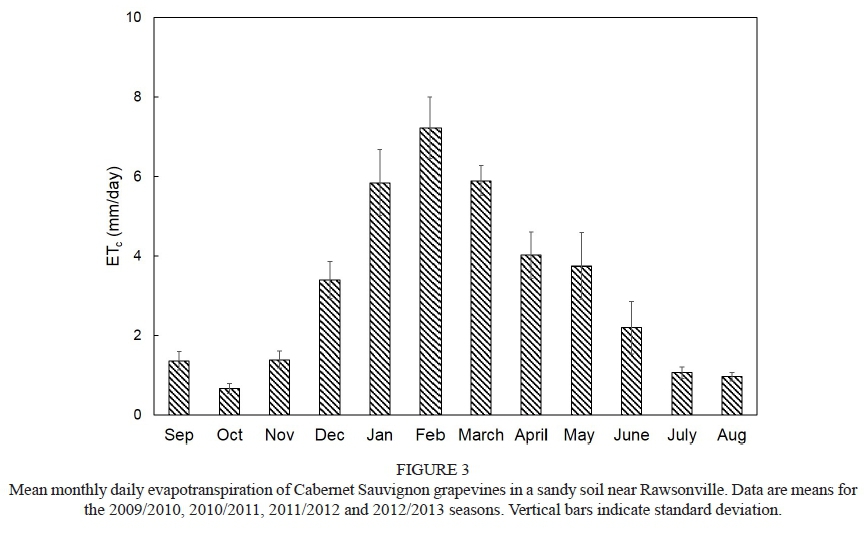
Due to the relatively low winter rainfall in 2010, the soil was relatively dry at bud break in September (Fig. 1A). Despite the relatively dry soil conditions, grapevine vegetative growth did not show any visual signs of water constraints, and the first irrigation was only applied in December 2010. The first of the six wastewater irrigations was applied on 201102-09. The wastewater irrigations were applied at c. 14-day intervals. Although the objective was to apply irrigations to the root zone only, rainfall in May (94 mm), June (150 mm) and July (56 mm) seemed to have caused percolation into the deeper layers (Fig. 1A). When established in November 2010, the pearl millet interception crop increased the ETc to 1.7, 3.5, 8.1 and 9.4 mm/day for November, December, January and February respectively. In contrast, the ETc was 0.9, 2.1, 5.2 and 7.2 mm/day for the preceding November, December, January and February respectively.
2011/2012 season
Due to the winter rains in 2011, the soil was relatively wet at bud break in September (Fig. 1B). The first river water irrigation was only applied in the middle of December 2011, The second river water irrigation was required early in January 2012, followed by three weekly river water irrigations of 16 mm each for the pearl millet summer interception crop. The grapevines were irrigated twice with river water in February 2012. Since inadequate volumes of suitable winery wastewater were produced in February, the first of the five wastewater irrigations could only be applied on 6 March. The wastewater irrigations were applied at c. 14-day intervals. Since the pearl millet was established only in January 2012, ETc for January and February was lower compared to that in the 2010/2011 season. In the 2011/2012 season, when the pearl millet was sown later, viz. in January 2012, the ETc was 5.9 and 6.5 mm/day for January and February 2012 respectively. In contrast, the ETc was 8.1 and 9.4 mm/day for the preceding January and February respectively. These results confirmed that a summer interception crop established earlier in the season, e.g. in November, will increase the ETc of vineyards substantially compared to clean-cultivated or mulched soil surfaces.
2012/2013 season
Due to the winter rains during 2012, the soil was relatively wet at bud break in September (Fig. 1C) and the first river water irrigation was only applied towards the end of December 2012. In early January 2013, river water irrigation was applied to facilitate soil cultivation for planting of the pearl millet summer crop, and was followed by three weekly river water irrigations of 16 mm each for this crop. The second river water irrigation for the vineyard was applied in early February 2013. The first of the six wastewater irrigations was applied on 14 February, and thereafter these irrigations were applied at c. 14-day intervals until the end of April. Irrigation was applied only to the upper soil layers, i.e. 0 to 60 cm depth, to prevent leaching of the elements into the deeper layers. In addition, such a continuous deficit irrigation strategy would reduce excessive growth and enhance ripening. However, a rainfall event of 67 mm after the wastewater irrigation in mid-April probably leached elements into the deeper layers. It was evident that the continuous deficit irrigation strategy also reduced ETc from 5.9 mm/day in January 2012 to 4.2 mm/day in January 2013. Furthermore, the pearl millet interception crop did not increase ETc substantially during the ripening period. In May 2013, river water irrigation was applied to the oats cover crop.
Vegetative growth
Grapevine water status
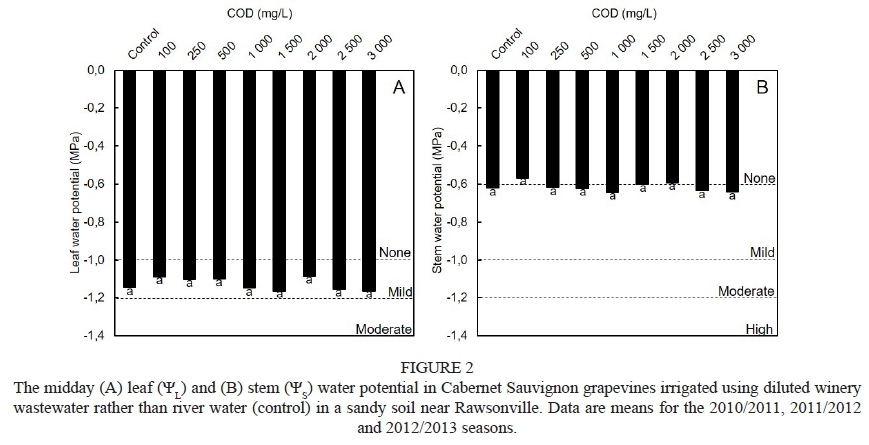
Measurements in the 2010/2011 season showed that was c. -0.2 MPa (data not shown), which is the lower threshold for no water constraints (Deloire et al., 2004). This confirmed that the water status of the grapevines was able to fully recover during the night under the prevailing conditions. During daytime, the grapevines only experienced low water constraints, viz. mean ranged between -1.0 MPa and -1.2 MPa (Fig. 2A), i.e. the thresholds according to Greenspan (2005). The low daytime water constraints were substantiated by mean that ranged between -0.6 MPa and -1.0 MPa (Fig. 2B), which are the thresholds proposed by Van Leeuwen et al. (2009). The foregoing indicated that the grapevines only experienced low water constraints. Furthermore, irrigation using diluted winery wastewater, regardless of level of dilution, clearly had no effect on the grapevine water status compared to grapevines irrigated using river water. This was to be expected, since winery wastewater diluted up to 3 000 mg/L COD has an ECiw well below 2 dS/m (Howell et al., 2015). Furthermore, the pH and SAR of 3 000 mg/L COD diluted winery wastewater produced irrigation water of which the quality would permit sustainable vineyard irrigation under the prevailing conditions. Since the irrigation of grapevines using diluted winery wastewater, irrespective of dilution level, did not induce any grapevine water constraints, it can be assumed that the functioning of other physiological processes would not have been negatively affected by water deficits. Given the low levels of water constraints, poor wine quality would be expected (Lategan, 2011).
Leaf and shoot chemical status
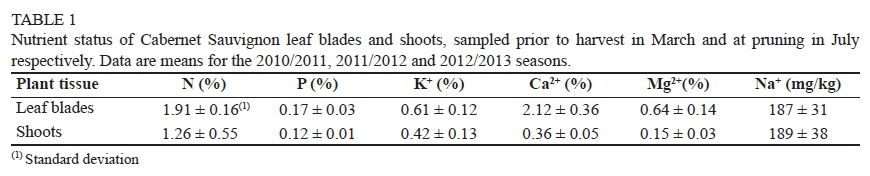
Since leaf blade and shoot samples of only replication 2 were analysed, only the standard deviation from the mean is presented in Table 1. According to norms for grapevine nutrient levels in leaves (Conradie, 1994), viz. 1.6% to 2.7% for N, 0.14% to 0.55% for P, 0.65% to 1.3% for K+, 1.2% to 2.2% for Ca2+, and 0.16% to 0.55% for Mg2+, none of the macro-elements were at deficient levels during any of the seasons, except for low K+ in 2012/2013. The latter was probably due to competition from the pearl millet interception crop in the summer. Otherwise, the pearl millet interception crop and oats combination in winter did not seem to have any negative effects on grapevine nutrient status under the prevailing conditions. In addition, the nutrient levels were also not excessively high. This indicates that the additional amounts of elements applied via the diluted winery wastewater, in particular K+ and Na+, were not taken up by the grapevine to such an extent that negative effects could be expected. There were no trends in N and P that could be related to the different levels of wastewater dilution (data not shown). This was probably due to N and P loads in the diluted winery wastewater being inadequate to supply the grapevine's annual requirement (Howell et al., 2015).
Although soil Bray II-K increased substantially in the 0 to 30 cm as well as 30 to 60 cm soil depth layer, and the increase was strongly related to the additional amounts of K+ applied via the diluted winery wastewater (Myburgh & Howell, 2014), there were no substantial differences in the mean leaf blade K+ measured prior to harvest. Similarly, even though soil K+ increased substantially where 2 t/ha K2SO4 was applied (Dundon & Smart, 1984), i.e. 800 to 880 kg/ha K+, there were no consistent responses in petiole contents at flowering (Dundon et al., 1984). Since most of the K+ uptake by the grapevine takes place prior to véraison, with almost no uptake from five weeks after harvest (Conradie, 1981), it could be that the additional K+ was applied too late in the growing season to have had an impact on leaf K+ uptake. It has been shown that leaf K+ becomes less from véraison to harvest, after which it increases (Conradie, 1981). High K+ concentrations in "simulated" wastewater promoted the accumulation of harvest petiole K+ (Mosse et al., 2013). However, in that particular study, grapevines were irrigated with the artificial wastewater in the pre-véraison period as well. Where Shiraz grapevines were irrigated with winery wastewater at different dilutions, petiole K+ was not affected, whereas the use of undiluted winery wastewater for vineyard irrigation increased petiole K+ (Kumar et al., 2014). Excessive levels of K+ applied to Concord grapevines, i.e. 450 kg/ha, increased petiole K+ substantially (Morris & Cawthon, 1982). Where no K+ and either 225 kg K+, 450 kg K+ or 900 kg K+ per ha was applied to Concord grapevines, petiole K+ already responded in the first year of the study (Morris et al., 1980). Even though substantially less K+ fertiliser was applied, increasing K+ fertiliser from 0 kg to 90 kg increased both leaf blade and petiole K+ (Conradie & Saayman, 1989). Seyval blanc grapevines growing in four nutrient solutions with different K+ concentrations showed an increase in petiole K+ (Wolf et al., 1983).
In general, mean leaf Ca2 tended to decrease with a decrease in wastewater dilution (data not shown). The decrease in leaf blade Ca2+ could be related to the increase in the amount of K+ applied via the diluted winery wastewater up to harvest. Therefore, it seems that there was a K+-induced suppression of Ca2 absorption. A similar response was observed where high K+ concentrations in artificial wastewater reduced harvest petiole Ca2 substantially (Mosse et al., 2013). However, when the artificial wastewater contained organic matter together with high K+ levels, petiole Ca2 was not reduced to the same extent. Since leaf blade Ca2 of grapevines irrigated using winery wastewater diluted to 3 000 mg/L COD (T9) was still substantially higher (data not shown) than the minimum norm for Ca2 recommended by Conradie (1994), the reduction in Ca2+ did not reduce leaf Ca2+ to insufficient levels. Where excessive levels of K+, viz. 450 kg/ha, were applied to Concord grapevines, there was a reduction in petiole Ca2 (Morris & Cawthon, 1982). When no K+ and either 225 kg K+, 450 kg K+ or 900 kg K+ perha were applied to Concord grapevines, petiole Ca2 did not respond in the first year (Morris et al., 1980). However, there was a reduction in petiole Ca2+ over a five-year period. For Seyval blanc grapevines growing in four nutrient solutions, an increase in the solution K+ from 0 mg/L to 235 mg/L increased petiole Ca2+ (Wolf et al., 1983). However, a further increase in the K+ concentration to 700 mg/L reduced petiole Ca2. It seemed that leaf blade Ca2 tended to be more sensitive than petiole Ca2, with a reduction in Ca2 as K+ application increased (Conradie & Saayman, 1989). In addition to the K+/Ca2 antagonism, it could also be that the leaf blade Ca2 levels in the present study decreased due to Na+/Ca2+ antagonism (Prior et al., 1992; Garcia & Charbaji, 1993; Fisarakis et al., 2005).
Mean leaf blade Mg2+ tended to decrease with a decrease in the dilution level of the winery wastewater (data not shown). This indicates a possible K+-induced suppression of Mg2+ absorption (Saayman, 1981). Similar results were reported by Morris et al. (1980), where grapevines were fertilised with excessive amounts of K+. Large applications of K+ have been known to reduce Mg2+ to deficiency levels (Morris & Cawthon, 1982, and references therein), and it is possible that a K+-induced Mg2+ deficiency could develop from the continued use of high levels of K+ (Morris et al., 1980). Where Seyval blanc grapevines were growing in four nutrient solutions, petiole Mg2 decreased in response to increasing K+ (Wolf et al., 1983). Likewise, when 45 kg K+ was applied per ha compared to no K+, leaf blade and petiole Mg2+ decreased (Conradie & Saayman, 1989). However, increasing K+ from 45 kg/ha to 90 kg/ha did not induce further Mg2 reductions. Although substantial amounts of Na+ were applied via the diluted winery wastewater in the current study, leaf blade Na+ contents were well below 0.25%, i.e. the maximum for grapevines (Conradie, 1994), thereby reflecting the low sodicity risk of the diluted winery wastewater under the prevailing conditions. In contrast, the use of Na+-based artificial wastewater in Shiraz grapevines increased petiole Na+ levels substantially (Mosse et al., 2013). Taking all three seasons into consideration, there were no pronounced effects of the diluted winery wastewater irrigation treatments on the chemical composition of the shoots compared to the effects of the river water control.
Cane mass
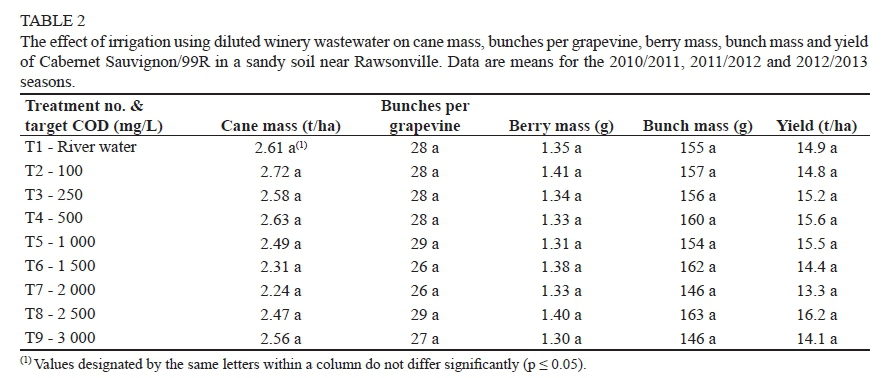
Irrigation using diluted winery wastewater had no effect on the mean vegetative growth of the grapevines compared to river water (Table 2). This was to be expected, since irrigation using diluted winery wastewater did not affect grapevine water status or the chemical status of the leaves and shoots, as discussed above. In addition, the N load in the diluted winery wastewater was totally inadequate to supply the grapevine's N requirement, and therefore to enhance vegetative growth to levels above that of the control (Howell et al., 2015). The results therefore confirmed that, under the prevailing conditions, winery wastewater diluted up to 3 000 mg/L COD does not pose any salinity hazard to grapevine growth. Where artificial winery wastewater was used for vineyard irrigation, there were no differences in cane length and diameter at harvest (Mosse et al., 2013). Similarly, the use of sewage water rather than good-quality reservoir water for vineyard irrigation did not affect cane mass (McCarthy, 1981). Cane mass was slightly higher in the 2011/2012 season compared to the 2010/2011 season, but comparable to the 2009/2010 season (data not shown). In the 2012/2013 season, cane mass was slightly higher compared to the 2010/2011 season, but comparable to the values reported for the 2009/2010 and 2011/2012 seasons (data not shown). Cane mass was comparable to values reported for Cabernet Sauvignon in the Breede River Valley (Roux, 2005) and Lower Olifants River Valley (Bruwer, 2010) but was substantially higher than that of non-irrigated grapevines in the Swartland region (Mehmel, 2010). The foregoing suggest that the interception crop did not seem to have a pronounced negative effect on grapevine vegetative growth.
Yield and its components
Irrigation using diluted winery wastewater did not affect mean grapevine fertility, i.e. the number of bunches per grapevine (Table 2). In the 2010/2011 and 2011/2012 seasons, berry development in the selected treatments showed the typical double sigmoid curve expected for grapes, and diluted winery wastewater irrigation had no effect on berry size development, regardless of level of dilution (Schoeman, 2012). This was probably due to a lack of differences in grapevine water status (Table 2). Irrigation using diluted winery wastewater had no effect on berry mass at harvest compared to the river water control (Table 2). Although Mosse et al. (2013) observed some differences in berry weight at harvest where different artificial winery wastewaters were used for vineyard irrigation for a year, these differences were very small and no concrete conclusions could be drawn. In contrast, the use of undiluted winery wastewater for vineyard irrigation in Angaston consistently reduced berry weight substantially (Kumar et al., 2014). However, in a similar study at Oxford Landing by the same researchers, the use of winery wastewater had no detrimental effect on berry size. In this particular case, it could have been that the quality of the winery wastewater differed between the two sites. Furthermore, it should be noted that the amounts of irrigation water applied to the vineyard were substantially greater where winery wastewater was used (Kumar et al., 2014). Mean berry mass at harvest (Table 2) was comparable to values reported for drip-irrigated Cabernet Sauvignon in the Breede River Valley (Roux, 2005). Where Cabernet is subjected to severe water constraints, viz. below 1.6 MPa, berry mass is expected to be c. 1 g/berry (Bruwer, 2010; Mehmel, 2010). The foregoing confirms that the grapevines experienced low levels of water constraints, and irrigation with diluted winery wastewater did not have an effect on bunch mass compared to the river water control (Table 2). This was to be expected, since there were no differences in number of bunches per grapevine, as well as in berry mass (Table 2).
Irrigation using diluted winery wastewater did not affect grapevine yield compared to the river water control (Table 2). As in the case of cane mass, the results confirm that winery wastewater diluted up to 3 000 mg/L COD does not pose any salinity hazard to grape yield. Furthermore, considering the other classical water quality criteria, such as pH and SAR, the dilution of winery wastewater up to 3 000 mg/L COD produced irrigation water of which the quality would permit sustainable vineyard irrigation under the prevailing conditions, i.e. Mediterranean climate with high winter rainfall and sandy soil. Although Mosse et al. (2013) observed some differences in yield with regard to different types of artificial winery wastewater, the magnitude of these differences was very small. It should be noted, however, that the application of the artificial wastewater took place for only one year. Mean yield in the 2010/2011 season was lower compared to that in 2009/2010 (data not shown). Lower grapevine fertility in the region, as well as the severe pruning, probably caused the generally lower yields in the 2010/2011 season. During the other seasons, yield was comparable to the c. 15 t/ha reported for irrigated Cabernet Sauvignon (Roux, 2005), but substantially higher than non-irrigated Cabernet Sauvignon (Mehmel, 2010).
Evapotranspiration
Since irrigation using diluted winery wastewater did not affect soil water status or grapevine growth and yield compared to river water irrigation, there were no differences in daily vineyard ETc between treatments (data not shown). Under the prevailing conditions, mean daily vineyard ETc (Fig. 3) was comparable to that of micro-sprinkler-irrigated Pinotage near Robertson in the Breede River valley (Myburgh, 2011a), except in January and February 2011 (data not shown). Following sowing in November 2010, the vegetative growth of the pearl millet interception crop was extremely vigorous and, at full canopy cover, the pearl millet was almost as tall as the grapevine canopies. This indicated that the interception crop increased the vineyard ETc from November until February compared to the same period in the other seasons. The ETc declined considerably in March 2011, i.e. after the interception crop had been slashed and removed. In the 2011/2012 season, when the pearl millet was sown later, viz. in January 2012, ETc during January and February was lower compared to the 2010/2011 season. When the diluted wastewater was applied in the 2012/2013 season, i.e. when the continuous deficit irrigation strategy was followed, vineyard ETc was slightly lower compared to the other years. It must be noted that the continuous deficit irrigation did not have any negative effects on grapevine yield under micro-sprinklers compared to the other seasons. This was in contrast to yield reductions where continuous deficit irrigation was applied to drip-irrigated Shiraz grapevines in the Breede River valley (Lategan, 2011).
Juice characteristics
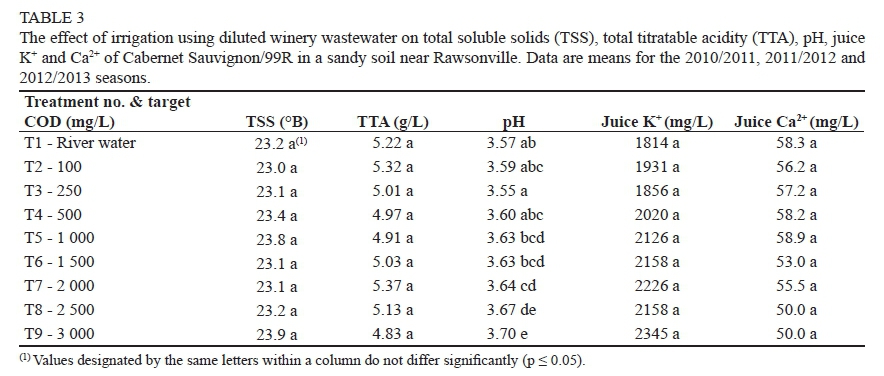
In 2010/2011 and 2011/2012, sugar loading into the berries and acid breakdown during ripening were not affected by irrigation using diluted winery wastewater compared to the river water (Schoeman, 2012). The fact that the rate of berry ripening on all treatment plots was comparable to the river water control indicated that the winery wastewater had no effect on the physiological functioning of the grapevines, irrespective of the level of dilution. Consequently, there were no differences in the mean juice TSS and TTA at harvest (Table 3). The mean juice pH increased with a decrease in the level of dilution (Table 3) and could be linearly related to the mean amounts of K+ applied via the irrigation water until harvest, as well as to mean juice K+. Likewise, when juice K+ increased due to K+ fertilisation, juice pH also increased (Morris et al., 1980; Morris & Cawthon 1982). Even when 900 kg/ha K was applied to grapevines, the highest value reported for juice pH was 3.57 (Morris et al., 1980).
In general, juice N, P, K+, Ca2, Mg2 and Na+ were within the recommended levels (Wooldridge et al., 2010). Irrigation using diluted winery wastewater generally did not affect mean juice N and P compared to the river water control (data not shown). Juice K+ tended to be higher when the level of dilution of the winery wastewater was lower, i.e. more K+ was applied via the diluted winery wastewater (Table 3). Likewise, there was also a tendency to higher juice K+ where undiluted winery wastewater was used for vineyard irrigation (Kumar et al., 2014). It has also been reported that artificial winery wastewaters containing high K+ levels and wine produced juice with the lowest K+ compared to wastewaters with high Na+ and high K+ (Mosse et al., 2013).
This indicated that the presence of wine in the artificial winery wastewater prevented an increase in juice K+. In a study investigating the long-term use of K+ fertiliser, juice K+ increased when 45 kg K+ was applied per ha compared to no K+ (Conradie & Saayman, 1989). However, there were no further increases in juice K+ when the K+ application increased to 90 kg/ha. Another study indicated that, when 450 kg/ha K+ was applied to grapevines, there was an increase in juice K+ (Morris & Cawthon, 1982). Juice K+ of Concord grapevines also increased when K+ application increased from no application to 225 kg K+, 450 kg K+ or 900 kg K+ per ha (Morris et al., 1980). In contrast, there tended to be a reduction in mean juice Ca2 with a decrease in the dilution of the winery wastewater (Table 3). Lower juice Ca2+ could be due to a K+/Ca2 antagonism, as discussed previously for the leaf blades. There were no consistent trends with regard to juice Na+ (data not shown). In contrast, juice Na+ was higher at harvest where Na+-based wastewater was used compared to artificial winery wastewaters with high and low K+ respectively (Mosse et al., 2013). Unfortunately, no data pertaining to juice Ca+ was given.
Wine quality
None of the experimental wines contained pathogenic bacteria and they therefore were considered safe for the sensorial evaluation (data not shown). Therefore, the results confirm that the wines would not pose a health risk to consumers. Although juice pH increased linearly with increasing amounts of K+ applied until harvest, it did not reflect in wine colour (Fig. 4A). This is probably because juice pH tended to be below 3.8, the norm above which detrimental effects of pH on wine colour, taste and microbial stability may be expected (Kodur, 2011, and references therein). Wine vegetative and berry character was not affected by the use of diluted winery wastewater for irrigation (Figs 4B & 4C). All the wines tended to have a stronger berry-like character than spicy character, consistent with Cabernet Sauvignon wine made from grapes produced in warmer localities, such as in Klawer in the Lower Olifants River region (Bruwer, 2010). There were no differences in wastewater-associated off-odours and off-tastes compared to the river water control (Figs 4D & 4E), thereby confirming that no contaminants were transferred from the wastewater into the wines. This was expected, since visual observations revealed that the bunches were not wetted with diluted winery wastewater during irrigation. Perusal of the scorecards also revealed that members of the tasting panel were highly inconsistent with respect to their perception of off-tastes. The observed offodours and off-tastes were all related to frequently occurring off-odours and off-tastes in wines, such as volatile acidity and bitterness. However, in a parallel study where bunches were deliberately sprayed with diluted winery wastewater, a winery wastewater-like odour was detected in the wines, and their spicy character was reduced (Schoeman, 2012). This highlights the importance of avoiding contact between grapes and winery wastewater. All the wines were of low quality, i.e. less than 40% (Fig. 4F). This trend was to be expected, since the grapevines did not experience any water constraints during the season. Irrigation using diluted winery wastewater did not affect wine quality (Fig. 4F). Likewise, although there were slight differences with regard to wine colour and tannin content where winery wastewater was used for vineyard irrigation, there were no differences in the sensorial evaluation of the wines (Kumar et al., 2014). Where Shiraz grapevines were irrigated with sewage water, there also were no differences with regard to wine quality (McCarthy & Downton, 1981).
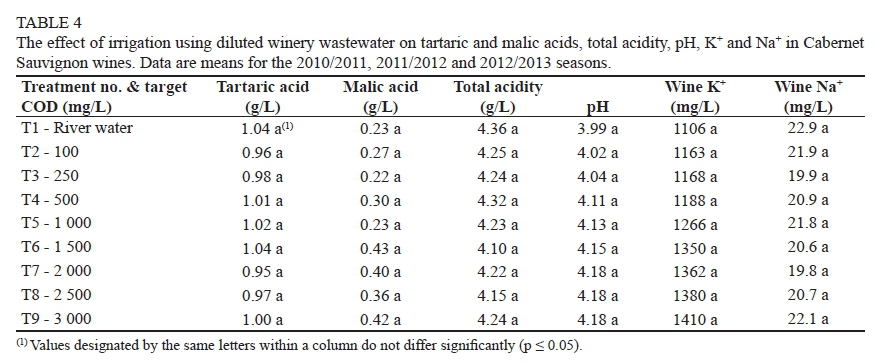
The tartaric acid in the wine did not show any consistent trend with regard to the wastewater treatments (Table 4). There was a trend towards increased malic acid with an increase in the COD level of the diluted winery wastewater (Table 4). This was probably due to higher juice K+, which may decrease the rate of degradation of malic acid through respiration by impeding its transfer from the vacuole to the cytoplasm (Kodur, 2011). It should be noted that berry K+ levels are often an important consideration for red wine production, as the skin is left for some time after crushing for the extraction of anions, during which time more K+ may be extracted (Mpelasoka et al., 2003). However, in the present study, berry skin K+ was not measured and it is possible that the berry skin K+ could have increased in response to the irrigation with diluted winery wastewater. Although wine pH tended to increase with a decrease in the level of dilution (Table 4), the pH increase did not have any negative effect on wine colour as determined both chemically and sensorially. In a study carried out in Robertson, Moolman et al. (1998) reported wine Na+ contents that ranged from 40 mg/L to 190 mg/L. Much higher values were reported for Na+ in Australian Shiraz wine, with values that ranged from 78 mg/L to 533 mg/L (Walker et al., 2003). In the current study, wine Na+ was much lower than these reported levels (Table 4). Furthermore, the legal limit for wine Na+ in South Africa is 100 mg/L (Department of Water Affairs & Forestry, 1996). Wine Na+ was considerably lower than this norm in all the seasons. Therefore, under the prevailing conditions, wines produced where grapevines were irrigated with diluted winery wastewater still conformed to statutory requirements with regards to Na+ content. Moolman et al. (1998) reported wine Cl- that ranged from 50 mg/L to 160 mg/L, whereas much higher values of 98 mg/L to 1 788 mg/L were reported for Shiraz in Australia (Walker et al., 2003). The Australian legal limit for wine Cl- content is 606 mg/L (Leske et al., 1997). Based on this norm, the Cl- contents in the wines were extremely low (data not shown). There were no consistent trends in wine ion composition with respect to the different levels of dilution with winery wastewater, with the exception of wine K+, which tended to increase with a decrease in the dilution level of the winery wastewater (Table 4). Although wine P, K+ and Mg2 were higher in response to irrigation with sewage water, concentrations were not excessively high (McCarthy & Downton, 1981). In contrast, wine Na+ and Cl- were substantially higher where sewage water was used for vineyard irrigation. Although Walker and Blackmore (2012) reported a positive linear relationship for wine K+ and juice K+ for two cultivars, the relationship was not 1:1. The R2 values ranged between 0.80 and 0.86, with the slope of the relationship ranging from 0.40 to 0.89. In the present study, the R2 value for the relationship between mean wine K+ and juice K+ was 0.60, with the slope of the particular relationship being 0.44.
CONCLUSIONS
The irrigation of grapevines using winery wastewater diluted up to a maximum COD level of 3 000 mg/L did not affect the vegetative growth or any of the yield components compared to the river water control. Consequently, the water use and water status of the grapevines were not affected by the wastewater irrigation under the prevailing conditions. The grapevines did not respond to level of COD per se. This indicates that sufficient aeration occurred between irrigations that allowed organic carbon breakdown. Although salinity and sodicity levels in the diluted winery wastewater were below the thresholds at which growth and yield reductions are expected for grapevines, they should be monitored frequently. The low salinity and sodicity levels in the diluted winery wastewater could be a further explanation of why the grapevines did not respond negatively to the wastewater irrigation. Since the vegetative growth and yield of the grapevines were comparable to responses previously reported for vineyards without a summer interception crop, the results suggest that the grapevines were not affected by the pearl millet growing in the work rows during summer. Visual observations revealed that the root system of this interception crop was shallow compared to that of the grapevines. Therefore, the competition for water and nutrients was probably not strong enough to have induced negative effects on grapevine growth and yield. However, a summer interception crop may increase the ETc of vineyards substantially if growing conditions are favourable for the particular crop. The contribution of the slash and removal costs to the already high production costs of vineyards is a further aspect that needs consideration. The results show that the irrigation of grapevines using winery wastewater diluted up to 3 000 mg/L COD did not have detrimental effects on juice characteristics with regard to ripeness parameters and ion content, with the exception of juice pH. Wine sensorial quality was not affected. Under the conditions of the study, the relatively large irrigation volumes applied during berry ripening resulted in poor wine quality. Since wine quality is an important aspect, particularly if wine needs to be exported, the generally poor quality is of great concern. However, there is ample evidence that less frequent irrigation, which allows higher levels of plant available water (PAW) depletion between irrigations, will enhance wine quality. This implies that the winery wastewater will probably have to be applied over large areas to obtain sufficient PAW depletion between irrigations. The distribution of winery wastewater over large areas will need additional, expensive infrastructure. Although the study shows that wine sensorial characteristics were not affected, off-odour due to direct contact with winery wastewater may reduce wine quality. The correct choice of irrigation system, e.g. micro-sprinklers or drippers, can eliminate this potential risk. While winery wastewater quality can differ widely between wineries, the results of this study provide baseline information for the irrigation of vineyards using diluted winery wastewater. In heavier soils, regions with lower winter rainfall, situations where more K+ is applied via diluted winery wastewater or where no interception crop is cultivated during summer, the responses with respect to leaf, shoot, juice and wine contents may be more pronounced and consistent. Under the prevailing conditions, it appears that the General Authorisation for wineries could be revised to permit irrigation using diluted winery wastewater up to 3 000 mg/L COD for grapevines growing in a sandy soil.
LITERATURE CITED
Arienzo, M., Christen, E.W., Quayle, W. & Kumar, A., 2009. A review of the fate of potassium in the soil-plant system after land application of wastewaters. J. Hazard. Mater. 164, 415-422. [ Links ]
Ben-Asher, J., Tsuyuki, I., Bravdo, B. & Sagih, M., 2006. Irrigation of grapevines with saline water. I. Leaf area index, stomatal conductance, transpiration and photosynthesis. Agr. Water Manage. 83, 13-21. [ Links ]
Booysen, J.H., Steenkamp, J. & Archer, E., 1992. Names of vertical trellis systems (with abbreviations). Wynboer September, 15. [ Links ]
Boulton, R., 1980. The general relationship between potassium, sodium and pH in grape juice and wine. Am. J. Enol. Vitic. 31, 182-186. [ Links ]
Bruwer, R.J., 2010. The edaphic and climatic effects on production and wine quality of Cabernet Sauvignon in the Lower Olifants River region. Thesis, Stellenbosch University, Private Bag X1, 7602 Matieland (Stellenbosch), South Africa. [ Links ]
Choné, X., Van Leeuwen, C., Durbourdieu, D. & Gaudillére, J.P., 2001. Stem water potential is a sensitive indicator of grapevine water status. Ann. Bot. 87, 477-483. [ Links ]
Clesceri, L.S., Greenberg, A.E. & Eaton, A.D., 1998 (20th ed.). Standard methods for the examination of water and wastewater. Am. Public Health Association, Washington DC. [ Links ]
Conradie, W.J., 1981. Seasonal uptake of nutrients by Chenin blanc in sand culture: II. Phosphorus, potassium, calcium and magnesium. S. Afr. J. Enol. Vitic. 2, 7-13. [ Links ]
Conradie, W.J., 1994. Vineyard fertilisation. Proceedings of workshop on vineyard fertilization. Nietvoorbij, 30 September 1994. ARC Infruitec-Nietvoorbij, Private Bag X5026, 7599 Stellenbosch, South Africa. [ Links ]
Conradie, W.J. & Saayman, D., 1989. Effects of long-term nitrogen, phosphorous, and potassium fertilization on Chenin blanc vines. II. Leaf analyses and grape composition. Am. J. Enol. Vitic. 40, 91-96. [ Links ]
Deloire, A., Carbonneau, A., Wang, Z. & Ojeda, H., 2004. Vine and water: A short review. J. Int. Sci. Vigne Vin 38, 1-13. [ Links ]
Department of Water Affairs, 2013. Revision of general authorisations in terms of Section 39 of the National Water Act, 1998 (Act No. 36 of 1998), No. 665. Government Gazette No. 36820, 6 September 2013. Dept. Water Affairs, Pretoria, South Africa. pp. 3 - 31. [ Links ]
Department of Water Affairs and Forestry, 1996. South African water quality guidelines. Vol. 4. Agricultural use: Irrigation. CSIR Environmental Services. Department of Water Affairs and Forestry, Pretoria, South Africa. [ Links ]
Dundon, C.G. & Smart, R.E., 1984. Effects of water relations on the potassium status of Shiraz grapevines. Am. J. Enol. Vitic. 35, 40-45. [ Links ]
Dundon, C.G., Smart, R.E. & McCarthy, M.G., 1984. The effect ofpotassium fertilizer on must and wine potassium levels of Shiraz grapevines. Am. J. Enol. Vitic. 35, 200-205. [ Links ]
Fisarakis, I., Nikolaou, N., Tsikalas, P., Therios, I. & Stavrakas, D., 2005. Effect of salinity and rootstock on concentration of potassium, calcium, magnesium, phosphorous, and nitrate-nitrogen in Thompson seedless grapevine. J. Plant Nutr. 27, 2117-2134. [ Links ]
Fourie, J.C. & Theron, H., 2014. Chapter 5: Effect of irrigation with winery wastewater diluted to different COD levels on the performance of two grass cover crop species and their ability to function as an interception crop. In: Myburgh, P.A. & Howell, C.L. (eds). The impact of wastewater irrigation by wineries on soils, crop growth and product quality. WRC Report No. 1881/14. Water Research Commission. Private Bag X103, Gezina, Pretoria, 0031. [ Links ]
Garcia, M. & Charbaji, T., 1993. Effect of sodium chloride salinity on cation equilibria in grapevine. J. Plant Nutr. 16, 2225-2237. [ Links ]
Greenspan, M., 2005. Integrated irrigation of California winegrapes. Prac. Vineyard & Winery March/April, 21-79. [ Links ]
Horneck, D.A. & Miller, R.O., 1998. Determination total nitrogen in plant tissue. In: Kalra, Y.P. (ed.). Handbook of reference methods for plant analysis. CRC Press, Boca Raton. pp. 81 - 83. [ Links ]
Howell, C.L., Myburgh, P.A., Lategan, E.L. & Hoffman, J.E., 2015. An assessment of winery wastewater diluted for irrigation of grapevines in the Breede River Valley with respect to water quality and nutrient load. S. Afr. J. Enol. Vitic. 36, 413-425. [ Links ]
Isaac, R.A. & Johnson, W.C., 1998. Elemental determination by inductively coupled plasma. In: Kalra, Y.P. (ed.). Handbook of reference methods for plant analysis. CRC Press, Boca Raton. pp. 165 - 170. [ Links ]
Jackson, D.I. & Lombard, P.B., 1993. Environmental and management practices affecting grape composition and wine quality - A review. Am. J. Enol. Vitic. 44, 409-430. [ Links ]
Kodur, S., 2011. Effects of juice pH and potassium on juice and wine quality, and regulation of potassium in grapevines through rootstocks (Vitis): A short review. Vitis 50, 1-6. [ Links ]
Kumar, A., Rengasamy, P., Smith, L., Doan, H., Gonzago, D., Gregg, A., Lath, S., Oats, D. & Correl, R., 2014. Sustainable recycled winery water irrigation based on treatment fit for purpose approach. Report CSL1002. Grape and Wine Research Development Corporation/CSIRO Land and Water Science, Adelaide, Australia. [ Links ]
Lategan, E.L., 2011. Determining of optimum irrigation schedules for drip irrigated Shiraz vineyards in the Breede River Valley. Thesis, Stellenbosch University, Private Bag X1, 7602 Matieland (Stellenbosch), South Africa. [ Links ]
Le Roux, E.G., 1974. A climate classification for the South Western Cape viticultural areas (in Afrikaans). Thesis, Stellenbosch University, Private Bag X1, 7602 Matieland (Stellenbosch), South Africa. [ Links ]
Leske, P.A., Sas, A.N.N., Coulter, A.D., Stockley, C.S. & Lee, T.H., 1997. The composition of Australian grape juice: Chloride, sodium and sulfate ions. Aust. J. Grape Wine Res. 3, 26-30. [ Links ]
McCarthy, M.G., 1981. Irrigation of grapevines with sewage effluent. I. Effects on yield and petiole composition. Am. J. Enol. Vitic. 32, 189-196. [ Links ]
McCarthy, M.G. & Downton, W.J.S., 1981. Irrigation of grapevines with sewage effluent. II. Effects on wine composition and quality. Am. J. Enol. Vitic. 32, 197-199. [ Links ]
Mehmel, T.O., 2010. Effect of climate and soil water status on Cabernet Sauvignon (Vitis vinifera L.) grapevines in the Swartland region with special reference to sugar loading and anthocyanin biosynthesis. Thesis, Stellenbosch University, Private Bag X1, 7602 Matieland (Stellenbosch), South Africa. [ Links ]
Moolman, J.H., De Clercq, W.P., Wessels, W.P.J., Meiri, A. & Moolman, C.G., 1998. The use of saline water for irrigation of grapevines and the development of crop salt tolerance indices. WRC Report No 303/1/00. Water Research Commission. Private Bag X103, Gezina, Pretoria, 0031. [ Links ]
Morris, J.B. & Cawthon, D.L., 1982. Effects of irrigation, fruit load, and potassium fertilization on yield, quality, and petiole analysis of Concord (Vitis labrusca L.) grapes. Am. J. Enol. Vitic. 33,145-148. [ Links ]
Morris, J.B., Cawthon, D.L. & Fleming, J.W., 1980. Effects of high rates of potassium fertilization on raw product quality and changes in pH and acidity during storage of Concord grape juice. Am. J. Enol. Vitic. 31,323-328. [ Links ]
Mosse, K.P.M., Lee, J., Leachman, B.T., Parikh, S.J., Cavagnaro, T.R., Patti, A.F. & Steenworth, K.L., 2013. Irrigation of an established vineyard with winery cleaning agent solution (simulated winery wastewater): vine growth, berry quality, and soil chemistry. Agr. Water Manage. 123, 93-102. [ Links ]
Mosse, K.P.M., Patti, A.F., Christen, E.W. & Cavagnaro, T.R., 2011. Review: Winery wastewater quality and treatment options in Australia. Aust. J. Grape Wine Res. 17, 111-122. [ Links ]
Mpelasoka, B, Schachtman, D.P., Treeby, M.T. & Thomas, M.R., 2003. A review of potassium nutrition in grapevines with special emphasis on berry accumulation. Aust. J. Grape Wine Res. 9, 154-168. [ Links ]
Myburgh, P.A., 2010. Practical guidelines for the measurement of water potential in grapevine leaves. Wynboer Technical Yearbook 2010, 11-13. [ Links ]
Myburgh, P.A., 2011a. Possible adjustments to irrigation strategy and trellis system to improve water use efficiency of vineyards (Part 1): Evapotranspiration and crop coefficients. Wynboer Technical Yearbook 2011, 6-8. [ Links ]
Myburgh, P.A., 2011b. Response of Vitis vinifera L. cv. Merlot to low frequency drip irrigation and partial root zone drying in the Western Cape Coastal Region - Part II. Vegetative growth, yield and quality. S. Afr. J. Enol. Vitic. 32, 104-116. [ Links ]
Myburgh, P.A. & Howell, C.L., 2007. Evapotranspiration of Vitis vinifera L. cvs. Sunred Seedless and Muscat Supreme in response to soil water depletion and irrigation cutoff during berry ripening. S. Afr. J. Plant Soil 24, 209-213. [ Links ]
Myburgh, P.A. & Howell, C.L., 2014. Chapter 4: Effect of irrigation with augmented winery wastewater on soil chemical status. In: Myburgh, P.A. & Howell, C.L. (eds). The impact of wastewater irrigation by wineries on soils, crop growth and product quality. WRC Report No. 1881/14. Water Research Commission. Private Bag X103, Gezina, Pretoria, 0031. [ Links ]
Myburgh, P.A., Lategan, E.L. & Howell, C.L., 2015. Infrastructure for irrigation of grapevines with diluted winery wastewater in a field trial. Water SA 41, 643-647. [ Links ]
Neilsen, G.H., Stevenson, D.S. & Fitzpatrick, J.J., 1989a. The effect of municipal wastewater irrigation and rate of fertilization on petiole composition, yield and quality of Okanagan Riesling grapes. Can. J. Plant Sci. 69, 1285-1294. [ Links ]
Neilsen, G.H., Stevenson, D.S., Fitzpatrick, J.J. & Brownlee, C.H., 1989b. Nutrition and yield of young apple trees irrigated with municipal waste water. J. Amer. Soc. Hort. Sci. 114, 377-383. [ Links ]
Neilsen, G.H., Stevenson, D.S., Fitzpatrick, J.J. & Brownlee, C.H., 1991. Soil and sweet cherry responses to irrigation with wastewater. Can. J. Soil Sci. 71, 31-41. [ Links ]
Netzer, Y., Shenker, M. & Schwartz, A., 2014. Effects of irrigation using treated wastewater on table grape vineyards: Dynamics of sodium accumulation in soil and plant. Irrig. Sci. 32, 283-294. [ Links ]
Paranychianakis, N.V., Aggelides, S. & Angelakis, A.N., 2004. Influence of rootstock, irrigation level and recycled water on growth and yield of Soultanina grapevines. Agr. Water Manage. 69, 13-27. [ Links ]
Paranychianakis, N.V., Nikolantonakis, M., Spanakis, Y. & Angelakis, A.N., 2006. The effect of recycled water on the nutrient status of Soultanina grapevines grafted on different rootstocks. Agr. Water Manage. 81, 185-198. [ Links ]
Peel, M.C., Finlayson, B.L. & McMahon, T.A., 2007. Updated world map of the Koppen-Geiger climate classification. Hydrol. Earth Syst. Sci. 11, 1633-1644. [ Links ]
Petrie, P.R., Cooley, N.M. & Clingeleffer, P.R., 2004. The effect of postvéraison water deficit on yield components and maturation of irrigated Shiraz (Vitis vinifera L.) in the current and following season. Aust. J. Grape Wine Res. 10, 203-215. [ Links ]
Prior, L.D., Grieve, A.M. & Cullis, B.R., 1992. Sodium chloride and soil texture interactions in irrigated field grown Sultana grapevines. II. Plant mineral content, growth and physiology. Aust. J. Agric. Res. 43, 1067-1083. [ Links ]
Roux, F.A., 2005. The influence of specific soil and climate parameters on vineyard performance, wine quality and character (in Afrikaans). Thesis, Stellenbosch University, Private Bag X1, 7602 Matieland (Stellenbosch), South Africa. [ Links ]
Saayman, D., 1981. Wingerdvoeding. In: Burger, J.D. & Deist, J. (eds). Wingerdbou in Suid-Afrika. ARC Infruitec-Nietvoorbij, Private Bag X5026 Stellenbosch 7599 South Africa. pp. 343 - 383. [ Links ]
Schoeman, C., 2012. Grape and wine quality of V. vinifera L. cv. Cabernet Sauvignon/99R in response to irrigation using winery wastewater. Thesis, Stellenbosch University, Private Bag X1, Matieland 7602, South Africa. [ Links ]
Scholander, P.F., Hammel, H.T., Bradstreet, E.D. & Hemmingsen, E.A., 1965. Sap pressure in vascular plants. Science 148, 339-346. [ Links ]
Soil Classification Working Group, 1991. Soil classification - A taxonomic system for South Africa. Memoirs on natural resources of South Africa no. 15. Dept. Agric. Developm., Private Bag X116, 0001 Pretoria, South Africa. [ Links ]
Stevens, R.M., Harvey, G. & Partington, D.L., 2011. Irrigation of grapevines with saline water at different growth stages: Effects on leaf, wood and juice composition. Aust. J. Grape Wine Res. 17, 239-248. [ Links ]
Stevens, R.M., Harvey, G., Partington, D.L. & Coombe, B. G., 1999. Irrigation of grapevines with saline water at different growth stages. 1. Effects on soil, vegetative growth and yield. Aust. J. Agric. Res. 50, 343355. [ Links ]
Van Leeuwen, C., Tregoat, O., Choné, X., Bois, B., Pernet, D. & Gaudillère, J.P., 2009. Vine water status is a key factor in grape ripening and vintage quality for red Bordeaux wine. How can it be assessed for vineyard management purposes? J. Int. Sci. Vigne Vin 43, 121-134. [ Links ]
Van Zyl, J.L. & Weber, H.W., 1981. The effect of various supplementary irrigation treatments on plant and soil moisture relationships in a vineyard (Vitis vinifera var. Chenin blancj. S. Afr. J. Enol. Vitic. 2, 83-99. [ Links ]
Walker, R.R. & Blackmore, D.H., 2012. Potassium concentration and pH inter-relationships in grape juice and wine of Chardonnay and Shiraz from a range of rootstocks in different environments. Aust. J. Grape Wine Res. 3, 66-74. [ Links ]
Walker, R.R., Blackmore, D.H., Clingeleffer, P.R., Godden, P., Francis, L., Valente, P. & Robinson, E., 2003. Salinity effects on vines and wines. Bulletin O.I.V. 76, 201-227. [ Links ]
Walker, R.R., Blackmore, D.H., Clingeleffer, P.R. & Iacono, F., 1997. Effect of salinity and Ramsey rootstock on ion concentrations and carbon dioxide assimilation in leaves of drip-irrigated field-grown grapevines (Vitis vinifera L. cv. Sultana). Aust. J. Grape Wine Res. 3, 66-74. [ Links ]
Winkler, A.J., 1962. General viticulture. University of California Press, Los Angeles. [ Links ]
Wolf, T.K., Heaseler, C.W. & Bergman, E.L., 1983. Growth and foliar elemental composition of Seyvel blanc grapevines as affected by four nutrient solution concentration of nitrogen, potassium and magnesium. Am. J. Enol. Vitic. 34, 271-277. [ Links ]
Wooldridge, J., Louw., P.J.E. & Conradie, W.J., 2010. Effect of rootstock on grapevine performance, petiole and must composition, and overall wine score of Vitis vinifera. Chardonnay and Pinot noir. S. Afr. J. Enol. Vitic. 31, 45-48. [ Links ]
Submitted for publication: June 2016
Accepted for publication: September 2016
Acknowledgements: The project was initiated and funded by the Water Research Commission, and co-funded by Winetech, THRIP TP 1208066038 and the Agricultural Research Council. The authors would like to thank Goudini Winery, for permission to work at the winery and in their vineyard, as well as for the grapes used for samples and winemaking. Messrs Willie and Daniël Botha are thanked for managing the vineyard and for their general assistance. We also thank the staff of the Soil and Water Science Division at ARC Infruitec-Nietvoorbij for technical support.
Any opinions, findings and conclusions or recommendations expressed in any publication generated through THRIP-supported research are those of the author(s) and therefore the NRF/THRIP will not accept any liability in that regard.
* Corresponding author: E-mail address: howellc@arc.agric.za
1 The Fruit, Vine and Wine Institute of the Agricultural Research Council
