


Services on Demand
Article
 English (pdf)
 Article in xml format
 Article references
Indicators

Related links
-
 Cited by Google
 -
 Similars in Google
Share

 Permalink
South African Journal of Enology and Viticulture
On-line version ISSN 2224-7904
Print version ISSN 0253-939X
S. Afr. J. Enol. Vitic. vol.37 n.1 Stellenbosch 2016
Quantitative investigation of leaf photosynthetic pigments during annual biological cycle of Vitis vinifera L. Table Grape Cultivars
R.V. FilimonI, *; L. RotaruI; R.M. FilimonII
IUniversity of Agricultural Sciences and Veterinary Medicine Iasj, Iasj, 700490, Romania
IIResearch Development Station for Viticulture and Vindikation, Iasi, 700489, Romania
ABSTRACT
Variations in chlorophyll a/b and chlorophyll/carotenoid ratios are indicators of senescence, stress or damage to the photosynthetic apparatus and affect the normal course of plant biological processes. The aim of this work was to investigate the chlorophyll (a and b) and carotenoid content and ratios in the leaves of four Vitis vinifera L. table grape cultivars in the main phenophases of the annual biological cycle. During the annual cycle, the moisture content of the leaves decreased significantly (up to 21%), along with a reduction in leaf area and perimeter. Chlorophyll a and b showed a continuous accumulation until grape véraison, with lower values of the Chl a/b ratio at the beginning of the vegetative period. Carotenoids continued their biosynthesis until grape ripening (for another 30 days), at which stage there was a significant decrease in the chlorophyll/carotenoid ratio (2.62 ± 0.31). At véraison, peroxidase had the most intense activity (0.20 to 0.51 U/mg), possibly because of involvement in chlorophyll degradation, while total phenolic content started to decrease. Grape véraison could be regarded as the starting point of foliage senescence. Moreover, the relationship between total chlorophyll (by extraction) and chlorophyll content index (non-destructive method) was very significant (R2 = 0.92). These results contribute to a better understanding of foliar pigment dynamics and the timing of their decline in order to define the behaviour of table grape cultivars during the annual biological cycle.
Key words: Chlorophyll, carotenoids, peroxidase, leaf senescence, non-destructive method
INTRODUCTION
The annual life cycle of grapevines is a process that takes place in the vineyard each year, beginning with bud burst in the spring and culminating with leaf fall in autumn, followed by winter dormancy (Creasy & Creasy, 2009). The annual life cycle comprises all morphological and biological changes with a periodic character through which the grapevine passes in a calendar year. These changes are called phenological stages (phenophases) and have a specific starting and ending time and a hereditary character (Wang et al., 2014). The occurrence and duration of phenological phases is influenced by climatic factors, and it should be noted that, under the same climatic conditions, the annual life cycle varies by cultivar (Jones & Davis, 2000). In the temperate continental climate, the annual cycle of grapevines lasts about 160 to 220 days.
Chlorophylls (Chl) are probably the most important organic compounds on earth, as they are required for photosynthesis (Davies, 2004; Willows, 2004). Photosynthesis in plants is dependent upon capturing light energy in the pigment chlorophyll, and in particular chlorophyll a (Blankenship, 2014). Photosynthetic activity is a very intense process (5 to 11 μmol CO2/m2/s) that provides all the organic material needed for the growth and life activity of the plant (Popescu & Popescu, 2014). This is why photosynthesising cells have to contain large amounts of assimilatory pigments (up to 5% of total dry solids; Rabinowitch & Govindjee, 1969). In most species, the photosynthetic pigment content of the leaves provides valuable insight into the physiological performance of plants (Sims & Gamon, 2002). Moreover, the assessment of photosynthetic pigments, and consequently their relationships, is an important indicator of leaf senescence (Netto et al., 2005).
Chlorophyll is a bright green natural pigment found in all photosynthetic plants, allowing them to absorb energy from light (Hörtensteiner & Kräutler, 2011). Forms a and b are the major types of chlorophyll that predominate in the chloroplasts of all higher plants (Willows, 2004; Raven et al., 2005). Most analytical studies have reported the total chlorophyll contents as the sum of Chl a and Chl b (Lanfer Marquez & Sinnecker, 2008). On the other hand, carotenoids are a large group of deeply red or yellow lipophilic accessory pigments (Pfander, 1992). Carotenoids are found in all photosynthetic organisms, being involved in photosystem assembly, and contribute to light harvesting by absorbing light energy in a region of the visible spectrum where chlorophyll absorption is lower and by transferring the energy to chlorophyll (Britton, 2008). Also, carotenoids provide protection from excess light, free-radical detoxification and limiting damage to membranes (Cuttriss & Pogson, 2004).
Variation in the Chl a/b and Chl/Car ratios is often used as an indicator of senescence, stress or damage to the photosynthetic apparatus (Merzlyak et al., 1999; Gitelson et al., 2009; Fassnacht et al., 2015). The Chl and Car content of V. vinifera L. leaves varied within large limits, depending on cultivar, environmental factors and phenophase (Mendes-Pinto et al., 2005; Gitelson et al., 2009).
V. vinifera L. is a hardy vine adapted to full sun or part shade, native to western Asia and Europe between 30 and 50°N (Keller, 2010; Warren, 2013). Willows (2004) and Mittal et al. (2011) reported that the Chl a/b ratio varies between 2.0 to 2.8 for shade-adapted plants and 3.5 to 4.9 for plants adapted to sunny conditions. According to Gross (1991), Chl a is the major pigment in mature leaves and Chl b is an accessory pigment, and they exist in a ratio of approximately 3 to 1. In V. vinifera L. leaves, the Chl a/b ratio is maximum at the beginning of the vegetative period, reaching 3/1, and decreases during grape ripening, while the Chl/Car ratio may reach 4/1 (Keller, 2010).
Chlorophyll loss is associated with environmental stress, and the variation in total Chl/Car ratio may be a good indicator of stress in plants (Netto et al., 2005). Very low or high temperatures in the growth environment may be detrimental to various metabolic processes, including Chl formation (Markwell et al., 1986). Lisar et al. (2012) found that water stress inhibits chlorophyll synthesis, while carotenoids are less sensitive. In the leaves of C3-type plants, high temperatures led to a decrease in the Chl a/b and Chl/Car ratios (Aien et al., 2011). In parallel, the cultivar influences the accumulation of photosynthetic pigments through the morphological and anatomical particularities of the leaves: area, perimeter, and thickness of mesophyll (Salem-Fnayou et al., 2011). The size (area) of the leaf blade is a crucial parameter, as it determines photosynthetic activity. It is affected by the structure of the vine, training and trellising system, and even microclimate (Bodor et al., 2013).
There has always been a need for methods that measure the in situ properties of plants. Ideally, these methods should be non-destructive so that they do not impair the plant and permit the retesting of the properties over time. In our research, leaf chlorophyll content was determined by two independent methods: spectrophotometry (acetone extraction) and using an OptiSciences CCM-200 plus chlorophyll content meter (non-destructive method), with the aim of comparing the results. The conventional extraction of leaf chlorophyll with acetone or similar organic solvents is laborious, time consuming and always destructive, requiring tissue extraction and spectrophotometric measurement (Lichtenthaler, 1987; Biber, 2007). Previous research conducted on different species showed significant linear correlation of total chlorophyll (by spectrophotometry) and chlorophyll content index (CCI) values, although with large differences in terms of data correlation (Van den Berg & Perkins, 2004; Ghasemi et al., 2011; Khaleghi et al., 2012; Callejas et al., 2013). The lack of a more consistent relationship between total chlorophyll by extraction and CCI values (non-destructive) for different V. vinifera L. genotypes and in different phenophases limits the potential use of the CCM-200 plus instrument for this specie (Filimon et al., 2014).
Several studies concluded that peroxidases can catalyse the type II degradation of chlorophyll ("bleaching") as an alternative route for chlorophyll biodegradation (Hynninen et al., 2010). Peroxidases (E.C. 1.11.1.7) are widely distributed in plants (chloroplasts, vacuoles and cell walls), where they catalyse the reduction of hydrogen peroxide (H2O2) to water (Bania & Mahanta, 2012). According to Yamauchi et al. (2004), during the lifespan of the leaf, peroxidases oxidize the phenolic compounds (mainly the ones that have the hydroxyl group at the p-position) to form the phenoxy radicals and superoxide anions that attack chlorophyll, which is subsequently degraded to colourless low-molecular-weight compounds. On the other hand, Hörtensteiner and Kräutler (2011) concluded that peroxidative or photooxidative activities, suggested to be active in Chl breakdown, are irrelevant in vivo. However, the mechanism of chlorophyll degradation through phenolic compound oxidation by peroxidase is still unclear.
To date, little has been published on the changes in foliar pigment during the annual cycle of plants. The aim of this paper was to investigate the chlorophyll (a and b) and carotenoid content and ratios in the leaves of four Vitis vinifera L. table grape cultivars in the main phenological stages of the plants. In parallel, the purpose of this study was to compare the chlorophyll content of vine leaves determined through destructive and non-destructive methods and to provide relevant clues regarding photosynthetic pigment degradation.
Given the importance of chlorophylls and carotenoids in plant processes, and the signals transmitted by their variation, the relationships that occur in their accumulation and degradation must be assessed and understood. Data also contribute to a better understanding of the behaviour of V. vinifera L. table grape cultivars during the annual cycle, and to a lesser extent to defining their agrobiological characteristics.
MATERIALS AND METHODS
Plant material and growth conditions
Research was carried out on the leaves of four new Romanian Vitis vinifera L. table grape cultivars: Gelu (obtained from free fecundation of Coarnă neagră seeds irradiated with X-rays), Milcov (Coarnä neagră x Muscat de Hamburg), Cetăţuia (Crămposie x Frumoasă x Ghioroc) and Napoca [Alphonse Lavallée x (Regina viilor x Muscat de Hamburg)], growing in the Ampelographic Collection of the University of Agricultural Sciences and Veterinary Medicine Iasj, in north-eastern Romania. Grapevines were 15 years old and grafted onto the hybrid rootstock Kober 5 BB (V. berlandieri Planch. χ V. riparia Michx.). Planting distances were 2.2 m between rows and 1.2 m between plants, with a half-high training system (trunk of 0.7 to 0.8 m), a bilateral cordon, and with pruning in fructification rings providing an average load of 40 to 45 buds/vine. The rootstock, trellising system and vine management were the same for all four cultivars. The plants were not irrigated or fertilised. Soil maintenance was "black field" (rows without weeds or other cultures) and technological operations were specific to industrial vineyard systems (manual pruning and harvesting/mechanised spraying, mowing, trimming, tillage when necessary). Cultivars were grouped in one plot, one row after another (about 180 plants for each row). The plot was planted on a slight slope (3%), with southern exposure.
Sample collection
Leaf samples were harvested manually in the morning (9:00) from five plants of average vigour and kept on ice layers (polystyrene boxes). Plants sampled were marked for resampling. Ten normal leaves per plant were collected from the current season's shoots randomly selected from both sides of the vine stock. Except for bud burst, when the leaves were harvested from the node below the apex, sampling was done from the middle third of the shoots, where the ampelographic and age variability of leaves was the least (Rotaru, 2009). Leaves collected were clean, with the petiole attached and with no visible signs of disease or other damage. Leaf samples were transported to the laboratory on ice within 10 minutes and frozen (-80°C). A part of the fresh sample (five leaves per cultivar) was used for scanning (biometrical features) and gravimetric analysis.
The sampling dates were set according to the phenological stage classifications proposed by Baggiolini (1952) and Eichhorn and Lorenz (1977): bud burst (50% of buds at Baggiolini's stage D; Eichhorn & Lorenz stage 07), shoot growth (Baggiolini's stage F; Eichhorn & Lorenz stage 12), flowering (50% of flowers at the "anthesis", Baggiolini's stage I; Eichhorn & Lorenz stage 23), fruit set (Baggiolini's stage K; Eichhorn & Lorenz stage 31), véraison (50% of berries starting to ripen, Baggiolini's stage M; Eichhorn & Lorenz stage 35), grape harvest (Baggiolini's stage N; Eichhorn & Lorenz stage 38) and leaf fall (Baggiolini's stage P; Eichhorn & Lorenz stage 43).
Climatic data
Main microclimatic parameters were measured hourly (air temperature, soil temperature and air humidity) or daily (rainfall and sunshine duration) by means of a weather station and AgroExpert® software located near the experimental plot (15 to 20 m from the sampled plants). Data analysis showed that the winter of 2014 was thermally normal, with average temperatures in January and February very close to the multiannual ones (-2.0°C compared to the 30-year average value of -2.2°C in January, and -1.1°C compared to -0.9°C in February). In March and April, average temperatures higher than the multiannual values were recorded, with 3.6°C and 0.6°C respectively. The highest air and soil temperature was in August, during the early stages of grape maturation (34.2°C and 57.7°C, respectively). September was slightly warmer than the multiannual values (15.6°C), but did not exceed 17.5°C. In 2014, rainfall was distributed irregularly, so there were months with small amounts, like February and September, and months when large amounts of precipitation were recorded, such as in May (99.6 mm) and July (121.7 mm). The amount of rainfall during the growing season was 377.1 mm (30-year average 398.1 mm). Air relative humidity was comparable to the 30-year average (56 to 91%) and sunshine duration was higher in August and September, at 282.4 and 246.0 hours, respectively.
Values of the air temperature, soil temperature and air humidity were registered at sampling time ("the sampling window") for further correlation.
Standard analysis
Leaf moisture (%), total dry solids (%) and total mineral content (%) were determined on fresh leaves according to the International Organisation of Vine and Wine [OIV] (2012). Leaf area, length, width and perimeter were measured with a portable ADC BioScientific® AM 300 area meter (nondestructive method). Measurements were made optically using a simple scanning process. Both the measurements and the scanned shape were stored in the instrument memory and transferred to a computer.
Extraction and measurements of photosynthetic pigments
Frozen leaf samples (0.5 g) were ground in a mortar using sieved inert sand (Merck, Germany) as grinding aid. Ten mL of 99.92% acetone (Chemical Co., Romania) was used to extract the pigments from the leaf tissue, according to the protocol presented by Lichtenthaler and Buschmann (2001). Solid residues were additionally washed with 10 mL of acetone 99.92%. The extracts were added together and placed in the refrigerator (6 ± 1°C) overnight to complete the extraction (Biber, 2007). A small amount (0.5 mg) of MgO (> 40%; Sigma-Aldrich, USA) was added during extraction to neutralise the plant acids that cause the formation of pheophytin a (Lichtenthaler & Buschmann, 2001).
After centrifugation (refrigerated centrifuge Nahita® 2816 model; 3 min, 12 000 rpm), the supernatant was transferred into a 10 mm optical path length quartz cuvette (Hellma®, made of Quartz Suprasil®). The analytical determinations were conducted using an UV-vis Shimadzu 1700 Pharmaspec® spectrophotometer at the following wavelengths: 662 and 645 nm for chlorophyll a and b, and 470 nm for carotenoids (xanthophylls and carotenes), as part of a full scan (400 to 800 nm). Turbidity (haze) was checked by measuring absorbance (optical density) at 710 nm. The chlorophyll (Chl) and carotenoid (Car) content was calculated in mg/g f.w. using the "trichromatic" equations proposed by Lichtenthaler and Buschmann (2001) and improved by the spectranomics protocol of the Carnegie Institution for Science (2011).
Chlorophyll content index
The Chlorophyll content meter, OptiSciences CCM-200 plus, exploits that chlorophyll has certain distinct optical absorbance characteristics. The chlorophyll content index (CCI) represents the ratio between transmittance at 931 nm and 653 nm. One wavelength falls within the chlorophyll absorbance range, while the other serves to compensate for mechanical differences such as tissue thickness. The values are read directly on the device display, after initial calibration. To calibrate the unit or "zero" the instrument, the measuring chamber is closed, making sure that is clear of any material. The chamber is closed until the release arm message is displayed on the screen. Calibration is not required between measurements. CCI values were registered in the field, on the intact leaves considered for extraction, and right before sampling (three measurements for each leaf). The leaves were provided with numbers in order to note which CCI values corresponded to each.
Peroxidase assay
The determination of peroxidase activity was performed according to Bergmeyer (1974). The rate of hydrogen peroxide decomposition by peroxidase, with guaiacol as hydrogen donor, was determined by measuring the rate of colour development at 436 nm (UV-vis Shimadzu 1700 Pharmaspec® spectrophotometer). A peroxidase unit (U) represents the amount of enzyme that catalyses the conversion of one micromole of H2O2 per minute at 25°C.
Polyphenol extraction and quantification
For polyphenol extraction, 0.5 g of leaf was extracted in the dark by maceration with 10 mL of ethanol 0.1% HCl (v/v) overnight at room temperature. The macerate was filtered (Buchner funnel; Whatman no. 1) and the solid residues were also washed with 5 mL of ethanol 0.1% HCl and ultrasonicated (480 sec) (Super RK 31 Bandelin® Sonorex). Fractions were added together. The final fresh weight/solvent ratio was 1:30 (w/v).
The total phenolic compounds (TPC) assay was performed according to the OIV-MA-AS2-10 method (OIV, 2012). All phenolic compounds contained in the extract were oxidised by Folin-Ciocalteu reagent (Scharlab, Spain). The blue colouration had a maximum absorption in the region of 750 nm (UV-vis Shimadzu 1700 Pharmaspec® spectrophotometer), and was proportional to the total quantity of phenolic compounds originally present. A calibration curve using different concentrations of gallic acid solution was used to express the results as gallic acid equivalent (GAE). The conversion equation was: y = 0.8757x + 0.0438, where x is the absorbance at 750 nm and y is TPC g/L gallic acid (R2 = 0.9910).
Statistical analysis
All data were reported as means of a minimum of three replicates, with the standard deviation (±) specified. For the analysis of variance ANOVA, two-factor without replication test (Microsoft® Excel, data analysis tool) was initiated to investigate the statistical significance of the data. The method used to discriminate among the means was Fischer's least significant difference (LSD) procedure. Significant differences are represented in the tables by letters and in the figures by symbols: n.s., *, ** and ***, indicating nonsignificant and significant differences for p-values < 0.05, 0.01 and 0.001, respectively. The partial least squares (PLS) regression method was performed using XLSTAT® software to construct predictive models.
RESULTS AND DISCUSSION
Phenology and climatic data
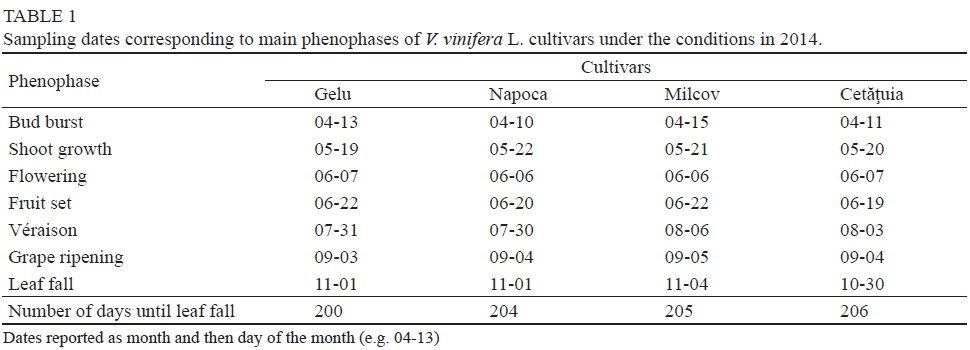
In areas outside the Carpathians, where summer temperatures exceed 30°C and summers are associated with periodical soil and atmospheric drought, table grape cultivars tend to start the vegetative phase very early, along with a shortening of the duration of the phenophase. Table 1 shows the sampling dates set for each phenophase according to the international phenological stage classifications. Under the conditions in 2014, bud burst started between 10 and 15 April - about three days later than the average of the preceding five years. Flowering occurred on the same date for all cultivars studied (2014-06-06 to 2014-06-07). The véraison phenophase started first in Napoca cv., whilst in terms of grape ripening
Gelu cv. was the earliest (2014-09-03). The date of leaf fall was very similar for all cultivars due to the sudden temperature drop that occurs at the end of October. The number of days from bud burst to leaf fall was the most in Cetätuia cv. (206), which was created as a cultivar with an average vegetative period (Rotaru et al., 2010).
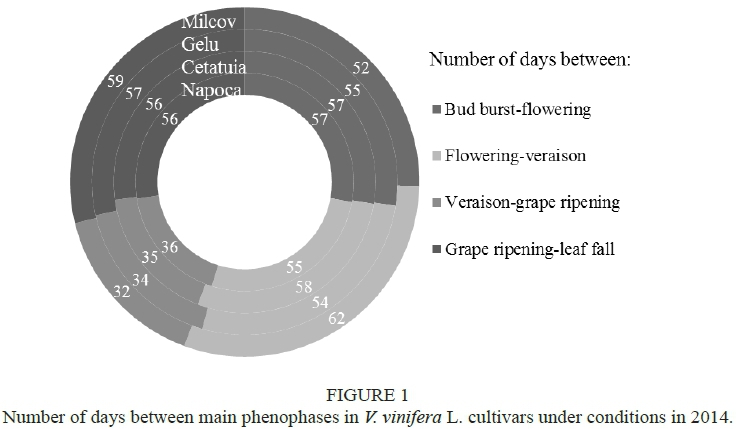
The lowest number of days between two phenological phases was from véraison to grape ripening (32 to 36 days). The interval between bud burst and flowering lasted from 52 to 57 days, while that from flowering to véraison was 55 to 62 days (Fig. 1).
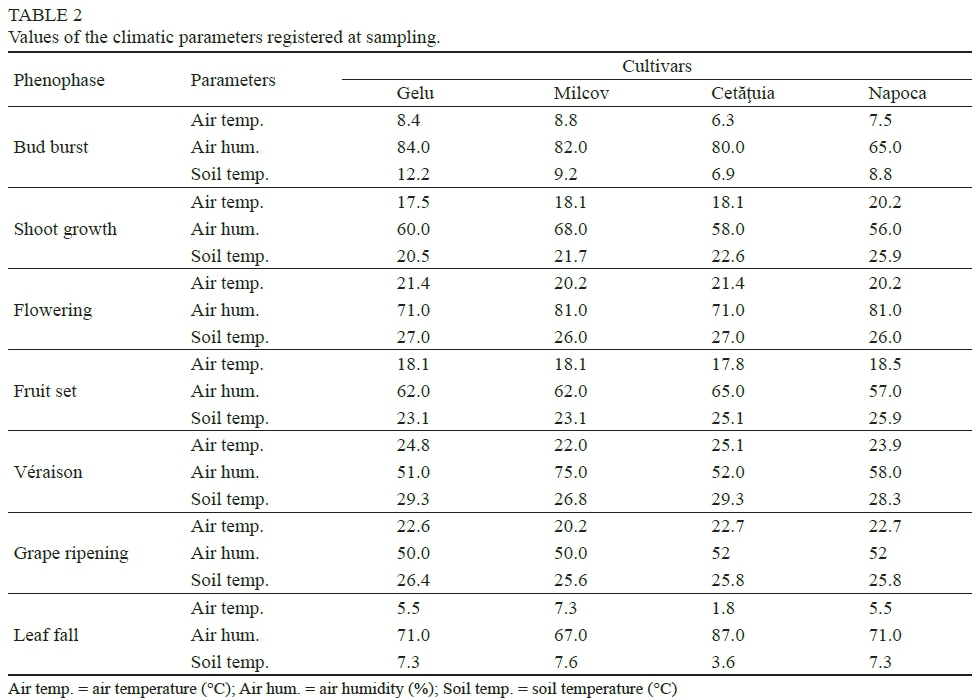
Variation in leaf pigment concentration is influenced by climatic factors (Orlandini et al., 2005). Table 2 shows the values of the main climatic parameters measured at sampling. Air humidity was very high at the beginning and end of the annual cycle. At bud burst, the air humidity was about 80%, while it exceeded 70% at leaf fall.
Air and soil temperature showed high values at flowering (early June), of 22 to 25°C, and a maximum of 27 to 29°C at grape véraison (end of July), which are considered normal temperatures for the development of biological processes in plants. As expected, the lowest air temperatures were recorded at bud burst (6.3 to 8.4°C) and at leaf fall (1.8 to 7.3°C).
Biometrical and physicochemical determinations
The genotype generates particularities in pigment accumulation through the morphology and anatomy of the leaves (Hopkins & Hüner, 2009). Petrie et al. (2000) reported that leaf area is a factor that limits the photosynthetic capacity of plants. However, it must be mentioned that net photosynthesis intensity was not correlated with chlorophyll content, the differences being related to greater intracellular spaces and gaseous conductivity (Patakas et al., 2003). Leaf area and perimeter showed a positive tendency until the initiation of fruit set (19 to 22.06) (Fig. 2). If the leaf area did not differ significantly in the early phenophases, a highly significant difference between cultivars appeared in the fruit set phase (Fig. 2A). In contrast, leaf perimeter varied non-significantly from one cultivar to the other at the same phenophase (fruit set) (Fig. 2B). This can be explained by the elongation of the mature leaf lamina (funnel-shaped), which influenced the total area of the leaves and, to a lesser extent, the leaf perimeter.
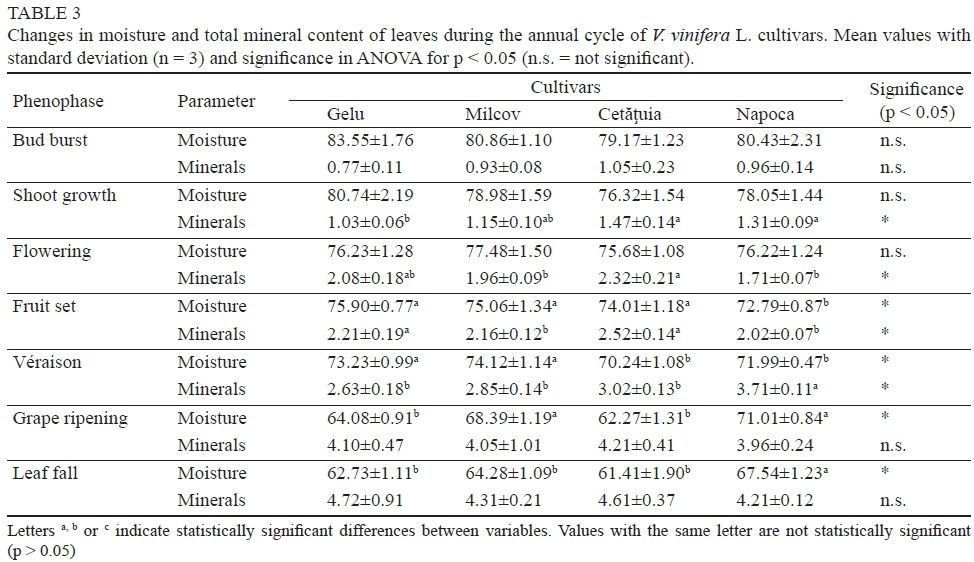
A slight decrease in these parameters was registered between grape véraison and leaf fall, closely related to the subsequent reduction in leaf moisture (R2 = 0.7518). Wermelinger and Koblet (1990) showed a constant decrease in V. vinifera L. leaf moisture throughout the growing season, and this was more pronounced in senescent leaves. According to Boyer et al. (1997), grapevine leaf moisture varies between 70% and 85%, depending on the age, physiological conditions and environmental factors. During the annual cycle of V. vinifera L. table grape cultivars, the moisture content of leaves decreased between 18 and 24%, while the total mineral content increased by up to 3.95% (Milcov cv., Table 3).
At bud burst, the moisture content of the young leaves was very similar for all cultivars, with the differences being non-significant (p > 0.05). The same situation was found for total mineral content at the end of the annual vegetative cycle (leaf fall), with non-significant differences being reported. Regarding the moisture content of the leaves, the highest variability intra-cultivar, determined on the basis of the standard deviation (n = 3), was observed in the phase of shoot growth. This phase starts in the last ten days of May, when, according to Lasa et al. (2012), the vine water requirements are lower.
Photosynthetic pigments assay
Chl a presented a minimum value of 0.51 ± 0.02 mg/g f.w. at bud burst in Napoca cv. (Fig. 3C) and a maximum of 2.80 ± 0.08 mg/g f.w. at grape véraison in Gelu cv. (Fig. 3A). Previous determinations made by Burzo et al. (2005) in the leaves of V. vinifera L. cultivars showed that the average content of Chl a at flowering was 1.58 mg/g f.w., increasing up to 2.19 mg/g f.w. at grape véraison and decreasing in September (1.84 mg/g f.w. at grape ripening). In the present study, the concentration of Chl a at véraison was higher, with a percentage of between 73.23% (Milcov cv.) and 81.43% (Gelu cv.) compared to the bud burst phenophase. As determined by the loss in absorbance at 662 nm, a decrease in Chl a of between 53.54% and 78.39% was registered from grape véraison to leaf fall (September to end of October). Chl b showed a similar trend, with maximum values at véraison and a further decrease until leaf fall of 29.52% to 67.44% (Fig. 3, A to D).
Total carotenoids gradually accumulated until flowering, by when they almost doubled their amount, reaching 0.92 ± 0.09 mg/g in the leaves of Cetätuia cv. (Fig. 3D). Carotenoid accumulation continued until grape ripening; after this point, during about two months until leaf fall (01.09 to 01.11), their content decreased, with the percentage ranging between 26.67% (Milcov cv.) and 47.71% (Gelu cv.). It is clear from the data analysis that carotenoid degradation began after about 30 days from the start of chlorophyll breakdown. As reported by Bertamini and Nedunchezhian (2001), this phenomenon resulted in the emergence of yellow foliar tissues.
In the leaves of the Cetätuia and Napoca cultivars, the amount of Car exceeded the Chl b content from grape véraison (early August), while in the Gelu and Milcov cultivars this phenomenon occurred later, at grape ripening (early September).
According to the ANOVA statistical test, the Chl a, Chl b and Car content of leaves varied significantly during the annual cycle of plants under the influence of phenophase (p < 0.05), while the influence of the cultivar was nonsignificant (p > 0.05).
Chlorophyll content index
Compared to spectrophotometry, CCM-200 plus affords fast, reliable chlorophyll content measurements, although i does not provide details regarding chlorophyll components and ratios (Filimon et al., 2014). According to Van den Berg and Perkins (2004), small differences in the structures o the two main chlorophylls (a and b) produce differences in their absorption maxima, which help in their individua assay. This fact can be exploited spectrophotometrically (by solvent extraction), but not by a chlorophyll content meter.
The chlorophyll content index (CCI) varied between 5.60 ± 0.94 (Cetätuia cv.) and 6.26 ± 0.58 (Milcov cv.) a bud burst and increased until véraison (with a maximum ol 22.88 ± 1.24 in Gelu cv.), following the same trend as the chlorophyll content of the leaves (Fig. 3). The relationship between total extractable chlorophyll (a + b) and CC assayed by non-destructive methods (CCM-200 plus) was very significant, with R2 indicating that about 92% (p < 0.05) of the variation was explained by a linear equation PLS regression was used as an exploratory analysis too to select suitable variables and to identify outliers before classical linear regression, building a linear model tha specifies the relationship between a variable and a set ol predictor variables (Haenlein & Kaplan, 2004). Using a PLS regression prediction (Fig. 4A), the equation of the mode was: Chl (a + b) = -0.247822 + 0.168892 χ CCI (non destructive method) (Fig. 4B).
Statistically, the influence of the method used on the evaluation of total chlorophyll was non-significant (p = 0.20 F = 12.36 > Fcrit. = 1.91). These results are comparable tc those presented by Steele et al. (2008), who used a SPAD 502 instrument for the non-destructive estimation of vine leaf chlorophyll and its correlation with the total Chl by solvent extraction.
Photosynthetic pigment ratios
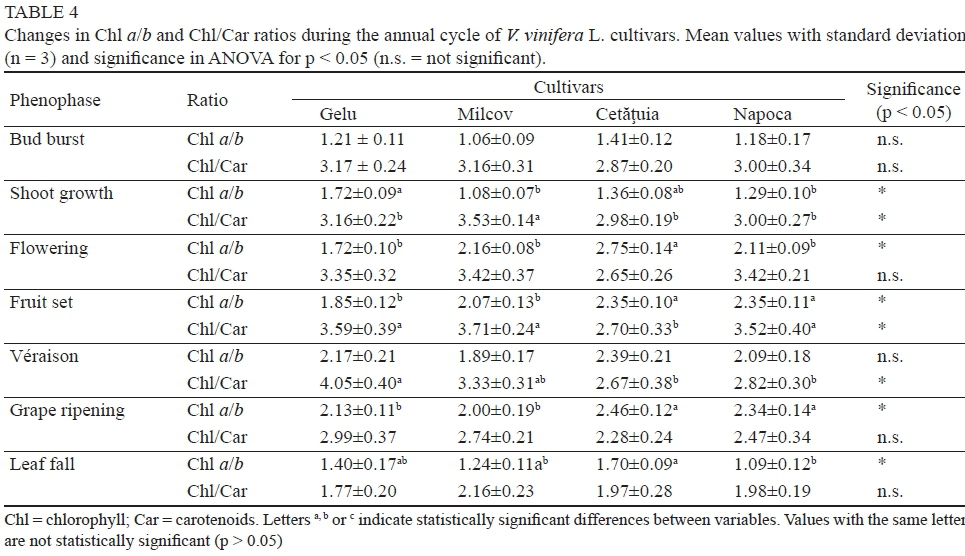
The Chl a/b ratio presented lower values at the beginning of the vegetative period (1.06 to 1.41), increasing progressively until grape ripening (Table 4). However, the Chl a/b ratio had lower values than those presented in the international literature, although comparable with data reported by Romanian researchers, of about 1.3 to 1.4 (Acatrinei & Andor, 2006; Cotovanu et al., 2012). Therefore, lower values of the Chl a/b ratio could be a particularity of some indigenous grapevine cultivars growing in the area outside the Carpathians with a continental climate and alternating hot and cold days, with frequent moisture deficit, especially in the hills, which can frequently cause inhibition of the photosynthetic processes. On the other hand, according to Hopkins and Hüner (2009), photosystem (PS) I typically has a Chl a/b ratio of about 4/1, and PS II contains 50 to 60% of the total chlorophyll, with a Chl a/b ratio of about 1.2, mostly chlorophyll b and carotenoids (xanthophyll). These data, along with those reported by Jiang et al. (2006), which shows that only a few functional PS I were developed at the initial stages of leaf growth, could also explain the lower values of the Chl a/b ratio in the early phenological stages of V. vinifera L. plants. According to Keller (2010), the amount of photosynthetic pigment in grapevine increases with leaf age, reaching a maximum at approximately five or six weeks after leaf unfolding, gradually declining thereafter in senescence.
At the beginning and end of the active vegetative period, the Chl/Car ratio in leaves shows the lowest values due to the presence of carotenoids in larger amounts (Table 4). Carotenoids serve as light-harvesting pigments, and act to protect chlorophyll from the harmful photodestructive reactions that occur in the presence of oxygen (Cogdell, 1985). The values of Chl/Car ratio fall within the published range for V. vinifera L. leaf presented by Burzo et al. (2005), but are slightly lower than those reported by Young (1993) and Bertamini and Nedunchezhian (2003), who found a chlorophyll/carotenoid ratio in the range of 3 to 4.
Total phenolic content
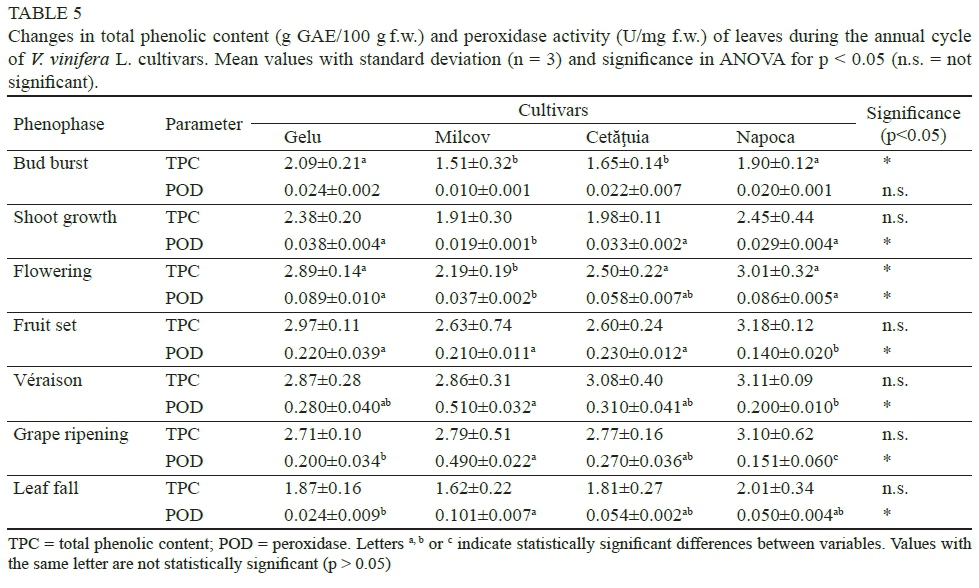
Total phenolic content was found to be higher in the leaves of red vine cultivars, and it is possible that grape leaves can have higher polyphenol levels than the grapes themselves (Fernandes et al., 2013). Vine leaves are rich in polyphenols, specifically flavonoids, providing UV protection for plant cells (particularly chloroplasts) from the damaging effects of UV rays (Treutter, 2006). The accumulation of phenolic compounds reached a maximum at the initiation of fruit set (2014-06-19 to 2014-06-22) for the Gelu (2.97 mg GAE-100/g f.w.) and Napoca (3.18 mg GAE-100/g f.w.) cultivars, and at grape véraison (2014-06-30 to 2014-0706) for the Milcov (2.86 mg GAE-100/g f.w.) and Cetätuia (3.08 mg GAE-100/g f.w.) cultivars. After these phases, the content of phenolic compounds decreased until leaf fall, by a rate of between 36.79% (Napoca cv.) and 43.36% (Milcov cv.), probably due to their degradation processes during leaf ageing (Table 5). These findings are in accordance with results reported by Katalinic et al. (2009). Schneider et al. (2008) showed that, in leaves of V. vinifera L. cultivars from Europe, flavonoids decreased considerably after grape harvest, and more pronouncedly so in samples taken from vineyards that had not been irrigated, as is the case in the present study.
Significant differences between cultivars were detected only at bud burst (p = 0.014) and flowering (p = 0.041). In the other phenophases analysed, the content of foliar phenolic compounds varied only slightly between cultivars.
Peroxidase activity
Earlier literature showed that chlorophyll and its derivatives are oxidised by peroxidases in the presence of phenolic compounds (Kato & Shimizu, 1985; Whitaker, 1994). Investigations carried out showed that, in the leaves of new V. vinifera L. cultivars, peroxidase (POD) activity varied depending on biological particularities and phenophases. POD activity had the lowest values at the beginning of the vegetative period (Table 5). With the formation and development of berries, POD activity in the leaves increased significantly, reaching the highest values as the grapes entered véraison (0.280 ± 0.040 to 0.510 ± 0.032 U/mg f.w.). It can be underlined that this was the time when Chl a started to decrease in concentration, unbalancing the Chl/Car ratio.
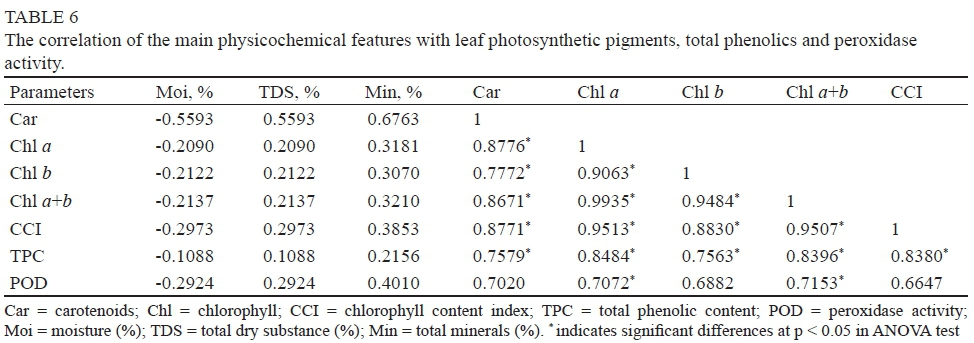
During the annual cycle of plants, a large amount of total chlorophyll was always accompanied by a high concentration of phenolic compounds (TPC) (r > 0.9327; p < 0.05). Strong correlation coefficients were registered between POD activity and TPC (r > 0.8013; p < 0.05) and between POD activity and Chl a (r > 0.7472; p < 0.05) and b (r > 0.8362; p < 0.05) (Table 6). This means that more significant peroxidase activity took place in the presence of high concentrations of chlorophyll and phenolic compounds respectively.
As previously mentioned by Yamauchi et al. (2004), in addition to specific enzyme activity (chlorophyllase, reductase, Mg-dechelatase), the degradation of chlorophyll via the peroxidase-phenolic compound system appears to be possible. Further studies are necessary to clarify the mechanism of peroxidase-mediated Chl degradation.
In parallel, it was observed that the dry substance or mineral content was not correlated with photosynthetic pigments, phenolic compounds or peroxidase activity (see Table 6).
Relationships with the environment
Air temperature is considered a dominant factor in foliar pigment biosynthesis, controlling the timing of the phenophases (Ruml & Vulic, 2005). To function, assimilatory pigments need light and moderate temperature (Creasy & Creasy, 2009). Moreover, the intensity of photosynthesis is optimal for lighting conditions of 50 000 to 60 000 lux, and in drought conditions can increase to 60 000 or 90 000 lux (Popescu & Popescu, 2014). According to Goss (1973), the optimum temperature for chlorophyll synthesis is in the region of 20 to 30°C. Below 15°C photosynthesis is strongly curtailed by an inhibition of sucrose synthesis, while above 40°C the enzymes involved in the process are destroyed (Keller, 2010).
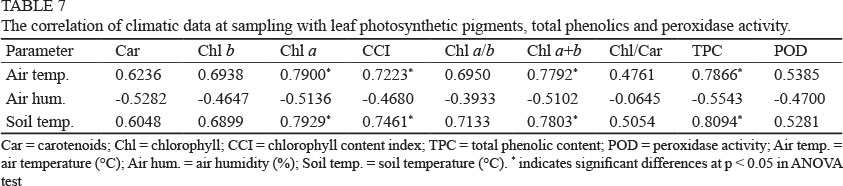
Climatic data at the sampling time were correlated with leaf photosynthetic pigment concentrations, TPC and POD activity (Table 7). Analysis of variance (ANOVA) indicated statistically significant relationship between air and soil temperature and the analysed parameters (at the 95% level of confidence).
High air temperature was positively correlated with the concentration of Chl a (r = 0.7900) and phenolic compounds (r = 0.7866). This is in accordance with Amarowicz et al. (2010), who showed that low temperatures can modify the composition of phenolic compounds, along with a lowering of their content.
On the other hand, high air humidity appears to act as a negative factor in terms of photosynthetic pigment synthesis, as the correlation coefficients show negative values. This fact is more obvious in the case of TPC accumulation, while POD activity was not related to variations in air humidity.
CONCLUSIONS
During the annual cycle of V. vinifera L. table grape cultivars, chlorophyll a and b showed a continuous accumulation until the early stages of grape maturation (véraison), while the accumulation of carotenoids continued for about 30 days until grape ripening. The Chl a/b ratio had lower values at the beginning of the vegetative period and increased progressively until grape ripening. Between grape ripening and leaf fall there was a significant decrease in the Chl/Car ratio based on fast chlorophyll degradation. For V. vinifera L. table grape cultivars, grape véraison could be regarded as the starting point of leaf (foliage) senescence. At véraison, when chlorophyll breakdown has started, peroxidase showed the most intense activity, possibly due to the involvement in chlorophyll degradation in the presence of phenolic compounds. The relationship between total chlorophyll (by extraction) and chlorophyll content index (non-destructive method) was very significant (R2 = 0.9201; p < 0.05), with their variation explained by a linear model. Once this relationship is established, the CCM-200 plus can become an effective tool in grapevine management. These research findings contribute to a better understanding of foliar pigment dynamics during the annual biological cycle and in relation to the timing of their decline, and to defining the behaviour of new table grape cultivars in the mentioned conditions.
LITERATURE CITED
Acatrinei, L. & Andor, I., 2006. Physiological researches at varieties of grapes in Cotnari vineyards under pesticides treatments. Lucr. Ştiin_.fice USAMV Iaşi, Seria Horticultură 49, 317-322. http://www.uaiasi.ro/revista_horti/arhiva.php?an=2006. [ Links ]
Aien, A., Khetarpal, S. & Pal, M., 2011. Photosynthetic characteristics of potato cultivars grown under high temperature. Am. Eurasian. J. Agric. Environ. Sci. 11(5), 633-639. [ Links ]
Amarowicz, R., Weidner, S., Wójtowicz, I., Karamać, M., Kosinska, A. & Rybarczyk, A., 2010. Influence of low-temperature stress on changes in the composition of grapevine leaf phenolic compounds and their antioxidant properties. Funct. Plant Sci. Biot. 4, 90-96. [ Links ]
Baggiolini, M., 1952. Stades repêres de l'abricotier. Rev. Roman de Agric. Vitic. Arboric. 8, 28-29. [ Links ]
Bania, I. & Mahanta, R., 2012. Evaluation of peroxidases from various plant sources. Int. J. Sci. Res. Pub. 2(5), 1-5. [ Links ]
Bergmeyer, H.U., 1974. Methods of enzymatic analysis, vol. I. Academic Press, New York. [ Links ]
Bertamini, M. & Nedunchezhian, N., 2001. Decline of photosynthetic pigments, ribulose-1,5-bisphosphate carboxylase and soluble protein contents, nitrate reductase and photosynthetic activities, and changes in thylakoid membrane protein pattern in canopy shade grapevine (V vinifera cv. Moscato Giallo) leaves. Photosynthetica 39(4), 529-537. [ Links ]
Bertamini, M. & Nedunchezhian, N., 2003. Photosynthetic functioning of individual grapevine leaves (Vitis vinifera L. cv. Pinot noir) during ontogeny in the field. Vitis 42(1), 13-17. [ Links ]
Biber, P.D., 2007. Evaluating a chlorophyll content meter on three coastal wetland plant species. J. Agric. Food Environ. Sci. 1(2), 1-11. [ Links ]
Blankenship, R.E., 2014 (2nd ed). Molecular mechanisms of photosynthesis. Wiley-Blackwell, Oxford. [ Links ]
Bodor, P., Baranyai, L., Ladányi, M., Bálo, B., Strever, A.E., Bisztray, G.D. & Hunter, J.J., 2013. Stability of ampelometric characteristics of Vitis vinifera L. cv. 'Syrah' and 'Sauvignon blanc' leaves: Impact of within- vineyard variability and pruning method/bud load. S. Afr. J. Enol. Vitic. 34(1), 129-137. [ Links ]
Boyer, J.S., Wong, S.C. & Farquhar, G.D., 1997. CO2 and water vapor exchange across leaf cuticle (epidermis) at various water potentials. Plant Physiol. 114 (1), 185-191. [ Links ]
Britton, G., 2008. Functions of intact carotenoids. In Britton, G., Liaaen- Jensen, S. & Pfander, H. (eds). Carotenoids, vol. IV: Natural Functions. Birkhäuser Verlag, Basel. pp. 189 - 211. [ Links ]
Burzo, I., Dejeu, L., Şerdinescu, A. & Bädulescu, L., 2005. Grapevine physiology (in Romanian), vol. 3. Elisavaros, Bucharest. [ Links ]
Callejas, R., Kania, E., Contreras, A., Peppi, C. & Morales, L., 2013. Evaluation of a non-destructive method to estimate the concentration of chlorophyll in leaves of table grape cv. Idesia (Chile) 31(4), 19-26. [ Links ]
Carnegie Institution for Science, 2011. Spectranomics protocol: Chlorophylls and carotenoids. Stanford, USA. http://spectranomics.stanford.edu/technical_information.attachment/105. [ Links ]
Cogdell, R.J., 1985. Carotenoids in photosynthesis. Pure & Appl. Chem. 57(5), 723-728. [ Links ]
Coţovanu, R., Rotaru, L., Cäulet, R., & Filimon, V.R., 2012. Variation of photosynthetic pigments content under the influence of treatments with biostimulating substances at some table grape varieties grown in Iaşi vineyard area. Lucr. Ştiinţifice USAMV Iaşi, Seria Horticulturä 55(1), 309-314. http://www.uaiasi.ro/revista_horti/arhiva.php?an=2012&numar=1. [ Links ]
Creasy, G.L. & Creasy, L.L., 2009. Grapes. CAB Int., Cambridge. [ Links ]
Cuttriss, A. & Pogson, B., 2004. Carotenoids. In Davies, K.M. (ed). Plant pigments and their manipulation. CRC Press, Boca Raton. pp. 57-92. [ Links ]
Davies, K.M., 2004. An introduction to plant pigments in biology and commerce. In Davies, K.M. (ed). Plant pigments and their manipulation. CRC Press, Boca Raton. pp. 1 - 23. [ Links ]
Eichhorn, K.W. & Lorenz, D.H., 1977. Phänologische Entwicklungsstadien der Rebe. Nachrichtenbl. Deut. Pflanzenschutz. 29, 119-120. [ Links ]
Fassnacht, F.E., Stenzel, S. & Gitelson, A.A., 2015. Non-destructive estimation of foliar carotenoid content of tree species using merged vegetation indices. J. Plant Physiol. 176, 210-217. [ Links ]
Fernandes, F., Ramalhosa, E., Pires, P., Verdial, J., Valentão, P., Andrade, P., Bento, A. & Pereira, J.A., 2013. Vitis vinifera leaves towards bioactivity. Ind. Crops Prod. 43, 434-440. [ Links ]
Filimon, V.R., Filimon, R. & Rotaru, L., 2014. Characterization of some Vitis vinifera L. indigenous varieties by analysis of leaf photosynthetic pigments. Bulletin UASVM Horticulture 71(2), 246-255. [ Links ]
Ghasemi, M., Arzani, K., Yadollahi, A., Ghasemi, S. & Sarikhani, S.K., 2011. Estimate of leaf chlorophyll and nitrogen content in Asian pear (Pyrus serotina Rehd.) by CCM-200. Not. Sci. Biol. 3(1), 91-94. [ Links ]
Gitelson, A.A., Chivkunova, B.O. & Merzlyak, M.N., 2009. Nondestructive estimation of anthocyanins and chlorophylls in anthocyanic leaves. Am. J. Bot. 96(10), 1861-1868. [ Links ]
Goss, J.A., 1973. Physiology of plants and their cells. Pergamon Press, New York. [ Links ]
Gross, J., 1991. Pigments in vegetables: Chlorophylls and carotenoids. Van Nostrand, New York. [ Links ]
Haenlein, M. & Kaplan, A.M., 2004. A beginner's guide to partial least squares analysis. Understanding Statistics 3(4), 283-297. [ Links ]
Hopkins, W.G. & Hüner, P.A.N., 2009 (4th ed). Introduction to plant physiology. John Wiley & Sons, New York. [ Links ]
Hörtensteiner, S. & Kräutler, B., 2011. Chlorophyll breakdown in higher plants. Biochim. Biophys. Acta 1807, 977-988. [ Links ]
Hynninen, P.H., Kaartinen, V. & Kolehmainen, E., 2010. Horseradish peroxidase-catalyzed oxidation of chlorophyll a with hydrogen peroxide. Characterization of the products and mechanism of the reaction. Biochem. Bio. Acta 1797(5), 531-542. [ Links ]
International Organisation of Vine and Wine (OIV), 2012. Compendium of international methods of wine and must analysis. vol. 2. International Organisation of Vine and Wine. Paris, France. http://www.oiv.int/oiv/info/enmethodesinternationalesvin [ Links ]
Jiang, C.D., Shi, L., Gao, H.Y., Schansker, G., Tóth, S.Z. & Strasser R.J., 2006. Development of photosystems 2 and 1 during leaf growth in grapevine seedlings probed by chlorophyll a fluorescence transient and 820 nm transmission in vivo. Photosynthetica 44(3), 454-463. [ Links ]
Jones, G.V. & Davis, R.E., 2000. Climate Influences on grapevine phenology, grape composition, and wine production and quality for Bordeaux, France. Am. J. Enol. Vitic. 51(3), 249-261. [ Links ]
Katalinić, V., Generalić, I., Skroza, D., Ljubenkov, I., Teskera, A., Konta, I. & Boban, M., 2009. Insight in the phenolic composition and antioxidative properties of Vitis vinifera leaves extracts. Croat. J. Food Sci. Technol. 1(2), 7-15. [ Links ]
Kato, M. & Shimizu, S., 1985. Chlorophyll metabolism in higher plants VI. Involvement of peroxidase in chlorophyll degradation. Plant Cell Physiol. 26(7), 1291-1301. [ Links ]
Keller, M., 2010. The science of grapevines: Anatomy and physiology. Elsevier, Burlington. [ Links ]
Khaleghi, E., Arzani, K., Moallemi, N. & Barzegar, M., 2012. Evaluation of chlorophyll content and chlorophyll fluorescence parameters and relationships between chlorophyll a, b and chlorophyll content index under water stress in Olea europaea cv. Dezful. World Acad. Sci. Eng. Technol. 6, 2112-2115. [ Links ]
Lanfer Marquez, U.M. & Sinnecker, P., 2008. Chlorophylls in foods: Sources and stability. In Socaciu, C. (ed). Food colorants: Chemical and functional properties. CRC Press, Boca Raton. pp. 195 - 212. [ Links ]
Lasa, B., Menendez, S., Sagastizabal, K., Cervantes, M.E.C., Irigoyen, I., Muro, J., Aparicio-Tejo, P.M. & Ariz, I., 2012. Foliar application of urea to 'Sauvignon Blanc' and 'Merlot' vines: Doses and time of application. Plant Growth Regul. 67(1), 73-81. [ Links ]
Lichtenthaler, H.K., 1987. Chlorophylls and carotenoids: Pigments of photosynthetic biomembranes. Meth. Enzymol. 148, 350-382. [ Links ]
Lichtenthaler, H.K. & Buschmann, C., 2001. Chlorophylls and carotenoids: Measurement and characterization by UV-VIS spectroscopy. In Wrolstad, R.E. (ed). Current protocols in food analytical chemistry. John Wiley & Sons, New York. Unit F4.2 - F4.3. [ Links ]
Lisar, S.Y.S., Motafakkerazad, R., Hossain, M.M. & Rahman, I.M.M., 2012. Water stress in plants: Causes, effects and responses. In Rahman, I.M.M. & Hasegawa, H. (eds). Water Stress. InTech, Rijeka. pp. 1 - 14. [ Links ]
Markwell, J.P., Danko, S.J., Bauwe, H., Osterman, J.C., Gorz, H.J. & Haskins, F. A., 1986. A temperature-sensitive chlorophyll b-deficient mutant of sweetclover (Melilotus alba). Plant Physiol. 81(2), 329-334. [ Links ]
Merzlyak, M.N., Gitelson, A.A., Chivkunova, O.B. & Rakitin, V.Y., 1999. Non-destructive optical detection of leaf senescence and fruit ripening. Physiol. Plant 106(1), 135-141. [ Links ]
Mendes-Pinto, M.M., Ferreira, A.C.S., Caris-Veyrat, C. & De Pinho, G.P., 2005. Carotenoids, chlorophyll, and chlorophyll-derived compounds in grapes and Port wines. J. Agric. Food Chem. 53(26), 10034-10041. [ Links ]
Mittal, S., Kumari, N. & Sharma, V., 2011. Differential responses of seven contrasting species to high light using pigment and chlorophyll a fluorescence. J. Stress Physiol. Biochem. 7(2), 20-33. [ Links ]
Netto, A.T., Campostrini, E., De Oliveira, J.G. & Bressan-Smith, R.E., 2005. Photosynthetic pigments, nitrogen, chlorophyll a fluorescence and SPAD-502 readings in coffee leaves. Sci. Hortic. 104, 199-209. [ Links ]
Orlandini, S., Grifon, D., Mancini, M., Barcaioli, G. & Crisci, A., 2005. Analisi degli effetti della variabilità meteo-climatica sulla qualità del Brunello di Montalcino. Ital. J. Agrometeorol. 2, 37-44. [ Links ]
Patakas, A., Stavrakas, D. & Fisarakis, I., 2003. Relationship between CO2 assimilation and leaf anatomical characteristics of two grapevine cultivars. Agronomie 23(4), 293-296. [ Links ]
Petrie, P.R., Trought, M.C.T. & Howell, G.S., 2000. Influence of leaf ageing, leaf area and crop load on photosynthesis, stomatal conductance and senescence of grapevine (Vitis vinifera L. cv. Pinot noir) leaves. Vitis 39(1), 31-36. [ Links ]
Pfander, H., 1992: Carotenoids: An overview. Methods Enzymol. 213, 3-13. [ Links ]
Popescu, M. & Popescu, G.C., 2014. Diurnal changes in leaf photosynthesis and relative water content of grapevine. Current Trends in Natural Sciences (CTNS) 3(6), 74-81. [ Links ]
Rabinowitch, E. & Govindjee, 1969. Photosynthesis. Wiley, New York. pp. 102-123. [ Links ]
Raven, P.H., Evert, R.F. & Eichhorn, S.E., 2005. Photosynthesis, light, and life. In Freeman, W.H. (ed). Biology of plants. Freeman W.H., New York. pp. 119-127. [ Links ]
Rotaru, L., 2009. Identifying the phenotypic resemblances of the vine breeds by means of cluster analysis. Not. Bot. Horti. Agrobo. Cluj Napoca 37(1), 249-252. [ Links ]
Rotaru, L., Mustea, M., Petrea, G. & Nechita, B., 2010. New creations vinifera for table grapes intended for the restrictive conditions of culture of the North-Eastern zone of Romania. USABT J. of Horticulture, Forestry and Biotech. 14, 7-12. [ Links ]
Ruml, M. & Vulic, T., 2005. Importance of phenological observations and predictions in agriculture. J. Agri. Sci. 50(2), 217-225. [ Links ]
Salem-Fnayou, B.A., Bouamama, B., Ghorbel, A. & Mliki, A., 2011. Investigations on the leaf anatomy and ultrastructure of grapevine (Vitis vinifera) under heat stress. Microsc. Res. Tech. 74(8), 756-762. [ Links ]
Schneider, E., Von der Heydt, H. & Esperester, A., 2008. Evaluation of polyphenol composition in red leaves from different varieties of Vitis vinifera. Planta Med. 74, 565-572. [ Links ]
Sims, D.A. & Gamon, J.A., 2002. Relationships between leaf pigment content and spectral reflectance across a wide range of species, leaf structures and developmental stages. Remote Sens. Environ. 81(2-3), 337 354. [ Links ]
Steele, M., Gitelson, A. & Rundquist, D., 2008. Nondestructive estimation of leaf chlorophyll content in grapes. Am. J. of Enol. Vitic. 59(3), 299-305. [ Links ]
Treutter, D., 2006. Significance of flavonoids in plant resistance: A review. Environ. Chem. Lett. 4, 147-157. [ Links ]
Van den Berg, A.K. & Perkins, T.D., 2004. Evaluation of a portable chlorophyll meter to estimate chlorophyll and nitrogen contents in sugar maple (Acer saccharum Marsh.) leaves. Forest Ecol. Manag. 200, 113-117. [ Links ]
Wang, C., Han, J., Shangguan, L., Yang, G., Kayesh, E., Zhang, Y., Leng, X. & Fang, J., 2014. Depiction of grapevine phenology by gene expression information and a test of its workability in guiding fertilization. Plant Mol. Biol. Rep. 32(5), 1070-1084. [ Links ]
Warren, P.L., 2013. Landscape vines for Southern Arizona. The University of Arizona, College of Agriculture and Life Sciences - Cooperative Extension. Tucson, Arizona, USA. http://extension.arizona.edu/sites/extension.arizona.edu/files/pubs/az1606.pdf. [ Links ]
Wermelinger, B. & Koblet, W., 1990. Seasonal growth and nitrogen distribution in grapevine leaves, shoots and grapes. Vitis 29, 15-26. [ Links ]
Whitaker, J.R., 1994. Principles of enzymology for the food sciences. Marcel Dekker, New York. [ Links ]
Willows, R.D., 2004. Chlorophylls. In Davies, K.M. (ed). Plant pigments and their manipulation. CRC Press, Boca Raton. pp. 23 - 57. [ Links ]
Yamauchi, N., Funamoto, Y. & Shigyo, M., 2004. Peroxidase-mediated chlorophyll degradation in horticultural crops. Phytochem. Rev. 3(1-2), 221-228. [ Links ]
Young, A.J., 1993. Occurrence and distribution of carotenoids in photosynthetic systems. In Young, A.J. & Britton, G. (eds). Carotenoids in photosynthesis. Springer Verlag, London, pp. 16-71. [ Links ]
Submitted for publication: July 2015
Accepted for publication: October 2015
Acknowledgements: This paper was published under the European Social Fund, Human Resources Development Operational Programme 2007-2013, project no. POSDRU/159/1.5/S/132765
* Corresponding author: E-mail address: razvan_f80@yahoo.com
