


Services on Demand
Article
 English (pdf)
 Article in xml format
 Article references
Indicators

Related links
-
 Cited by Google
 -
 Similars in Google
Share

 Permalink
South African Journal of Enology and Viticulture
On-line version ISSN 2224-7904
Print version ISSN 0253-939X
S. Afr. J. Enol. Vitic. vol.37 n.1 Stellenbosch 2016
Seasonal variation in composition of winery wastewater in the breede River Valley with respect to classical water quality parameters
C.L. HowellI, *; P.A. MyburghI; E.L. LateganI; J.E. HoffmanII
IARC Infruitec-Nietvooibij, The Fruit, Vine and Wine Institute, Private Bag X5026, Stellenbosch 7599, South Africa
IIDepartment of Soil Science, Stellenbosch University, Private Bag X1, Matieland 7602
ABSTRACT
The annual wastewater quality dynamics of a winery from which wastewater was sourced for a field experiment investigating the dilution of winery wastewater for vineyard irrigation were determined. Annual mean monthly pH ranged from 4.2 to 6.8 and was lower during grape harvest than in winter. Electrical conductivity (EC) increased from the start of harvest (February) and reached a maximum in May, followed by a decline to a minimum in August. The increase in EC probably originated from cleaning agents used in the winery, as well as K+ in the grape lees and spillage from the grape fermentation process. With the exception of August, EC exceeded the critical value of 0.75 dS/m, which is the salinity threshold for water used for grapevine irrigation. The mean monthly chemical oxygen demand (COD) level increased from January and was highest at peak harvest (March). The K+ and Na+ levels in the winery wastewater increased from February to May. The sodium adsorption ratio (SAR) ranged from 2.4 to 9.0 and increased from January to June. Although COD concentration in winery wastewater is the preferred indicator of water quality for the South African wine industry, it did not provide a reliable indication of suitability for irrigation. However, EC was strongly determined by the K+ concentration. This was to be expected, since K+ is usually the most abundant cation in winery wastewater. Therefore, EC would be a more reliable indicator of winery wastewater quality than COD concentration, particularly with regard to the concentrations of cations such as K+ and Na+.
Key words: Chemical oxygen demand, electrical conductivity, pH, potassium adsorption ratio, sodium adsorption ratio
INTRODUCTION
Wineries produce large volumes of low-quality wastewater, particularly during the harvest period. Although reports on the actual volumes of wastewater generated are extremely limited, it is estimated that medium to large wineries generate more than 15 000 m3 of wastewater annually (Van Schoor, 2005 and references therein). In comparison, small wineries generate less than 15 000 m3. Australian wineries produce about 3 to 5 m3 of wastewater per tonne of grapes crushed (Chapman et al., 1995; Anonymous, 2010; Mosse et al., 2011). Locally it can be estimated that the Lutzville Vineyards winery generates about 1.1 m3 of wastewater per tonne of grapes crushed (Kriel, 2008). However, since 50% of the wastewater is presumably lost to evaporation, this relatively low value can be misleading. In comparison, substantially lower volumes, viz. 0.359 m3 and 0.357 m3 wastewater per tonne of grapes crushed, were generated in French cellars for off-skin white-wine making, and rosé and thermo-vinification of red wines respectively (Bories & Sire, 2010). An even lower value, of 0.262 m3 of wastewater generated per tonne of grapes crushed, was reported for on-skin vinification of red wines (Bories & Sire, 2010).
Winery wastewater contains high levels of K+ and Na+, which originate from cleaning products, grape lees and spillage from the grape fermentation process (Laurenson, 2010; Laurenson et al., 2012; Conradie et al., 2014). The levels of these two ions are largely dependent upon the nature of the cleaning agents used in a particular winery (Mosse et al., 2011). High K+ levels are common because of the high concentrations of K+ in grape juice. Winery wastewater can also contain low levels of Ca2+ and Mg2+ (Mosse et al., 2011; Conradie et al., 2014). Neither of these is harmful to the soil structure and could help to ameliorate the impact of Na+ in the wastewater by reducing the sodium adsorption ratio (SAR) (Mosse et al., 2011). The organic material in winery wastewater is generated from the grapes and wine (Conradie et al., 2014 and references therein). Different winemaking processes also affect the composition of winery wastewater (Bories & Sire, 2010). In the case of off-skin winemaking, sugars are the main component of the organic load in the effluent water, whereas classical winemaking methods generate wastewaters containing high levels of ethers and ethanol. However, it is also possible that spikes of extremely low quality can be caused by process interruptions. Power failure, fire, flood, storms, over- or under-loading of wastewater treatment systems, temporary unavailability of wastewater-holding dam capacity and the absence of trained operators may cause process interruptions (Campos et al., 2000; Van Schoor, 2005; Baker & Hinze, 2007).
Wineries vary in size, operational procedures and management practices. They undertake similar, yet highly site-specific, processes. These variations result in the productionof different quantities of wastewater of different qualities (Van Schoor, 2005). In South Africa, the typical wine production process can be divided into various stages. During the pre-harvest period, bottling takes place and tanks are washed out with NaOH or KOH (Van Schoor, 2005). Other equipment is also washed to prepare for the incoming harvest. Wastewater generation increases drastically from early harvest onwards, and white wine production dominates harvest activities. The peak harvest period, which generates the largest quantity of the wastewater, can last up to 14 weeks. During late harvest, wastewater generation decreases substantially and red wine production dominates harvest activities. Medium to large wineries with year-round operations generate approximately 50% of their wastewater during the vintage period, whereas small wineries may generate up to 80% of their wastewater during harvest (Van Schoor, 2005 and references therein). In the post-harvest period, pre-fermentation activities come to an end and maximum usage of hydroxide occurs. Beyond the harvest, wastewater production is at its minimum and the quality depends on daily activities. According to Van Schoor (2005), the major origin of wastewater from wineries is water used for cleaning processes, which makes up c. 78% of the wastewater generated. This water is from alkaline washing, neutralisation and rinsing water used for tanks, floors, transfer lines, bottles and barrels. These actions will increase the Na+, K+ and P levels in the wastewater, and consequently there will be a variation in pH and an increase in electrical conductivity (EC), chemical oxygen demand (COD) and SAR. In terms of process water, filtration with filter aid contributes up to 15% of the volume of wastewater generated, and this action can increase EC and COD. The acidification and stabilisation of wine can increase EC and COD, while reducing wastewater pH (Van Schoor, 2005).
Regarding the legal requirements for irrigation water quality in South Africa, COD, pH, electrical conductivity of the irrigation water (ECiw) and SAR are considered to be important (Department of Water Affairs, 2013). A survey carried out to evaluate winery wastewater generated by the South African wine industry revealed that the water quality parameters vary substantially between wineries (Mulidzi et al., 2009). Variation in water quality parameters also occurs in wastewater produced by wineries all over the world (Conradie et al., 2014 and references therein). Furthermore, a strong seasonal variation in winery wastewater quality has been observed in the South African industry (Mulidzi et al., 2009). A similar seasonal trend was reported for winery wastewater in Australia (Arienzo et al., 2009a). These trends were confirmed where the effluent of two wineries was monitored frequently (Sheridan et al., 2011). Considering the legal requirements for irrigation water quality in South Africa (Department of Water Affairs & Forestry, 1996; Department of Water Affairs, 2013), the results of the survey confirmed that the majority of South African wineries cannot irrigate crops beneficially as part of the General Authorisations for irrigation with winery wastewater unless the water is first subjected to an effective form of pre-treatment, or unless there is relaxation of the General Authorisations.
The objectives of this study were to assess the seasonal quality of winery wastewater produced by a commercial winery and to quantify the relationship between the different water quality parameters.
MATERIALS AND METHODS
Water quality
The annual wastewater quality dynamics of a winery near Rawsonville in the Breede River Valley from which wastewater for a field experiment was sourced were determined. In the study, the re-use of winery wastewater diluted to eight different levels of COD for vineyard irrigation was investigated (Myburgh et al., 2015). A 2 L sample of treated winery wastewater was abstracted from the collection pit at the winery on a monthly basis from January 2010 until mid-December 2013. The COD in the winery wastewater was measured using a portable spectrophotometer (Aqualitic COD-reactor®, Dortmund) with the appropriate test kits (COD, CSB, 0 to 15 000 mg/L). This procedure required a two-hour oxidation time. Samples of the winery wastewater were analysed by a commercial laboratory for pH, EC, Ca2+, Mg2+, K+ and Na+ according to the methods described by Clesceri et al. (1998). The potassium adsorption ratio (PAR) was calculated as follows:

where K+ is the potassium concentration (mg/L) divided by the molecular mass, viz. 39 g/mol, Ca2+ is the calcium concentration (mg/L) divided by the equivalent molecular mass, viz. 20 g/mol, and Mg2+ is the magnesium concentration (mg/L) divided by the equivalent molecular mass, viz. 12 g/mol. Similarly, the SAR was calculated as follows:

where Na+ is the sodium concentration (mg/L) divided by the molecular mass, viz. 23 g/mol. The assessment of the microbial status of the winery wastewater was beyond the scope of the study.
RESULTS AND DISCUSSION
Annual dynamics of winery wastewater quality
pH
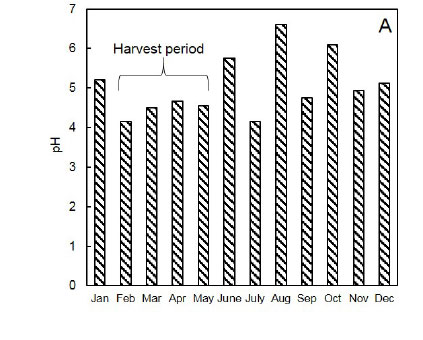
The annual mean monthly pH in the wastewater ranged from 4.2 to 6.8 (Fig. 1A). The narrow pH range was most likely due to the addition of lime to the wastewater by the particular winery. The pH varied between values of 3 to 12, as previously reported for winery wastewater (Mosse et al., 2011 and references therein). Likewise, the wastewater pH was within the range of 3.5 to 7.9, as according to a more recent study (Conradie et al., 2014 and references therein). The pH levels were also below the recommended pH for irrigation water, which ranges from 6.5 to 8.4 (Department of Water Affairs & Forestry, 1996; Howell & Myburgh 2013). According to the General Authorisations of 2013, up to 500 m3 of wastewater may be irrigated on any given day, provided that the pH is between 6 and 9 (Department of Water Affairs, 2013). In general, the pH of the winery wastewater was below these norms (Fig. 1A), therefore the water would not be suitable for irrigation without treatment. The pH in the winery wastewater tended to be lower during harvest, i.e. from February to May, than in the rest of the year (Fig. 1A). In annual dynamics monitored at two wineries in Stellenbosch, winery wastewater pH also was lower during harvest (Sheridan et al., 2011). Similar results were reported by Kumar et al. (2006). The lower pH was probably due to the organic acids in grapes (Mosse et al., 2011), which could have spilled into the washwater during the winemaking process. Furthermore, ethanol in the wine is degraded to acetic acid, which could further reduce the pH (Sheridan et al., 2011). Since the pH in grape juice and wine ranges from 3 to 4 (Sheridan et al., 2011), juice and wine spills could also have reduced the wastewater pH. In a study observing the composition of winery wastewater from ten different wineries across South Africa, pH in winery wastewater during harvest was frequently below 4 (Mulidzi et al., 2009).


EC
The annual mean monthly EC in the wastewater from the collection pit ranged from 0.7 dS/m to 2.2 dS/m (Fig. 1B). The EC variation was similar to the values of 0.8 dS/m to 3.1 dS/m reported by Mosse et al. (2011 and references therein). However, the variation was greater than the 1.3 dS/m to 1.6 dS/m reported for winery wastewater in South Africa (Laurenson et al., 2012 and references therein). Although the lower limit was comparable to the 0.4 dS/m for wastewater reported by Mulidzi et al. (2009), the upper limit of 25.7 dS/m observed in that particular survey was appreciably higher than the 2.2 dS/m in the current study (Fig. 1B). With the exception of August, EC exceeded the critical value of 0.75 dS/m, which is the salinity threshold for water used for grapevine irrigation (Van Zyl, 1981; Myburgh, 2012). With regard to the General Authorisations of 2013 (Department of Water Affairs, 2013), up to 500 m3 of wastewater may be irrigated on any given day, provided that the ECiw is less than 2 dS/m. Since the EC in the winery wastewater was lower than the limit prescribed by the General Authorisations, the EC of the water would render it suitable for irrigation without treatment to reduce the salinity level. Although the EC during the harvest period was lower than the norm prescribed where up to 500 m3 is irrigated per day, it was higher than the prescribed norm where 2 000 m3 of wastewater is irrigated on any given day, which ranges from 0.7 dS/m to 1.5 dS/m (Department of Water Affairs, 2013). The EC in the winery wastewater tended to increase from the start of harvest in February and reached a maximum in May, followed by a decline to a minimum in August (Fig. 1B). This increase in EC probably originated from cleaning agents used in the winery, as well as the K+ in grape lees and spillages from the grape fermentation process.
COD
The annual mean monthly COD levels in the wastewater ranged from 1 815 mg/L to 13 286 mg/L (Fig. 1C), which fall between the values of 320 mg/L to 12 000 mg/L previously reported for winery wastewater in South Africa (Mosse et al., 2011 and references therein). Likewise, the COD levels were within the range of 340 mg/L to 49 105 mg/L according to a more recent study (Conradie et al., 2014 and references therein). Up to 50 m3, 500 m3 and 2 000 m3 of wastewater may be irrigated on any given day provided that the COD is lower than 5 000 mg/L, 400 mg/L and 40 mg/L respectively (Department of Water Affairs, 2013). In general, COD levels in the winery wastewater were higher than these norms. Since the COD levels in the winery wastewater were higher than the limits prescribed by the General Authorisations, particularly in the harvest period, the water would not be suitable for irrigation without treatment to reduce the COD. The mean monthly COD level in the winery wastewater increased from January and was the highest during peak harvest in March, exceeding 10 000 mg/L (Fig. 1C). Reported COD values in a survey of ten different wineries across South Africa ranged from 3 370 mg/L for a winery in Paarl to 47 024 mg/L for a winery in the Olifants River region (Mulidzi et al., 2009). Sheridan et al. (2011) reported much lower COD values for a cellar in Stellenbosch, which peaked at c. 3 800 mg/L. Lower COD values tended to occur in the pre- and post-harvest periods. Similar findings were reported by Sheridan et al. (2011). Following the maximum COD levels at the peak of harvest, levels decreased until June (Fig. 1C). This decrease reflected the end of the peak harvesting period. In July, the COD level in the winery wastewater was high, probably due to the stabilisation of the wine, which can increase COD levels (Conradie et al., 2014). The COD levels in the winery wastewater were low in August, September and October (Fig. 1C). Thereafter, the COD levels increased in the wastewater, and this increase can be attributed to preparations in the cellar for the forthcoming harvest period.
Potassium
The annual mean monthly K+ in the wastewater ranged from 44 mg/L to 506 mg/L (Fig. 2A). Mulidzi et al. (2009)
tentatively classed 200 mg/L as high for K+. Using this norm, the K+ levels in the wastewater from the collection pit was high from January to May. The K+ levels were higher than the range of 29 mg/L to 353 mg/L previously reported for winery wastewater (Mosse et al., 2011 and references therein). Likewise, the wastewater K+ was higher than the range of 20 mg/L to 220 mg/L reported in a study carried out at two wineries near Stellenbosch (Sheridan et al., 2011). The K+ levels in the winery wastewater increased substantially from the beginning of harvest, in early February, to May (Fig. 2A). The higher K+ probably originated from cleaning agents, grape lees and spillage from the fermentation process (Arienzo et al., 2009a; Laurenson et al., 2012). The increase in K+ during the harvest period at this particular winery was similar to the findings reported by Sheridan et al. (2011). In a survey on the composition of winery wastewater, reported values for a winery in the Orange River region ranged from 49 mg/L in January to 296 mg/L in March, and values were high for most of the sampling period (Mulidzi et al., 2009). Excessively high values, of up to 4 119 mg/L, also occurred in the Olifants River region in March.
Potassium adsorption ratio
The annual mean monthly PAR in the winery wastewater ranged from 1.7 to 10.8 (Fig. 2B). The PAR levels were higher than the values of 2.1 to 3.2 that were reported for winery wastewater, particularly during the harvest period (Laurenson et al., 2012 and references therein). However, it was previously reported for a winery in Australia that PAR values ranged from 3.7 to 43.0 (Arienzo et al., 2009b). As the K+ levels increased during harvest, probably due to K+ in the cleaning agents used in the winery, grape lees and spillage (Arienzo et al., 2009a; Laurenson et al., 2012), the PAR levels in the winery wastewater increased substantially - from the beginning of harvest in early February to May (Fig. 2B).
Sodium
The annual mean monthly Na+ levels in the wastewater varied from 76 mg/L to 224 mg/L (Fig. 2C), and fell in the range of 7 mg/L and 470 mg/L previously reported for Na+ in winery wastewater (Mosse et al., 2011 and references therein). Since grapevines are considered moderately sensitive to foliar injury from Na+, a concentration of 115 mg/L is recommended as the upper threshold when overhead irrigation is applied (Department of Water Affairs & Forestry, 1996; Howell & Myburgh, 2013). It is important to note that Na+ in the winery wastewater generally exceeded this threshold from September to November. As in the case of the K+, Na+ levels increased from February to May (Fig. 2C), and were highest in October and November. This is probably related to cleaning actions within the winery before the harvest period commenced.
Sodium adsorption ratio
The annual mean monthly SAR in the winery wastewater ranged from 2.4 to 9.0 (Fig. 2D), which falls within the SAR variation of 0.3 to 33.1 reported for winery wastewater (Mulidzi et al., 2009). However, the SAR in the wastewater from the collection pit fell outside the range of 3.5 to 7.9 reported in a more recent study (Conradie et al., 2014 and references therein). The SAR was generally within acceptable limits for the irrigation of grapevines, viz. < 10 (Richards, 1954; Myburgh, 2012). With regard to the General Authorisations of 2013, up to 500 m3 of wastewater may be irrigated on any given day, provided that the SAR is less than 5 (Department of Water Affairs, 2013). In general, SAR in the winery wastewater was below these norms. Since the SAR in the winery wastewater was lower than the limits prescribed by the General Authorisations, the water would be suitable for irrigation without treatment to reduce the sodicity hazard. The SAR increased gradually from January to September, with high values in October and November, which is in agreement with annual Na+ dynamics.
Correlation between water quality parameters
During the planning phase of the field experiment in which grapevines were to be irrigated with diluted winery wastewater, industry representatives decided that the dilution treatments had to be applied in terms of COD concentration. However, there was doubt as to whether the COD level per se would provide a reliable indication of the overall water quality, since other variables, e.g. pH, EC, K+, Na+ and SAR, also play an important role. The results of this study clearly show that pH (Fig. 3A) and EC (Fig. 3B) in winery wastewater could not be related to COD level. There was also no correlation between K+ concentration and COD level in the winery wastewater (Fig. 3C). Furthermore, at a specific COD level, the K+ concentration in the winery wastewater differed substantially. Consequently there also was no correlation between PAR and COD (Fig. 3D). As in the case of the K+, there was no correlation between Na+ in the winery wastewater and the level of COD (Fig. 3E). Similar to K+, the Na+ concentration varied substantially at a specific COD level. The SAR was not related to COD level (Fig. 3F). Although it was decided that the dilution treatments had to be applied in terms of COD, the COD level does not give an accurate indication of the other water quality variables. Taking all of the above-mentioned into consideration, it is clear that the COD level in the winery wastewater cannot be used to predict K+ and Na+ concentrations in winery wastewater diluted to different levels of COD.
There was no correlation between Na+ and K+ in the winery wastewater (Fig. 4A). Although there was a strong correlation between EC and K+ in the winery wastewater (Fig. 4B), the correlation between EC and Na+ was not as good (Fig. 4C). The best correlation was obtained between EC and K+ plus Na+ (Fig. 4D). These results indicate that the EC in the winery wastewater was strongly determined by the K+ concentration. This was to be expected, since K+ is usually the most abundant cation in winery wastewater. Furthermore, it was clear that the level of COD provided no indication of the salinity or sodicity hazard. Where irrigation is scheduled in such a way that that the organic matter is allowed to break down between irrigations, EC would be a more reliable indicator of the suitability for irrigation of vineyards and other crops than COD. The measurement of EC is also much quicker and less expensive than COD measurements, thereby making EC measurements more suitable for water quality assessment by wineries.
CONCLUSIONS
Although the COD concentration in winery wastewater is the preferred indicator of water quality for the South African wine industry, it did not provide a reliable indication of pH and EC. Furthermore, the COD level could not be used to estimate K+ and Na+ concentrations in the winery wastewater, as these levels differed substantially at a specific COD level. The level of COD also provided no indication of the salinity or sodicity hazard of the wastewater. The EC in the winery wastewater was strongly determined by the K+ concentration. This was to be expected, since K+ is usually the most abundant cation in winery wastewater. Therefore, EC would be a more reliable indicator of the quality of winery wastewater than COD concentration, particularly with regard to the concentrations of cation such as K+ and Na+. In addition, EC would be easier for winery staff to measure. The ratio of these monovalent cations to bivalent Ca2+ and Mg2+ is also an important consideration when determining the suitability of water for irrigation purposes. In addition to conforming to pH, EC and sodicity criteria, water application needs to be scheduled in such way that the applied organic matter is allowed to oxidise between irrigations. The foregoing aspects are critical for the sustainable irrigation of vineyards or other crops with diluted winery wastewater.
LITERATURE CITED
Anonymous, 2010. Winery wastewater re-use to irrigate Redgum plantations - Berri Estates. http://www.p2pays.org/ref/04/03314/ [ Links ]
Arienzo, M., Christen, E.W., Quayle, W. & Kumar, A., 2009a. A review of the fate of potassium in the soil-plant system after land application of wastewaters J. Hazard. Mater. 164, 415-422. [ Links ]
Arienzo, M., Quale, W.C., Christen, E. & Jayawardane, N., 2009b. Irrigating with winery wastewater? Developing soil stability thresholds and managing total cations. Aust. N.Z. Grapegrow. Winemak. October 86-88. [ Links ]
Baker, P. & Hinze, C., 2007. Winery wastewater treatment for vineyard irrigation re-use. Aust. N. Z. Grapegrow. Winemak. Annual Technical Issue, 41-45. [ Links ]
Bories, A. & Sire, Y., 2010. Impacts of winemaking methods on wastewaters and their treatment. S. Afr. J. Enol. Vitic. 31, 38-44. [ Links ]
Campos, C., Oron, G., Salgot, M., Gillerman, L. & Casals, G., 2000. Attenuation of microorganisms in the soil during drip irrigation with waste stabilization pond effluent. Water Sci. Technol. 42, 387-392. [ Links ]
Chapman, J.A., Correl, R.L. & Ladd, J.N., 1995. Removal of soluble carbon from winery and distillery wastewaters by application to soil. Aust. J. Grape Wine Res. 1, 39-47. [ Links ]
Clesceri, L.S., Greenberg, A.E. & Eaton, A.D., 1998. Standard methods for the examination of water and wastewater. American Public Health Association, Washington DC. [ Links ]
Conradie, A., Sigge, G.O. & Cloete, T.E., 2014. Influence of winemaking practices on the characteristics of winery wastewater and the water usage of wineries. S. Afr. J. Enol. Vitic. 35, 10-18. [ Links ]
Department of Water Affairs, 2013. Revision of general authorisations in terms of Section 39 of the National Water Act, 1998 (Act No. 36 of 1998), No. 665. Government Gazette No. 36820, 6 September. Department of Water Affairs, Pretoria, South Africa. [ Links ]
Department of Water Affairs and Forestry, 1996. South African water quality guidelines. Vol. 4. Agricultural use: Irrigation. CSIR Environmental Services. Department of Water Affairs and Forestry, Pretoria, South Africa. [ Links ]
Howell, C. & Myburgh, P., 2013. Permissible element concentrations in water used for grapevine irrigation (Part 1) - pH, N, P and cations. Wynboer Technical Yearbook, 56-58. [ Links ]
Kriel, W., 2008. Turning wine into water. Farmer's Weekly, 23 May, 26-27. [ Links ]
Kumar, A., Saison, C., Grocke, S., Doan, H., Correl, R. & Kookana, R., 2006. Impact of winery wastewater on ecosystem health-an introductory assessment. Report CSL 02/03. Grape and Wine Research Development Corporation/CSIRO Land and Water Science, Adelaide, Australia. [ Links ]
Laurenson, S., 2010. The influence of recycled water irrigation on cation dynamics in relation to the structural stability of vineyard soils. Dissertation, University of South Australia, G.P.O. Box 2471, Adelaide, 5001, Australia. [ Links ]
Laurenson, S., Bolan, N.S., Smith, E. & McCarthy, M., 2012. Review: Use of recycled wastewater for irrigating grapevines. Aust. J. Grape Wine Res. 18, 1-10. [ Links ]
Mosse, K.P.M., Patti, A.F., Christen, E.W. & Cavagnaro, T.R., 2011. Review: Winery wastewater quality and treatment options in Australia. Aust. J. Grape Wine Res. 17, 111-122. [ Links ]
Mulidzi, R., Laker, G., Wooldridge, J. & Van Schoor, L., 2009. Composition of effluents from wineries in the Western and Northern Cape provinces (Part 1): Seasonal variation and differences between wineries. Wynboer Technical Yearbook, 58-61. [ Links ]
Myburgh, P., 2012. Guidelines for vineyard irrigation with saline water. Wynboer Technical Yearbook, 94-96. [ Links ]
Myburgh, P.A., Lategan, E.L. & Howell, C.L., 2015. Infrastructure for irrigation of grapevines with diluted winery wastewater in a field trial. Water SA 41, 643-647. [ Links ]
Richards, L.A., 1954. Diagnosis and improvement of saline and alkaline soils. Agriculture Handbook No. 60, US Department of Agriculture, US Government Printing Office, Washington DC. [ Links ]
Sheridan, C.M., Glasser, D., Hildebrandt, D., Petersen, J. & Rohwer, J., 2011. An annual and seasonal characterisation of winery effluent in South Africa. S. Afr. J. Enol. Vitic. 32, 1-8. [ Links ]
Van Schoor, L.H., 2005. Guidelines for the management of wastewater and solid waste at existing wineries. Winetech, www.winetech.co.za. [ Links ]
Van Zyl, J., 1981. Irrigation (in Afrikaans). In: Burger, J. & Deist, J. (eds). Wingerdbou in Suid-Afrika. ARC Infruitec-Nietvoorbij, Stellenbosch, South Africa. [ Links ]
Submitted for publication: September 2015
Accepted for publication:October 2015
Acknowledgements: The project was initiated and funded by the Water Research Commission, and was co-funded by Winetech, THRIP TP 1208066038 and the Agricultural Research Council. We would like to thank Goudini Winery, for permission to work at their winery and in their vineyard, as well as for the grapes used for samples and winemaking. Further thanks go to Messrs. Willie and Daniël Botha for managing the vineyard and for their general assistance. Finally, the staff of the Soil and Water Science Programme at ARC Infruitec-Nietvoorbij are thanked for their technical support. Any opinions, findings and conclusions or recommendations expressed in any publication generated through THRIP-supported research are those of the author(s) and therefore the NRF/THRIP will not accept any liability in that regard.
* Corresponding author: E-mail address: howellc@arc.agric.za
