


Services on Demand
Article
 English (pdf)
 Article in xml format
 Article references
Indicators

Related links
-
 Cited by Google
 -
 Similars in Google
Share

 Permalink
South African Journal of Enology and Viticulture
On-line version ISSN 2224-7904
Print version ISSN 0253-939X
S. Afr. J. Enol. Vitic. vol.36 n.3 Stellenbosch 2015
An assessment of winery wastewater diluted for irrigation of grapevines in the Breede River Valley with respect to water quality and nutrient load
C.L. HowellI, *; P.A. MyburghI; E.L. LateganI; J.E. HoffmanII
IARC Infruitec-Nietvoorbij, The Fruit, Vine and Wine Institute, Private Bag X5026, 7599 Stellenbosch, South Africa
IIDepartment of Soil Science, Stellenbosch University, Private Bag X1, 7602 Matieland
ABSTRACT
Possible re-use of winery wastewater for irrigation was investigated in a field trial with micro-sprinkler-irrigated Cabernet Sauvignon/99 Richter in the Breede River Valley region of South Africa. Irrigation with winery wastewater diluted to 100, 250, 500, 1 000, 1 500, 2 000, 2 500 and 3 000 mg/L chemical oxygen demand (COD), respectively, was compared to irrigation with raw river water. Since the pH was lower than 6, the diluted wastewater could cause nutrient toxicity. The diluted winery wastewater did not pose any salinity hazard, as the electrical conductivity was well below 2 dS/m. For the given range of dilutions, the sodium adsorption ratio never exceeded 10, which indicates that the water posed no sodicity hazard. Sodium and Cl- never exceeded 115 and 150 mg/L, the respective upper thresholds for grapevines. With the exception of N, levels of H2PO4-, K+, Na+, Ca2+, Mg2+, HCO3-, SO42- and B3+ in the diluted wastewater increased with a decrease in dilution level. The N load in diluted winery wastewater appeared to be completely inadequate to supply the grapevine's requirements. In contrast, the P load in the winery wastewater diluted to 2 500 mg/L COD and higher would supply more than adequate P if the grape yield amounts to 10 t/ha Likewise, the dilution of winery wastewater to 250 mg/L COD and higher would supply more than adequate K+ if the grape yield amounts to 10 t/ha. However, K+ applied via the wastewater will only be beneficial if it is not leached from the root zone during winter.
Key words: Cabernet Sauvignon, chemical oxygen demand, electrical conductivity, pH, potassium, sodium adsorption ratio
INTRODUCTION
Wineries produce large volumes of low-quality wastewater, particularly during the harvest period. Reports on the actual volumes of wastewater generated by wineries are extremely limited. However, it is estimated that medium to large wineries generate more than 15 000 m3 of wastewater annually, whereas small wineries generate less than 15 000 m3 (Van Schoor, 2005 and references therein). Australian wineries generate about 3 to 5 m3 of wastewater per ton of grapes crushed, with high organic load, variable salinity and nutrient levels (Chapman et al., 1995; Mosse et al., 2011). Crushing approximately 50 000 tons of grapes annually generates about 175 000 m3 of wastewater at the Berri Estates Winery in the Riverland region of South Australia (Anonymous, 2010). Hence, their wastewater generation amounts to c. 3.5 m3 per ton of grapes. It can be estimated that the winery at Lutzville Vineyards generates about 1.1 m3 of wastewater per ton of grapes crushed. However, this relatively low value is misleading, since 50% of the wastewater is presumably lost to evaporation (Kriel, 2008).
Winery wastewater contains high levels of K+ and Na+ (Laurenson et al., 2012). Although various parameters may be used to evaluate winery wastewater, chemical oxygen demand (COD), pH, sodium adsorption ratio (SAR), electrical conductivity of the irrigation water (ECiw), Cl-, K+ and Na+ are considered to be important. A survey carried out to evaluate winery wastewater generated by the South African wine industry revealed that the water quality parameters vary substantially between wineries (Mulidzi et al., 2009). The variation in water quality parameters also occurs in wastewater produced by wineries all over the world (Conradie et al., 2014 and references therein). Furthermore, a strong seasonal variation in winery wastewater quality was observed in the South African industry (Mulidzi et al., 2009). A similar seasonal trend was reported for winery wastewater in Australia (Arienzo et al., 2009a). These trends were confirmed where effluents of two wineries were monitored frequently (Sheridan et al., 2011). Considering the legal requirements for irrigation water quality in South Africa, the results of the survey confirmed that the majority of South African wineries are not able to irrigate crops beneficially as part of the General Authorisations for irrigation with winery wastewater, unless the water is first subjected to an effective form of pre-treatment or unless there is relaxation of the General Authorisations (Department of Water Affairs & Forestry, 1996; Department of Water Affairs, 2013).
International requirements, as well as national legislation, are putting pressure on wine producers regarding the responsible management of their wastewater, which may have a large-scale detrimental impact on the environment. Most vineyards in the Western Cape need irrigation. Therefore, the ideal situation would be to implement the sustainable use of winery wastewater for wine grape irrigation by adding winery wastewater to existing irrigation water resources. This practice has already been performed by various wineries for decades. Until now, however, the impact of this practice has not been studied comprehensively. Currently, the Department of Water and Sanitation is drafting a new Authorisation for wineries. Depending on the permitted water quality limits and volumes stipulated by these authorisations, adding winery wastewater to current irrigation water may well become a more viable practice in the future. Re-using winery wastewater in this way will be beneficial, particularly where water shortages occur.
The objectives of this study were to determine whether winery wastewater quality could be improved by dilution with raw river water for irrigation, and to quantify the amount of plant nutrients applied via irrigation with the diluted water.
MATERIALS AND METHODS
Experiment vineyard
The re-use of winery wastewater for irrigation was investigated in a field trial with micro-sprinkler-irrigated Cabernet Sauvignon/99 Richter in the Breede River Valley region of South Africa. The locality is at 33° 41' latitude and has a Mediterranean climate. Based on the growing degree days (GDD) from September until March (Winkler, 1962), the specific locality is in a class V climatic region for wine quality potential (Le Roux, 1974). The vineyard is located on an alluvial flood plain of the Du Toitskloof Mountains. The sandy soil belongs to the Longlands form (Soil Classification Working Group, 1991). The soil was deep delved to 1.0 m before planting. Grapevines were planted 2.4 m χ 1.2 m and trained onto a four-strand lengthened Perold trellis (Booysen et al., 1992). Vertical shoot positioning was carried out to prevent the development of a sprawling canopy.
Experiment layout
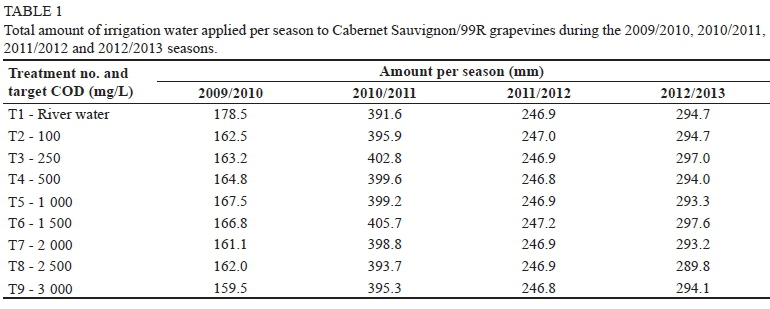
Irrigation with winery wastewater diluted to 100, 250, 500, 1 000, 1 500, 2 000, 2 500 and 3 000 mg/L COD with river water was compared to a control irrigated with river water (Table 1). All treatments were replicated three times in a randomised block design. Experiment plots comprised two rows of six grapevines each, with two buffer grapevines at each end and a buffer row on each side. Each experiment plot covered 104 m2. Treatments were applied from 2009/2010 until 2012/2013.
Irrigation volumes applied
Details of the irrigation infrastructure, as well as the dilution procedures, have been reported elsewhere (Myburgh et al., 2015). Due to the delayed completion of the infrastructure installation in the 2009/2010 season, the application of the diluted wastewater treatments was only possible after harvest. In the following years, the wastewater irrigation treatments were applied from mid-February, when high volumes of wastewater usually become available as the harvest period begins in the Breede River valley. After each wastewater irrigation application, grapevines were also irrigated with river water to flush the irrigation pipes. Grapevines were generally irrigated at c. 50% plant available water (PAW) depletion to prevent excessive vegetative growth and yield reduction. Irrigation had to be applied every two weeks to maintain this PAW depletion level. Irrigation was terminated either in mid-April or the beginning of May each year, when the wastewater volumes decreased and the first winter rains began. Water meters were used to monitor the irrigation volumes applied to each treatment. Grapevines of all treatments, including those of the control, received the same volume of water per irrigation.
Water quality
Approximately one hour after a wastewater irrigation started, a 500 mL water sample was collected from each of the eight dilution tanks to verify actual COD levels obtained for each of the eight dilution treatments. A 500 mL sample of the river water was collected at the same time. Samples of the undiluted winery wastewater from the stock dam and river, as well as the samples from the eight dilution tanks, were analysed by a commercial laboratory for pH, ECiw, NH4+-N, NO3--N, H2PO4-, Ca2+, Mg2+, K+, Na+, Cl-, HCO3-,"SO42-, B3+, Fe2+ and heavy metals according to methods described by Clesceri et al. (1998). The COD in samples was measured using a portable spectrophotometer (Aqualitic COD-reactor®, Dortmund) with the appropriate test kits (COD, CSB, 0-15 000 mg/L). The potassium adsorption ratio (PAR) was calculated as follows:

where K+ is the potassium concentration (mg/L) divided by the molecular mass, i.e. 39 g/mol, Ca2+ is the calcium concentration (mg/L) divided by the equivalent molecular mass, i.e. 20 g/mol, and Mg2+ is the magnesium concentration (mg/L) divided by the equivalent molecular mass, i.e. 12.15 g/mol. Similarly, the sodium adsorption ratio (SAR) was calculated as follows:

where Na+ is the sodium concentration (mg/L) divided by the molecular mass, i.e. 23 g/mol. The NH4+-N and NO3---N concentrations were summed to obtain the total N. No N determinations were carried out in the 2009/2010 season. The assessment of the microbial status of the winery wastewater, as well the diluted waters, was beyond the scope of the study.
Amount of elements applied
For the diluted wastewater treatments, i.e. T2 to T9, the amount of wastewater applied was converted from mm to L per ha as follows:

where I is the amount of irrigation applied (mm) and 104 is the factor used to convert depth of water (mm) to volume (L) per hectare (1 mm = 10 m3 per ha = 104 L per ha).
For each treatment, the element concentrations in the diluted wastewater were used to calculate the amounts of elements added to the soil per irrigation per hectare, as follows:

where m is amount of the element (mg/ha), V is the volume of water applied per hectare (L) and Ce is the element concentration (mg/L) in the irrigation water.
In addition, the contribution of the elements deposited by the river water was taken into account. The same procedure was followed for T1, i.e. the river water control treatment. The amount of element in milligram per hectare was converted to kilogram per hectare (M), as follows:

The amount of elements applied per irrigation were summed to obtain the seasonal application.
Statistical analysis
Mean values and standard deviations were calculated for pH, ECiw. , H2PO4-, Ca2+, Mg2+, K+, Na+ and SAR for each season, namely 2009/2010, 2010/2011, 2011/2012 and 2012/2013. In the case of total N, means and standard deviations were calculated for the 2010/2011, 2011/2012 and 2012/2013 seasons. For Cl-, HCO3-, SO42-, B3+ and Fe2+, means and standard deviations were calculated as the average over the four seasons.
RESULTS AND DISCUSSION
Irrigation volumes applied
A full tank of diluted winery wastewater applied c. 41 mm irrigation to the three replication plots of each treatment. Grapevines of all treatments received the same mean volume of wastewater per irrigation when a full tank of wastewater was applied to the plots. Due to low COD levels in the winery wastewater in the middle of April in the 2010/2011 season, T3 to T9 had to be applied in two irrigations on consecutive days to apply the required COD. The COD applied on these consecutive days were summed. Due to low COD levels in the winery wastewater, as well as limited available water, only 1/3 of a tank of diluted water could be applied to each treatment on 2 May in the 2011/2012 season. This data was therefore not considered for the calculation of the average mean volume of wastewater applied per irrigation. Grapevines of the diluted wastewater treatments received only c. 25 mm, 14 mm and 8 mm of river water per irrigation in 2010/2011, 2011/2012 and 2012/2013 respectively. The amount of river water applied following wastewater irrigations was considerably less in 2012/2013 than in previous years, since it was decided to follow a continuous deficit irrigation strategy to minimise drainage losses and to curtail possible excessive vegetative growth. The total seasonal irrigation water amounts applied are presented in Table 1.
Water quality
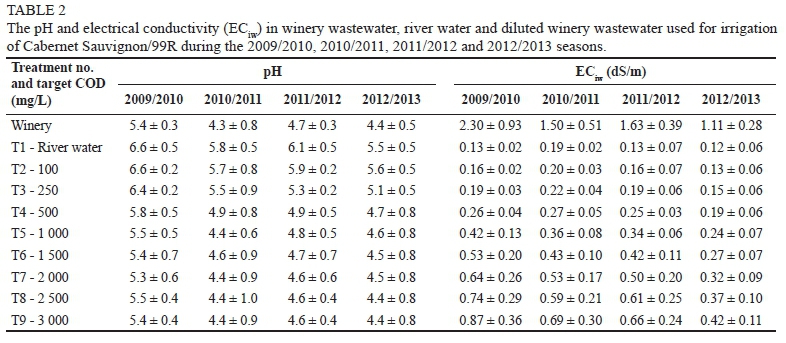
During the four seasons, water pH tended to decrease with a decrease in the dilution of the wastewater, i.e. an increase in the COD level of the water (Table 2). The pH of the river water (T1) was generally the highest, whereas pH in winery wastewater diluted to COD levels of 1 500 mg/L and higher were comparable to the undiluted winery wastewater, i.e. T5 to T9. In general, water pH levels tended to be below the recommended pH for irrigation water, which ranges from 6.5 to 8.4 (Department of Water Affairs & Forestry, 1996). It should be noted that, even though the pH of the river water was higher than the diluted wastewater treatments, at times it was also below the recommended levels for irrigation. With regard to the General Authorisations of 2013, up to 500 m3 of wastewater may be irrigated on any given day, provided that the pH is between 6 and 9 (Department of Water Affairs, 2013). Due to the low pH (Table 2), problems with the corrosion of metals and concrete used in irrigation systems and infrastructure can be expected when the irrigation water has a pH below 6.5 (Department of Water Affairs & Forestry, 1996). The diluted wastewater could also cause problems, such as Al3+, Mn2+ and heavy metals being mobilised to concentrations high enough to be toxic to grapevines if used for irrigation (Howell & Myburgh, 2013). The foregoing indicates that the dilution of winery wastewater did not have any positive effect on pH in terms of irrigation water quality, irrespective of the level of dilution.
The ECiw increased with a decrease in the level of dilution of the wastewater (Table 2). This indicates that there was an increase in salt levels with a decrease in the dilution of the wastewater. Furthermore, the ECiw in the least diluted water, i.e. wastewater diluted to a COD level of 3 000 mg/L, was still substantially lower compared to the undiluted winery wastewater. This trend was consistent for all four seasons. On 2010-04-12, the ECiw in the wastewater diluted to 2 000 mg/L COD and higher, i.e. T7, T8 and T9 (data not shown), exceeded the critical value of 0.75 dS/m, which is the salinity threshold for water used for grapevine irrigation (Van Zyl, 1981; Myburgh, 2012). This salinity threshold was also exceeded in wastewater diluted to a COD level of 3 000 mg/L (T9) on 2010-05-03 (data not shown). The ECiw in the T7, T8 and T9 waters, i.e. wastewater diluted to COD levels of 2 000 mg/L and higher, exceeded the critical value of 0.75 dS/m on 2011-04-14 and 2012-05-02 (data not shown). In 2012/2013, the ECiw did not exceed the critical value of 0.75 dS/m. In general, ECiw in the diluted winery wastewaters was well below 2 dS/m, i.e. the norm according to the General Authorisations of 2013 (Department of Water Affairs, 2013). Given that the EC in the undiluted water was close to 2 dS/m, the dilution of winery wastewater had a positive effect on the salinity hazard in terms of irrigation water quality.
With the exception of the first season, the mean COD levels in the diluted winery wastewater were generally close to the target values (data not shown). In general, the COD in the diluted winery wastewaters was well below the norms stipulated by the General Authorisations of 2013 (Department of Water Affairs, 2013). Given that the COD in the undiluted winery water was generally not lower than 7 624 mg/L, the dilution of winery wastewater had a positive effect on the COD in terms of irrigation water quality.
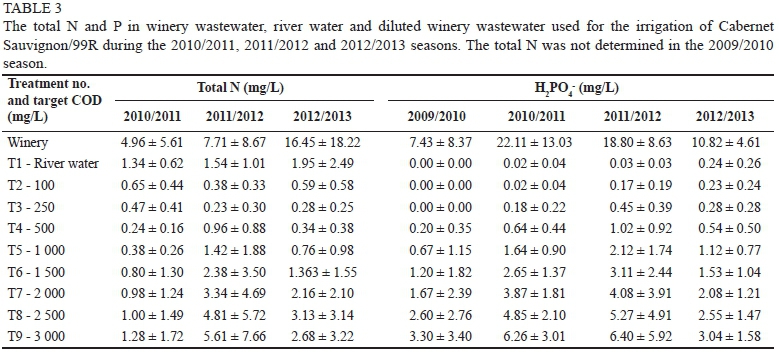
In general, there were no consistent trends with regard to NH4+-N, NO3--N (data not shown) and total N concentrations, which could be related to the level of dilution (Table 3). However, it was evident that the N levels in the river water were higher compared to that of some of the diluted wastewater treatments. At this stage there is no explanation for the latter trend. Levels of H2PO4- in the diluted wastewater treatments increased with a decrease in level of dilution (Table 3). Although there are no guidelines for H2PO4- levels in irrigation water, a long-term critical value of 0.05 mg/L has been recommended by ANZECC (2000). This norm has been established to minimise the risk of algal blooms developing in storage facilities and to reduce the likelihood of bio-fouling (biological fouling) in irrigation equipment. The levels in the diluted wastewaters, as well as undiluted winery wastewater, generally exceeded this norm (Table 3), thereby indicating that H2PO4- in winery wastewater may induce algal blooms. Since the latter could cause problems in irrigation systems, the dilution of the winery wastewater did not seem to have had any positive effect in terms of H2PO4-concentration.
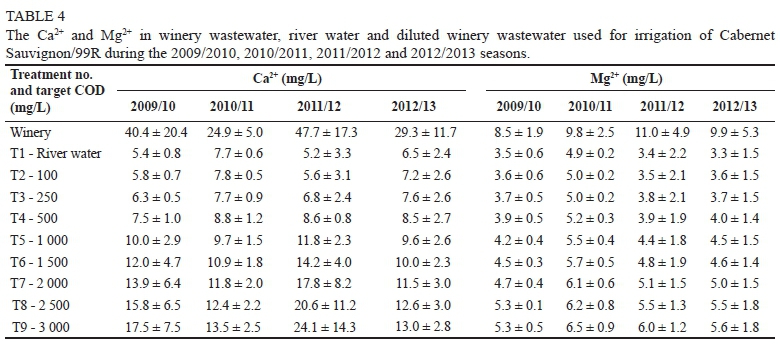
The levels of Ca2+ increased with a decrease in the dilution of the winery wastewater (Table 4). There are no guidelines for Ca2+ levels in irrigation water (Department of Water Affairs & Forestry, 1996). However, it is important to determine the Ca2+ levels to calculate the SAR. As Ca2+ is beneficial, rather than harmful, to soil structure, it may ameliorate the impacts of Na application indirectly via its role in reducing the SAR. However, if the Ca2+-to-Mg2+ ratio in the water is less than one, the potential negative effects of Na+ may be exacerbated (Ayers & Westcott, 1985). Magnesium concentrations increased with a decrease in the dilution of the winery wastewater (Table 4), but there were no substantial differences in Mg2+ levels with regard to the dilution treatments. There are no guidelines for Mg2+ levels in irrigation water (Department of Water Affairs & Forestry, 1996). Similar to Ca2+, Mg2+ can also play an indirect, positive role in reducing the SAR. On the negative side, crops irrigated with water containing high levels of Mg2+ may produce low yields due to Mg2+-induced Ca2+ deficiencies, but there is still insufficient data to make the Ca2+-to-Mg2+ ratio an evaluation factor (Ayers & Westcott, 1985). However, should this ratio be less than one, or the Ca2+-to-total-cation ratio less than 0.15, the potential negative effects of Na+ may be exacerbated (Ayers & Westcott, 1985). If this is the case, a further evaluation of the water is required. Under the conditions of this study, the Ca2+-to-Mg2+ ratio was consistently higher than one (data not shown). Therefore, it is expected that the high Ca2+-to-Mg2+ ratios would have suppressed any possible negative effects of Na.
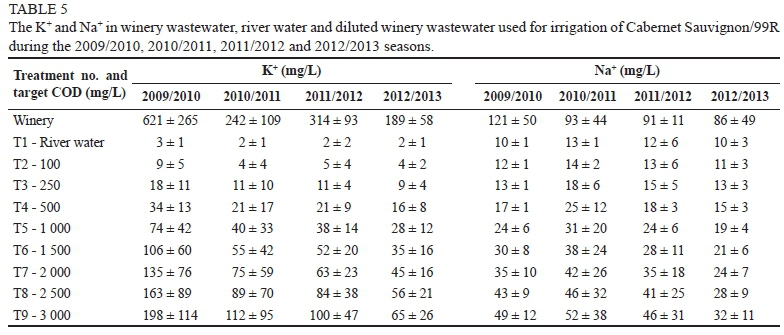
The K+ concentrations in the diluted wastewater increased substantially with a decrease in dilution, i.e. an increase in the COD level of the water (Table 5). Mulidzi et al. (2009) tentatively considered 200 mg/L K+ in winery wastewater as being high. In terms of this norm, the K+ levels in the diluted wastewater were generally not high. Given that the K+ concentrations in the diluted wastewater were still substantially lower than in the undiluted wastewater, dilution had a positive effect on the K+. It should be borne in mind that the K+ in the wastewaters could make an important contribution to the K+ nutrient requirements of the grapevine. On the negative side, it must be noted that increasing the amount of K+ may result in a decrease in the hydraulic conductivity and infiltration rate of soils (Levy & Van der Watt, 1990). There is a broad spectrum of possible effects of K+ on infiltration, ranging from being similar to Na+ to being similar to Ca2+. Furthermore, it was concluded that, relative to Caex and Naex, Kex had an intermediate effect on the soil hydraulic properties (Arienzo et al., 2009b). According to Laurenson et al. (2012), the PAR has been less widely adopted than the SAR, as K+ is low in most wastewaters. However, the PAR has proved important for wastewaters of high K+ concentration, i.e. piggery, meat-processing and winery wastewaters (Smiles & Smith, 2004). The PAR in the diluted wastewater increased with a decrease in the level of dilution (data not shown). All the values, with only one exception, were lower than the values of 2.1 to 3.2 reported for winery wastewater by Laurenson et al. (2012). These values were generally lower than the PAR values, ranging from 3.7 to 43, reported for a winery in Australia (Arienzo et al., 2009b). It was previously shown that soil hydraulic conductivity was considerably reduced when the PAR exceeded 20 in a laboratory study (Arienzo et al., 2009b). These negative effects occurred even when the electrolyte concentrations in the soil were relatively high, i.e. > 40 meq/L. However, it was also shown that the negative effect of Na+ was more pronounced compared to K+ at the same electrolyte concentration.
As the field work progressed, it became evident that the Na+ concentration in the river water used for dilution was consistently high. Sampling water at three places along the course of the Holsloot River during the 2012/2013 season (data not shown) revealed that the Na+ levels increased substantially along the floodplain during summer, up to the point where the water was abstracted near the Goudini winery. However, the Na+ concentrations in spring (September) were more comparable along the course of the river, probably due to the high flow that occurred in the winter. Since no definite point of contamination could be identified, the Na+ probably became more concentrated under low flow conditions. As expected, Na+ levels in the diluted wastewaters increased substantially with a decrease in dilution of the winery wastewater (Table 5). Grapevines are considered moderately sensitive to foliar injury from Na+. Therefore, a concentration of 115 mg/L Na+ in the water is recommended as the upper threshold for overhead irrigation (Department of Water Affairs & Forestry, 1996). As the experiment vineyard was irrigated by means of micro-sprinklers, the leaves were not expected to be wetted during irrigation. However, the Na+ levels in the diluted wastewater treatments were so low that, even if the leaves were wetted, no substantial damage would be expected. The abovementioned Na+ threshold was exceeded only on one occasion during the 2010/2011 season, when the Na+ concentration amounted to 124 mg/L in winery wastewater diluted to a COD level of 3 000 mg/L (data not shown). In general, the levels of Na+ in the undiluted wastewater also did not exceed the threshold (Table 5).
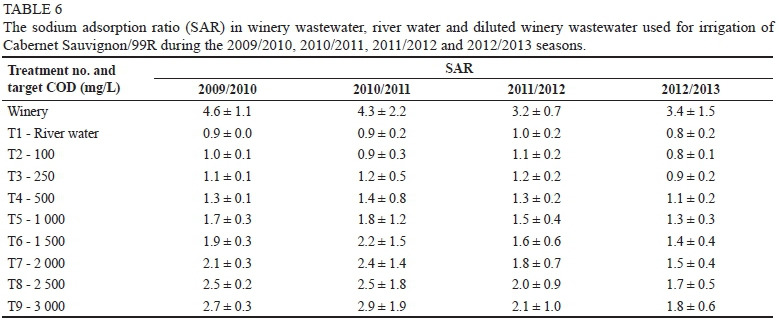
As expected, the SAR increased with a decrease in the level of dilution of the wastewater (Table 6). Since the Ca2+ and Mg2+ also increased, this suggests that the increase in these cations could not counterbalance the effect of increased Na+ on the SAR. The SAR norm stipulated by the General Authorisations of 2013 (Department of Water Affairs, 2013) was only exceeded on 2011-04-14, when the SAR of the irrigation waters diluted to COD levels of 1 500 mg and higher was more than 5 (data not shown). Furthermore, the SAR in the diluted winery wastewaters was still within acceptable limits for grapevine irrigation, i.e. less than c. 10 (Richards, 1954; Myburgh, 2012). The foregoing shows that the diluted winery wastewater would pose no sodicity hazard if used for irrigation under the given conditions. It must be noted that the SAR in the undiluted winery wastewater also did not exceed the acceptable threshold for grapevine irrigation (data not shown).
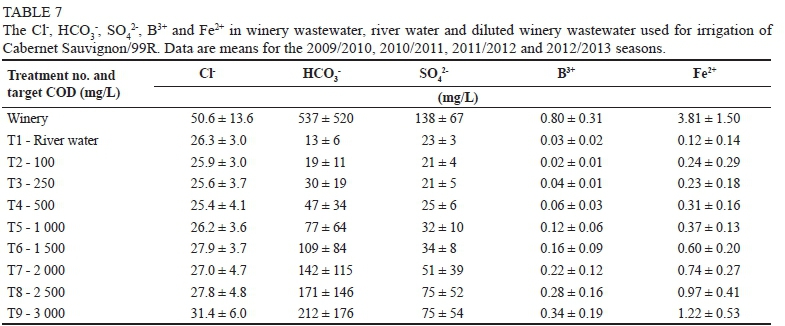
Similar to Na+, it became evident that the Cl- concentrations in the river water used for dilution were consistently high. Sampling water along the course of the Holsloot River during the 2012/2013 season revealed that the Cl- levels increased substantially during summer along the floodplain up to the point where water was abstracted near the winery (data not shown). However, the Cl- concentrations in spring were more comparable along the course of the river, probably due to high flow in the winter. Since no definite point of contamination could be identified, the Cl- probably became more concentrated under low flow conditions. Although the Cl- concentrations in the diluted waters were lower than that of the undiluted winery wastewater, the range of dilutions did not cause any consistent trends with respect to the level of dilution (Table 7). Levels in both the diluted and undiluted winery wastewater were substantially lower than 150 mg/L and 700 mg/L, which are the threshold for grapevine root uptake and overhead irrigation respectively (Van Zyl, 1981). This suggests that Cl- levels in the diluted wastewater would not have caused damage to the grapevines, even if the leaves were wetted. Although the HCO3- concentration increased with a decrease in the dilution of the wastewater, the concentrations varied considerably between seasons, i.e. high standard deviation values (Table 7). Similarly, the HCO3- concentration also showed large variation within a season. The reason for the variability is uncertain. However, the concentration in the least diluted water (T9) was still substantially lower compared to the undiluted winery wastewater. When irrigations were applied on 2011-02-09, 2011-03-30, 2012-03-06 and 2012-03-19, no trends with regard to the level of dilution were evident for HCO3-concentrations in the water (data not shown). Throughout the 2012/2013 season, no trends were evident for HCO3- levels in the water, with the exception of on 2013-04-30 (data not shown). At this stage, there is no explanation why the HCO3-level did not increase with a decrease in the level of dilution on these days.
Irrigation water containing high levels of HCO3- can negatively affect plants, soils and irrigation systems. Irrigation waters that contain high levels of HCO3- and CO32- can increase HCO3- in the soil solution. Consequently, Ca2+ and Mg2+ can precipitate as insoluble carbonates when the soil dries out (Van Zyl, 1981; McCarthy et al., 1988). According to the norms proposed for HCO3- concentrations in overhead irrigation water, values lower than 91.5 mg/L (1.5 me/L) indicate no restriction when used, whereas levels between 91.5 mg/L and 518.6 mg/L (8.5 me/L) indicate a slight to moderate degree of restriction when used (Ayers & Westcott, 1985). In the first season, dilutions above 500 mg/L COD contained excessive levels of HCO3-, whereas in the second and third seasons, dilutions above 1 000 mg/L COD contained excessive HCO3- (data not shown). In contrast, the HCO3- levels fell into the no restriction category during the 2012/2013 season. There are no recently recommended guidelines (Department of Water Affairs & Forestry, 1996; ANZECC, 2000).
Although the SO42- in the diluted irrigation waters generally increased with a decrease in the level of dilution of the wastewater, the levels in the least diluted water (T9) were substantially lower compared to those in the winery wastewater (Table 7). Similar to HCO3-, the SO42-concentrations varied considerably between seasons (Table 7), and within a season (data not shown). The reason for the variability is also uncertain. In general, SO42- levels in the diluted winery wastewater were below the proposed level of 150 mg/L and lower for reclaimed effluent water quality standards for vineyard re-use (Ryder, 1995). In the 2009/2010 and 2011/2012 seasons, SO42- levels in the undiluted wastewater were above this optimum level, but still lower than the maximum threshold of 250 mg/L.
The B3+ levels in the diluted wastewater increased with a decrease in level of dilution (Table 7). Concentrations in the least diluted water were still substantially lower than those in the undiluted winery wastewater. Although B3+ is essential for the growth of plants, it reaches toxic levels at low concentrations. Grapevines have been classed as sensitive (Ayers & Westcott, 1985; Department of Water Affairs & Forestry, 1996; ANZECC, 2000) to highly sensitive (Van Zyl, 1981) with regard to B toxicity. In general, B3+ levels of 0.5 mg/L are considered ideal for vineyard irrigation (McCarthy et al., 1988), whereas levels under 0.75 mg/L have been recommended by Ayers and Westcott (1985). On 2011-04-13, the limit of 0.5 mg/L was only exceeded where winery wastewater was diluted to 3 000 mg/L (T9), whereas on 2011-04-14, winery wastewater diluted to 1 500 mg/L and more (T6 to T9) exceeded this limit (data not shown). It should be noted that, due to low COD levels in the winery wastewater in April 2011, the range of COD levels had to be made up and applied on two consecutive days. On 2012-0502, diluted winery wastewater of 1 000 mg/L and higher (T5 to T9) also exceeded the limit of 0.5 mg/L. The foregoing shows that diluted winery wastewater has a sporadic risk of inducing B3+ toxicity if used for vineyard irrigation. The Fe2+ levels increased with a decrease in the dilution of the wastewater, but the level in the least diluted wastewater was still substantially lower compared to the undiluted winery wastewater (Table 7). Recommended maximum levels of Fe2+ in irrigation water for continuous irrigation on all soils is 5 mg/L (Van Zyl, 1981). With the exception of the 2011/2012 season, Fe2+ levels in the undiluted wastewaters never exceeded this value. However, the Fe concentration becomes important in the case of drip irrigation, where major clogging problems can be expected when Fe2+ levels are higher than 1.5 mg/L (Department of Water Affairs & Forestry, 1996). Given the low Fe2+ concentrations in the diluted wastewater, it would not cause clogging of micro-sprinkler systems under the prevailing conditions.
Amount of elements applied
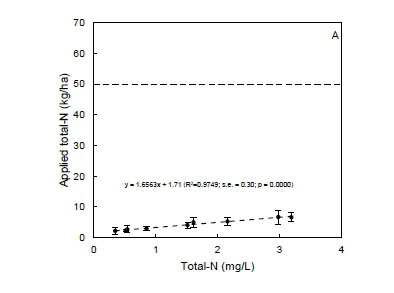
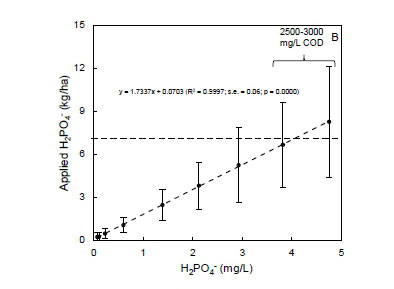
In terms of total N, amounts added via the irrigation water were generally higher for T9 compared to the river water control (T1), but trends across the range of COD levels were inconsistent (Table 8). The total N applied via the winery wastewater diluted to 2 000 mg/L COD and higher was similar to the estimated c. 5 kg N/ha applied via winery wastewater based on an irrigation depth of 100 mm (Laurenson et al., 2012). Full-bearing grapevines annually require 50 kg N if 10 to 15 tons of fruit is produced per ha (Conradie, 1994). Based on this recommendation, the amount of N applied via the diluted wastewater appeared to be completely inadequate to supply the grapevine's annual N requirement under the prevailing conditions (Fig. 1A). Therefore, winery wastewater cannot be considered as a source of N. The amount of H2PO4- applied via the irrigation water increased with a decrease in wastewater dilution (Table 8). The H2PO4- applied via the winery wastewater diluted to 2 000 mg/L COD and higher was similar to the estimated c. 5.3 kg P per ha applied via winery wastewater based on an irrigation depth of 100 mm (Laurenson et al., 2012). Full-bearing grapevines annually require 0.7 kg P per ton of fruit produced (Conradie, 1994). Based on this recommendation, the amount of P applied via the winery wastewater diluted to 2 500 mg/L COD and higher would supply adequate P during most seasons if the grape yield amounted to 10 t/ha under the prevailing conditions (Fig. 1B).
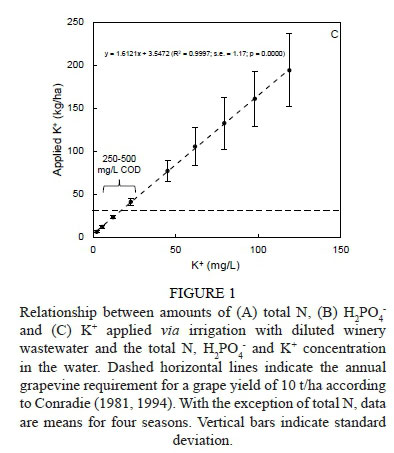
The amount of K+ applied per hectare increased substantially with a decrease in dilution of the winery wastewater (Table 8). In 2010/2011 and 2012/2013, similar amounts were applied in the pre- and post-harvest periods (data not shown). Since only one irrigation was applied in the post-harvest period of 2011/2012, amounts of K+ added via the irrigation water were substantially less than during the pre-harvest period (data not shown). In general, K+ applied via winery wastewater diluted to 2 500 mg/L and higher was more than the estimated 129 kg K+ per hectare applied via winery wastewater based on an irrigation depth of 100 mm (Laurenson et al., 2012). Full-bearing grapevines annually require 3 kg K+ per ton of fruit produced (Conradie, 1994). Based on this recommendation, the amount of K+ applied via winery wastewater diluted to 250 mg/L COD and higher would supply more than adequate K+ if the grape yield amounted to 10 t/ha under the prevailing conditions (Fig. 1C). As the grapevine's nutrient requirements are generally low during the harvest and post-harvest periods (Conradie, 1981), the K+ supplied via the wastewater will only be beneficial if it is not leached from the root zone during winter. On average, between 47 kg/ha and 164 kg/ha K+ was applied in excess to the soil where the winery wastewater was diluted to COD levels ranging from 1 000 mg/L (T5) to 3 000 mg/L (T9).
The effect of high concentrations of K+ applied to soils, as well as the fate of K in soils and grapevines irrigated with winery wastewater, has received limited attention (Mosse et al., 2011; Laurenson et al., 2012). However, excessive K+ applied via the diluted winery wastewater could have several implications. Excessive K+ in grape berries can be detrimental to wine quality, as it decreases free tartaric acid (Mpelasoka et al., 2003). Subsequently, the pH in grape juice, must and wine will increase (Saayman, 1981; Mpelasoka et al., 2003). Excessive K+ in fruit also causes the formation of insoluble potassium bitartrate (Laurenson et al., 2012).
The increase in pH causes unstable musts and wines, as well as a reduction in the degree of ionisation of anthocyanins (Mpelasoka et al., 2003). The increase in berry pH in hot climates produces grape juice with a high pH, which has a flat taste and possible brown hue (Kodur, 2011; Laurenson et al., 2012). In addition to these grapevine responses, excessive K+ can reduce juice N (Saayman, 1981), thereby increasing the risk of stuck fermentation during the winemaking process. Excessive K+ can also reduce Ca2+ and Mg2+ in the grapevine, indicating antagonisms between K+ and these elements (Morris & Cawthon, 1982; Wolf et al., 1983; Myburgh & Howell, 2014). Given that the amounts of K+ applied via the diluted winery wastewater were much higher than the requirements of the grapevine, the cultivation of an interception crop during summer might be useful to absorb excessive K+.
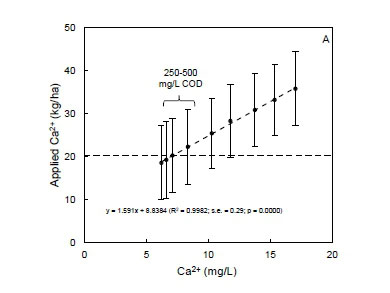
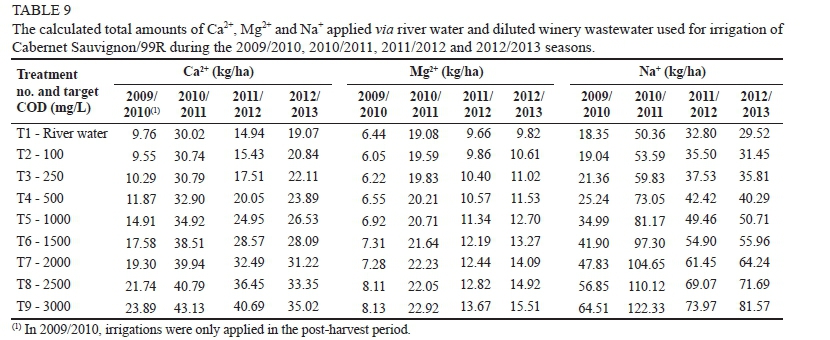
The amounts of Ca2+ and Mg2+ applied increased with a decrease in dilution of the winery wastewater (Table 9), but differences between the highest level of dilution, i.e. T2, and the lowest level of dilution, i.e. T9, were not as substantial as in the case of K+ and Na+ (Tables 8 & 9). Full-bearing grapevines require c. 2 kg Ca2+ annually per ton of fruit produced (Conradie, 1981). Based on this recommendation, the amount of Ca2+ applied via winery wastewater diluted to 500 mg/L COD and higher would supply more than adequate Ca2+ if the grape yield amounted to 10 t/ha under the prevailing conditions (Fig. 2A). As the grapevine's nutrient requirements are generally low during the harvest and post-harvest periods (Conradie, 1981), the Ca2+ supplied via the wastewater will only be beneficial if it is not leached from the root zone during winter. Furthermore, bunches require no Ca2+ during véraison and harvest. With regard to Mg2+, 0.7 kg is required per ton of grapes produced. Under the prevailing conditions, all of the treatments supplied sufficient Mg2+ to supply the grapevine's requirements (Fig. 2B). The amounts of Na+ applied per hectare increased substantially with a decrease in level of dilution of the winery wastewater (Table 9). In 2010/2011 and 2012/2013, similar amounts were applied in the pre- and post-harvest periods (data not shown). As there was only one irrigation in the 2011/2012 post-harvest period, the amounts of Na+ added via the irrigation water were substantially less than during the pre-harvest period (data not shown). The total amounts of Na+ added via the irrigation water ranged from 32 kg/ha for the river water control (T1) to 85 kg/ha for the least diluted water, viz. 3 000 mg/L COD (Fig. 2C). Although there are no threshold values for grapevines with regard to the amount of Na+ applied per hectare, it is well known that excessive Na+ can reduce vegetative growth, yield and suppress Ca2+ uptake (Myburgh & Howell, 2014 and references therein).


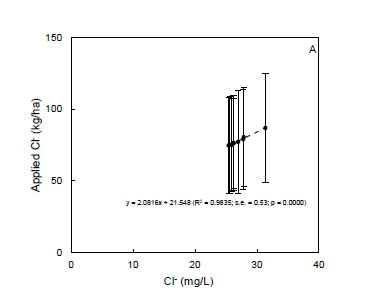
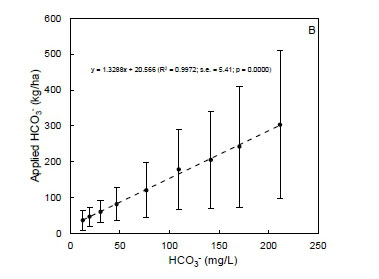
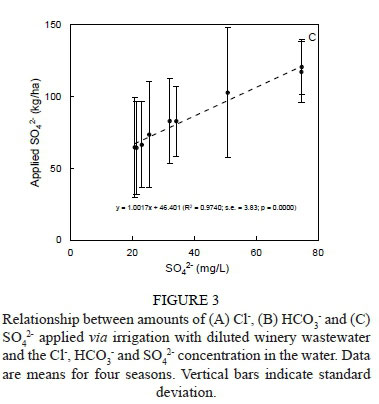
Although the amounts of Cl- added via the irrigation water were higher for T9 compared to the river water control (T1), increases across the COD levels were inconsistent (data not shown). It should be noted that the river water also contained relatively high levels of Cl (Table 5). The total amounts of Cl- added via the irrigation water ranged from 76 kg/ha for the river water control to 87 kg/ha for the least diluted water, viz. 3 000 mg/L COD (Fig. 3A). Although there are no threshold values for grapevines with regard to amount of Cl- applied per hectare, excessive Cl- can reduce vegetative growth and yield (Myburgh & Howell, 2014 and references therein). In 2010/2011 and 2011/2012 there was a substantial increase in HCO3- applied per ha with a decrease in dilution of the wastewater (data not shown). The total amounts of HCO3- added via the irrigation water ranged from 36 kg/ha for the river water control to 303 kg/ha for the least diluted water, viz. 3 000 mg/L COD (Fig. 3B). In general, the amount of SO42- applied increased with increasing level of COD (data not shown). The total amounts of SO42- added via the irrigation water ranged from 66 kg/ha for the river water control to 117 kg/ha for the least diluted water, viz. 3 000 mg/L COD (Fig. 3C).
Despite low levels of B3+ being applied via the irrigation water, amounts increased with a decrease in level of dilution of the winery wastewater (data not shown). According to Conradie (1994), the requirements of the grapevine for B3+ are relatively low. Under the prevailing conditions, less than 1 kg of B3+ was applied via the diluted winery wastewater. The amounts of Fe2+ applied per hectare increased with a decrease in the level of dilution of the winery wastewater (data not shown). According to Conradie (1994), the requirements of the grapevine for Fe2+ are relatively low. Under the prevailing conditions, c. 2 kg of Fe2+ per ha was applied via the diluted winery wastewater. The concentrations of Cd2+, Cr2+ and As-3 in the undiluted winery wastewater were extremely low, therefore amounts applied via the diluted winery wastewater were low (data not shown). Furthermore, the heavy metals did not show any trends with regard to level of dilution.
CONCLUSIONS
In previous studies, artificial "winery wastewater" was used. Furthermore, most of these studies were carried out in laboratories. This study was the first in which wastewater from a commercial winery was diluted with raw river water to a range of COD levels for vineyard irrigation at field scale. Since the pH in the diluted wastewater was lower than 6, it could induce nutrient toxicity if used for the irrigation of vineyards or other crops. The results indicate that the dilution of winery wastewater did not have any positive effect on pH with respect to irrigation water quality. The diluted winery wastewater did not pose any salinity hazard, since ECiw was well below 2 dS/m. As the EC in the undiluted water was close to 2 dS/m, the dilution of winery wastewater reduced the salinity hazard with respect to irrigation water quality. Given the fact that the COD in the undiluted winery water generally was not lower than 7 624 mg/L, the dilution of winery wastewater had a positive effect on the COD in terms of irrigation water quality. The K+ concentrations in the diluted wastewater were substantially lower than in the undiluted wastewater. The K+ levels in the diluted wastewater were generally not high for winery wastewater, i.e. less than 200 mg/L. It must be noted that the K+ in the wastewater could make a contribution to the K+ requirements of the grapevine, i.e. if it was not lost via leaching during winter. For the given range of wastewater dilutions, the SAR never exceeded 10, which indicates that the diluted wastewater posed no sodicity hazard. Sodium and Cl- never exceeded 115 and 150 mg/L, i.e. the respective upper toxicity thresholds of these elements for grapevines.
Considering the classical water quality criteria, viz. pH, EC and SAR, the dilution of winery wastewater up to a COD level of 3 000 mg/L produced irrigation water of which the quality would permit sustainable vineyard irrigation under the prevailing conditions, viz. a Mediterranean climate with high winter rainfall and sandy soil. As expected, the levels of H2PO4-, K+, Na+, Ca2+, Mg2+, HCO3-, SO42- and B3+ in the diluted wastewater increased with a decrease in the level of dilution. In contrast, levels of N and Cl- were inconsistent with regard to the level of dilution. The B3+ concentrations in the undiluted winery wastewater indicated a potential risk of inducing B toxicity if used for vineyard irrigation. Since B3+ levels in the least diluted wastewater exceeded the recommended norm sporadically, there is still a slight risk of B3+ toxicity which should not be ignored. The results indicated that SO42- levels in the diluted winery wastewater were below the proposed level of 150 mg/L for effluent water quality standards for vineyard re-use. Since one of the incentives for diluting winery wastewater is that it could serve as a possible nutrient source, it is important to note that the N load in the diluted winery wastewater was completely inadequate to supply the grapevine's annual requirement. On the positive side, P loads in the winery wastewater diluted to 2 500 mg/L COD and higher could supply more than adequate P if the grape yield amounted to 10 t/ha.
Likewise, the dilution of winery wastewater to 250 mg/L COD and higher could supply more than adequate K+ if grape yield amounted to 10 t/ha. However, the excessive K+ applied via the diluted wastewater could increase juice pH, which could cause unstable musts and wines, as well as a reduction in the degree of ionisation of anthocyanins in the wine. Furthermore, excessive K+ application could induce nutrient imbalances in the grapevine tissues, particularly antagonisms with respect to N, Ca2+ and Mg2+. Given that the amounts of K+ applied via the diluted winery wastewater were considerably higher than the grapevine's requirements, the cultivation and removal of a suitable interception crop during summer might be useful to absorb excessive K+. Since grapevine nutrient requirements are generally low during the harvest and post-harvest periods, the N, P and K+ supplied via the wastewater will only be beneficial if they are not leached from the root zone during winter. Soil, grapevine and wine responses to irrigation with diluted winery wastewater will be presented and discussed in subsequent articles.
LITERATURE CITED
Anonymous, 2010. Winery wastewater re-use to irrigate redgum plantations - Berri Estates. Available at: http://www.p2pays.org/ref/04/03314/ [ Links ]
ANZECC, 2000. Australian and New Zealand guidelines for fresh and marine water quality. National Water Quality Strategy Paper No. 4, Australian and New Zealand Environment and Conservation Council & Agriculture and Resource Management Council of Australia and New Zealand, Canberra, Australia. [ Links ]
Arienzo, M., Christen, E.W., Quayle, W. & Kumar, A., 2009a. A review of the fate of potassium in the soil-plant system after land application of wastewaters J. Hazard. Mater. 164, 415-422. [ Links ]
Arienzo, M., Quale, W.C., Christen, E. & Jayawardane, N., 2009b. Irrigating with winery wastewater? Developing soil stability thresholds and managing total cations. Aust. N.Z. Grapegrow. Winemak. October, 86-88. [ Links ]
Ayers, R.S. & Westcott, D.W., 1985. Water quality for agriculture. FAO Irrigation and Drainage Paper No. 29. FAO, Rome. [ Links ]
Booysen, J.H., Steenkamp, J. & Archer, E., 1992. Names of vertical trellis systems (with abbreviations). Wynboer September, 15. [ Links ]
Chapman, J.A., Correl, R.L. & Ladd, J.N., 1995. Removal of soluble carbon from winery and distillery wastewaters by application to soil. Aust. J. Grape Wine Res. 1, 39-47. [ Links ]
Clesceri, L.S., Greenberg, A.E. & Eaton, A.D., 1998 (20th ed.). Standard methods for the examination of water and wastewater. American Public Health Association, Washington DC. [ Links ]
Conradie, W.J., 1981. Seasonal uptake of nutrients by Chenin blanc in sand culture: II. Phosphorus, potassium, calcium and magnesium. S. Afr. J. Enol. Vitic. 2, 7-13. [ Links ]
Conradie, W.J., 1994. Vineyard fertilisation. Proceedings of workshop on vineyard fertilisation. Nietvoorbij, September 1994. ARC Infruitec-Nietvoorbij, Private Bag X5026, 7599 Stellenbosch, South Africa. [ Links ]
Conradie, A., Sigge, G.O. & Cloete, T.E., 2014. Influence of winemaking practices on the characteristics of winery wastewater and the water usage of wineries. S. Afr. J. Enol. Vitic. 35, 10-18. [ Links ]
Department of Water Affairs, 2013. Revision of general authorisations in terms of Section 39 of the National Water Act, 1998 (Act No. 36 of 1998), No. 665. Government Gazette No. 36820, 6 September. Department of Water Affairs, Pretoria, South Africa. [ Links ]
Department of Water Affairs and Forestry, 1996. South African water quality guidelines. Vol. 4. Agricultural use: Irrigation. CSIR Environmental Services. Department of Water Affairs and Forestry, Pretoria, South Africa. [ Links ]
Howell, C. & Myburgh, P., 2013. Permissible element concentrations in water used for grapevine irrigation (Part 1) - pH, N, P and cations. Wynboer Technical Yearbook 2013, 56-58. [ Links ]
Kodur, S., 2011. Effects ofjuice pH and potassium on juice and wine quality, and regulation of potassium in grapevines through rootstocks (Vitis): A short review. Vitis 50, 1-6. [ Links ]
Kriel, W., 2008. Turning wine into water. Farmer's Weekly, 23 May, 26-27. [ Links ]
Laurenson, S., Bolan, N.S., Smith, E. & McCarthy, M., 2012. Review: Use of recycled wastewater for irrigating grapevines. Aust. J. Grape Wine Res. 18, 1-10. [ Links ]
Le Roux, E.G., 1974. A climate classification for the South Western Cape viticultural areas (in Afrikaans). Thesis, Stellenbosch University, Private Bag X1, 7602 Matieland (Stellenbosch), South Africa. [ Links ]
Levy, G.J. & Van der Watt, H., 1990. Effect of exchangeable potassium on the hydraulic conductivity and infiltration rate of some South African soils. Soil Sci. 149, 69-77. [ Links ]
McCarthy, M.G., Jones, L.D. & Due, G., 1988. Irrigation - principles and practices. In: Coombe, B.G. & Dry, P.R. (eds). Viticulture Vol. 2. Practices. Winetitles, Adelaide. [ Links ]
Morris, J.B. & Cawthon, D.L., 1982. Effects of irrigation, fruit load, and potassium fertilization on yield, quality, and petiole analysis of Concord (Vitis labrusca L.) grapes. Am. J. Enol. Vitic. 33,145-148. [ Links ]
Mosse, K.P.M., Patti, A.F., Christen, E.W. & Cavagnaro, T.R., 2011. Review: Winery wastewater quality and treatment options in Australia. Aust. J. Grape Wine Res. 17, 111-122. [ Links ]
Mpelasoka, B, Schachtman, D.P., Treeby, M.T. & Thomas, M.R., 2003. A review of potassium nutrition in grapevines with special emphasis on berry accumulation. Aust. J. Grape Wine Res. 9, 154-168. [ Links ]
Mulidzi, R., Laker, G., Wooldridge, J. & Van Schoor, L., 2009. Composition of effluents from wineries in the Western and Northern Cape provinces (Part 1): Seasonal variation and differences between wineries. Wynboer Technical Yearbook 2009/10, 58-61. [ Links ]
Myburgh, P., 2012. Guidelines for vineyard irrigation with saline water. Wynboer Technical Yearbook 2012, 94-96. [ Links ]
Myburgh, P.A. & Howell, C.L., 2014. Use of boundary lines to determine effects of some salinity-associated soil variables on grapevines in the Breede River Valley. S. Afr. J. Enol. Vitic. 35, 234-241. [ Links ]
Myburgh, P., Lategan, E.L. & Howell, C.L., 2015. Infrastructure for irrigation of grapevines with diluted winery wastewater in a field experiment. Water SA 41, 643-647. [ Links ]
Richards, L.A., 1954. Diagnosis and improvement of saline and alkaline soils. Agriculture Handbook No. 60, US Department of Agriculture. US Government Printing Office, Washington DC. [ Links ]
Ryder, R.A., 1995. Aerobic pond treatment of winery wastewater for vineyard irrigation by drip and spray systems in California. Rev. Fr. Oenol. 152, 22-24. [ Links ]
Saayman, D., 1981. Grapevine nutrition (in Afrikaans). In: Burger, J.D. & Deist, J. (eds). Wingerdbou in Suid-Afrika. ARC Infruitec-Nietvoorbij, Private Bag X5026, 7599 Stellenbosch, South Africa. [ Links ]
Sheridan, C.M., Glasser, D., Hildebrandt, D., Petersen, J. & Rohwer, J., 2011. An annual and seasonal characterisation of winery effluent in South Africa. S. Afr. J. Enol. Vitic. 32, 1-8. [ Links ]
Smiles, D.E. & Smith, C.J., 2004. A survey of the cation content of piggery effluents and some consequences of their use to irrigate soils. Aust. J. Soil Res. 46, 67-75. [ Links ]
Soil Classification Working Group, 1991. Soil classification - A taxonomic system for South Africa. Memoirs on natural resources of South Africa no. 15. Department of Agricultural Development, Private Bag X116, 0001 Pretoria, South Africa. [ Links ]
Van Schoor, L.H., 2005. Guidelines for the management of wastewater and solid waste at existing wineries. Winetech. Available at: www.winetech.co.za [ Links ]
Van Zyl, J., 1981. Irrigation (in Afrikaans). In: Burger, J.D. & Deist, J. (eds). Wingerdbou in Suid-Afrika. ARC Infruitec-Nietvoorbij, Private Bag X5026, 7599 Stellenbosch, South Africa. [ Links ]
Winkler, A.J., 1962. General viticulture. University of California Press, Los Angeles. [ Links ]
Wolf, T.K., Heaseler, C.W. & Bergman, E.L., 1983. Growth and foliar elemental composition of Seyvel Blanc grapevines as affected by four nutrient solution concentration of nitrogen, potassium and magnesium. Am. J. Enol. Vitic. 34, 271-277. [ Links ]
Submitted for publication: August 2015
Accepted for publication: October 2015
Acknowledgements: This project was initiated and funded by the Water Research Commission. The project was co-funded by Winetech, THRIP TP 1208066038 and the Agricultural Research Council. We would like to thank Goudini Winery, for permission to work at their winery and in their vineyard, as well as for the grapes used for samples and winemaking. Our appreciation also go to Messrs Willie and Daniel Botha, for managing the vineyard and general assistance, and to the staff of the Soil and Water Science Programme at the ARC Infruitec-Nietvoorbij, for technical support. Any opinions, findings and conclusions or recommendations expressed in any publication generated through THRIP-supported research, are those of the author(s) and therefore the NRF/THRIP will not accept any liability in that regard.
* Corresponding author: E-mail address: howellc@arc.agric.za
