


Services on Demand
Article
 English (pdf)
 Article in xml format
 Article references
Indicators

Related links
-
 Cited by Google
 -
 Similars in Google
Share

 Permalink
South African Journal of Enology and Viticulture
On-line version ISSN 2224-7904
Print version ISSN 0253-939X
S. Afr. J. Enol. Vitic. vol.36 n.1 Stellenbosch 2015
Berry size variation of Vitis vinifera L. cv. Syrah: Morphological dimensions, berry composition and wine quality
M.S. MeloI, II, III; H.R. SchultzI; C.G. VolschenkII; J.J. HunterII, III
IHochschule Geisenheim University, Von-Lade Str. 1, 65366 Geisenheim, Germany
IIARC Infruitec-Nietvoorbij, Private Bag X5026, 7599 Stellenbosch, South Africa
IIIDepartment of Viticulture and Oenology, Stellenbosch University, Private Bag XI, Matieland 7602, South Africa
ABSTRACT
Berry size has always been a quality factor in wine production. In this study, Syrah grapes from a single vineyard were classified into different size groups according to diameter: small (< 13 mm), medium (13 < diameter < 14 mm) and large (> 14 mm). Smaller berries were present in the highest and larger berries in the lowest numbers. Size distributions were similar in both seasons (2010/2011 and 2011/2012). Berry physical characteristics (mass, volume and skin area) increased with size, showing the same tendency in both years. Positive correlations between berry mass, volume and skin area were found, whereas these variables were negatively related with berry number/kg grapes. Berry volume was negatively correlated with dry skin weight. Skin surface area/berry volume seems to be an indicator of the "dilution" effect associated with increasing size, as larger berries presented the lowest values. In 2012 the grapes were harvested at a higher soluble solid level than in the previous year; large-sized berries presented the lowest levels in both years. The whole-berry analysis of total anthocyanins showed a decrease in concentration and increase in content per berry, from smaller to larger berries. Small berries and the control (naturally occurring berry size mixture) showed a higher extractability of anthocyanins and phenolic compounds than the medium and large berries. Sensorially, wines from medium berries were more consistent over the two years, scoring higher than the rest. Berry sizes were related to wine style differences, and knowing the population of berry sizes in the vineyard close to harvest would offer a possibility to predict wine styles.
Key words: Syrah, berry size, vineyard variation, berry physical characteristics, phenolic composition, wine style, wine quality
INTRODUCTION
Berry size has always been considered a factor in the quality assessment of grape berries used in wine production. However, this concept gained acceptance based primarily on experience, intuition, assumptions and traditional beliefs, rather than on scientific evidence (Roby & Matthews, 2004; Roby et al., 2004; Walker et al., 2005; Matthews & Nuzzo, 2007). Many assumptions are made about the impact of berry size, inter alia that smaller berries would be better for wine production due to the presence of a higher surface:volume ratio, which may facilitate the extraction of compounds from the skin into the fermenting must, and that a large berry is less desirable because of its diluted contents (Matthews & Nuzzo, 2007). Implicit in this is that the amount of skin solutes per skin is either constant, or it changes in a way that the dilution would occur in accordance with the surface-to-volume ratio of a sphere. However, Roby and Matthews (2004) found that skin, seed and flesh proportions did not vary according to this relationship, pointing out that a skin does not stretch around a larger flesh, but grows with it; surface:volume ratios therefore cannot always be considered a measure of the level of extractable solutes (Matthews & Nuzzo, 2007; Barbagallo et al., 2011). Irrespective of this, variation in berry size would lead to compositional differences amongst berries, which may further complicate control over the ripening process (Barbagallo et al., 2011).
Although the reasons for the occurrence of berry size variation in the vineyard are still far from being resolved, both berry size and composition can be influenced by genotype, environmental factors and the many management practices that have an impact on the growth balances and microclimate of the vine (Roby & Matthews, 2004; Roby et al., 2004; Walker et al., 2005; Matthews & Kriedemann, 2006; Matthews & Nuzzo, 2007; Barbagallo et al., 2011; Dai et al., 2011). The final berry size and composition at harvest therefore would be an expression of the integrated effect of many biotic and abiotic factors that eventually also would be expressed in the wine. Different berry sizes, as well as the ripeness level at which grapes are harvested, affect mass and volume ratios at harvest as well as during maceration and alcoholic fermentation (Barbagallo et al., 2011; Guidoni & Hunter, 2012). Grape and wine polyphenol composition and qualitative profiles are affected by berry size and ripeness level (Hunter et al., 2004; Nadal et al., 2004; Nadal & Hunter, 2007; Barbagallo et al., 2011; Guidoni & Hunter, 2012). Both the physical and chemical characteristics of the grapes are therefore relevant in tailoring the final wine quality and style envisaged.
Acknowledgements: This study was done in partial fulfilment for obtaining a Vinifera European Master's in Viticulture and Oenology degree by Miss S Melo. We gratefully acknowledge the financial support from the Agricultural Research Council of South Africa and the South African Wine Industry (through Winetech). We also would like to extend our appreciation to all the personnel of the Viticulture Department, as well as those of the Robertson Experiment Farm, for their technical support. Special thanks to Albert Strever (Stellenbosch University) and foreign visitors (Roberto Zorer, Erika Toth, Peter Bodor, Konrad Pixner) to the ARC Infruitec-Nietvoorbij Viticulture Department at the time, who unconditionally provided their technical assistance in many ways, and Mardé Booyse (ARC Biometry), for the statistical analysis
Although the implications of the general physical and chemical composition related to changes in berry size are readily known (Singleton, 1972; Roby et al., 2004; Walker et al., 2005; Matthews & Kriedemann, 2006; Matthews & Nuzzo, 2007; Holt et al., 2008; Gray & Coombe, 2009; Hunter et al., 2010; Barbagallo et al., 2011), the impact on wine quality and style has not been differentiated systematically. The characterisation of the potential wine style associated with the occurrence of a specific berry size from the same vineyard may have significant practical application and provide the possibility to predict the wine style/s that may be obtained on a seasonal basis, irrespective of whether the berries are separated into sizes or not. It is clear that control over berry size and composition would be difficult to achieve, and that maintaining a certain level of wine quality and a specific wine style from year to year would remain a management challenge until the major impact factors are identified and their individual and combined effects are clarified.
The main goal of this study was to unravel/expose the potential wine style/quality that different grape berry sizes may present in a specific vineyard. To achieve this goal, berry variation in the vineyard on the basis of size was quantified. This was followed by the making of wines from the different berry sizes and relating the berry and wine chemical composition to the sensory analyses of the respective wines. This was meant to lead to a better understanding of the enhancing or spoiling effects of the presence of different berry sizes on the final wine quality and style.
MATERIALS AND METHODS
Experimental vineyard
The Syrah (clone SH 9C)/101-14 Mgt vineyard from which the grapes were collected is situated at the Robertson experiment farm of the ARC Infruitec-Nietvoorbij (Stellenbosch) in the Breede River Valley, Robertson (33°5'S/19°54'E/159 m), South Africa (Hunter & Volschenk, 2008). The region is semi-arid (hot and dry) with a mean annual temperature of 17.8°C and an average rainfall per annum of 290 mm, mainly during winter (Hunter & Bonnardot, 2011). The vineyard was planted in 2003 to four row orientations: North-South, East-West, Northeast-Southwest and Northwest-Southeast, replicated five times in a randomised design (the latter will be referred to as field replicates). The vineyard is located on a flat terroir with clayey loam soil. Vines were spaced 1.8 m x 2.7 m and trained to a vertical trellis with a cordon wire and four sets of movable wires. Canopies had approximately four layers of leaves (from side to side) and were uniformly managed (by means of shoot positioning and apical topping). Vines were supplementary irrigated according to crop factors every seven days due to the low winter precipitation of the region. Only grapes from the North-South and East-West orientations were used in this study.
Sample collection and sorting
Syrah bunches were picked randomly during two seasons (2010/2011 and 2011/2012) from North-South and East-West row orientations, including four of the five field replicates. Approximately 40 kg of grape bunches were collected from each row orientation on both sides of the canopy. This comprised four different replicates (1, 2, 3 and 4). Replicates 1 and 3, and 2 and 4 from the same row orientation were combined and the grapes were mixed. A control sample of 10 kg was taken from each of the combined replicates (1 and 3, and 2 and 4) prior to sorting, resulting in two control replicates. As the main goal was to study the natural variation in berry size, no treatments were applied in the field and the row orientation effect was not taken into consideration. Each berry was cut from the bunch, leaving the pedicel on. The berries were sorted by passing them through plates with different diameter perforations (13 mm and 14 mm, respectively). Berries were placed in the holes in a longitudinal position, with the pedicel as reference. Berries smaller than 13 mm were considered "small", berries smaller than 14 mm but larger than 13 mm were considered "medium", and berries larger than 14 mm were considered "large". These berry size groups were established in a study done shortly prior to the harvest date. The sorting of a small, but representative, sample revealed that these three diameters would be a good measure of the different berry sizes present in the vineyard. During the sorting period, all the samples were maintained in a refrigerated room at 2 - 4°C. Storage never exceeded three days. Sixteen different samples were therefore prepared (an unsorted control; and small, medium and large berries, all replicated two times for each of the two row orientations). After the sorting of all the samples, each size category was weighed in order to quantitatively assess the size variability in the field.
Berry measurements
To measure berry mass and volume, 200-berry samples were weighed and the mass per berry was calculated. The determination of berry volume was done by noting the displacement of water in a measuring cylinder after the berries were added. After these measurements were taken, the samples were divided into two parts of 100 berries each, of which one part was used to do whole-berry analysis and the second part to measure skin area and to lyophilise for further skin analysis. The pulp was removed by pressing the berry between thumb and forefinger and gently rubbing the flesh off the inner skin wall. The skin area was measured using a LICOR LI 3100 area meter, after placing the skins on transparent sheets.
Berry must analysis
Titratable acidity (mg/L tartaric acid), °Brix and pH were analysed in the musts by means of standard methods immediately after crushing of the different samples.
Fermentation
A total of 16 batches were fermented during the 2011 and 2012 growth seasons. The sizes of the batches were determined by the lowest quantity of grapes remaining after berry sorting. In both years the limiting quantity was the large-size group (> 14 mm). The size of the batches was 7 kg in 2011 and 6 kg in 2012. The batches were crushed, 50 mg/L of SO2 was added and this was allowed to macerate for one hour before inoculation with 30 g/hL of re-hydrated pure yeast (VIN 13) and the addition of DAP (50 g/hL). Three punch downs of the pomace cap were performed daily in each container. The grapes were fermented to dryness on the skins at a room temperature of 25°C. At the end of fermentation the samples were pressed with a balloon press at 2 Bar and the free-run and pressed wine were mixed. The SO2 level of the wines was then adjusted to 85 mg/L and the wines were cold stabilised for two weeks at 0°C, after which they were racked. All samples were filtered using K900 sterile filters.
Samples were taken daily after the first punch down from crushing until the time of pressing. These samples were prepared by centrifugation for 10 min. at 12 000 rpm (17 369g) in a Sorvall RC6 Plus thermo-regulated centrifuge, followed by diluting five times with distilled water. Absorbancies were read at 280 nm and 520 nm with a 2 mm quartz cuvette, using a Varian UV/VIS spectrophotometer (model 2200). Samples were also taken from all the wines (before SO2 adjustment) and the remaining skins (after pressing).
Whole berry total anthocyanin and total phenolic extraction
In the total phenolic extraction, a duplicate 50 g sample of each replicate was macerated for one minute in a Wareing Blendor. An HCl solution at pH 1.0 was added to one duplicate sample and an HCl solution at pH 3.2 to the other; the volume of each solution was equal to the total volume of the respective berry sample. After maceration, the pH was re-adjusted to 1.0 and 3.2, respectively, and all samples were stored in the dark for four hours while being stirred every hour. The samples were then centrifuged for 15 min. at 20 000 rpm (48 246 g). A 0.5 mL aliquot of the supernatant was removed and 0.5 mL of an ethanolic 0.1% HCl solution and 10 mL of a 2% HCl solution (pH 0.8) were added. From this a 2.5 mL sample was taken and, after proper dilution, the absorbancy was read at 280 nm and 520 nm using a 10 mm quartz cuvette. Anthocyanin concentration (mg/L and mg/berry) and anthocyanin extractability (%) were then calculated using the formula C (mg/L) = 2 x 875 x OD520 nm and AE (anthocyanin extractability) % = (concentration pH 1.0 - concentration pH 3.2)/concentration pH 1.0 x 100 (adapted from the formulae usually applicable to wine) (Ribéreau-Gayon et al., 2006).
Dry skin analysis
Before and after alcoholic fermentation the skins were gently separated from the pulp and seeds, rinsed to remove remaining pulp residues, and then blotted with paper. They were then frozen at -20°C, prior to freeze drying in a Chriss freeze-drying unit. The freeze-dried skins were weighed and ground using a modified Sorvall Omni-mixer and stored at room temperature until further use. For the determination of phenolic compounds in the skins, a modified method of Pirie and Mullins (1976) was used, as described by Hunter et al. (1991). One gram of freeze-dried skins was extracted in 30 mL methanolic 0.1% HCl solution (pH 3.5) at room temperature using a Janke and Kunkel horizontal shaker (model HS 500) operating at 250 rpm for 15 min. After centrifugation at 15 000 rpm (27 138 g) for 15 min., the supernatant was decanted and the process was repeated twice. Supernatants were combined and acidified to pH 1.0 using 1 M HCl. The solution was then made up to 100 mL with extraction solvent (pH 1.0) and left in the dark for one hour. After proper dilution, the absorbancies of the total phenolics and total anthocyanins were determined at 520 nm, 420 nm and 280 nm, respectively.
Sensory analysis
A panel tasting was conducted with 15 independent, experienced tasters. Sensory analysis comprised visual (colour intensity), aroma (intensity, herbaceousness, fruitiness, spiciness), mouth feel (body, acidity, astringency, persistence) and overall quality aspects. An unmarked line scale was used for the scoring of each parameter on the tasting sheets. For each vintage, sample preparation was done by blending (50:50) the two replicate wines (1 and 3, and 2 and 4) of each of the berry size categories and the row orientations. A randomised number was attributed to each sample and no specific order was followed when presenting the wines to the tasting panel. Individual tasting, in which the panel was not allowed to communicate, was followed by a discussion during which the consensus opinion was noted. During the discussion the panel had not yet been informed about which replicate wine they tasted.
Statistical analysis
For each of the two seasons (2010/2011 and 2011/2012), the averages of the results obtained for both row orientations were used for statistical analyses. Only berry sizes (treatments) and replications were used as factors for each of the two seasons. The data was continuous, therefore an appropriate ANOVA (analysis of variance) was performed using SAS/STAT software, version 9.2 64 bit of the SAS System for Windows 7 (SAS Institute, 2008). A Shapiro-Wilk test for normality was done before the results could be assumed reliable (Shapiro & Wilk, 1965). A Fisher t test with an LSD at p = 0.05 (5%) was used to compare treatment means (Ott & Longnecker, 2001). Consistency among tasters was tested by an ANOVA with replication and treatments as main factors and taster as subplot factor. The non-significant interaction (taster by treatment) term provides a measure of consistency (Meilgaard et al., 2007).
RESULTS AND DISCUSSION
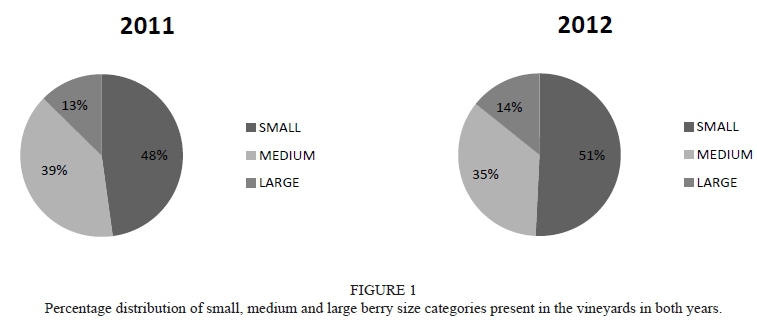
Although the distribution of berry sizes would depend on the ranges applied for categorising what was found in the vineyard, in this study berries in the small category were present in the highest percentage and those in the large category were in the lowest amounts (Fig. 1). In 2012, the medium-sized berries were present in slightly lower amounts than in 2011. In general, berry size distribution was surprisingly similar over the two growth seasons.
This seems to indicate that, despite the differences in environmental factors that normally characterise different growth seasons, the amplitude of berry size distribution was to a large extent constant. This shows that it is possible to characterise berry heterogeneity on a vineyard basis when growth and management are uniform within the constraints of abiotic and biotic factors. It also indicates that, even with the presence of different berry sizes, grape production may be tailored to specific wine styles, and to the benefit of wine quality and price point if these findings hold true for other vineyard situations and varieties.
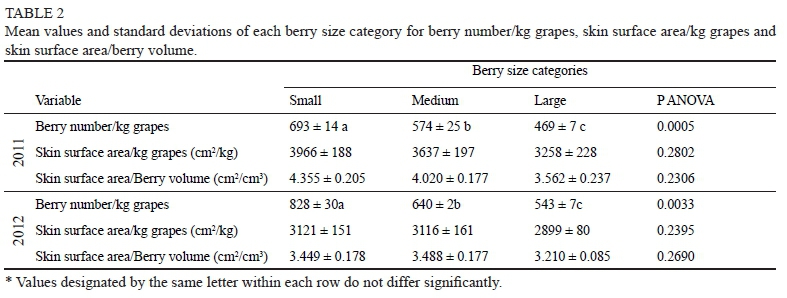
Berry physical characteristics, such as berry mass, volume and skin area, all increased with berry size (Fig. 2). The tendencies were the same in both years, but in 2012 the total values were generally lower than in 2011 due to the environmental factors that distinguished the two seasons. In both years, the variation of mass and volume from small to large berries was approximately 30%. These berry measurements were statistically different in all size categories (p < 0.01). Skin area showed a larger variation in 2012 than in 2011, varying by 33% from the small to the large-sized berries in 2012, and by 18% in 2011. Statistical differences in skin area were found in 2012, at a 0.001 significance level, with smaller sized berries having significantly lower values. In 2011 the results were statistically significant at a 10% level (data not shown), and smaller berries were significantly different from large but not from medium-sized berries. This is in agreement with the results of Barbagallo et al. (2011).
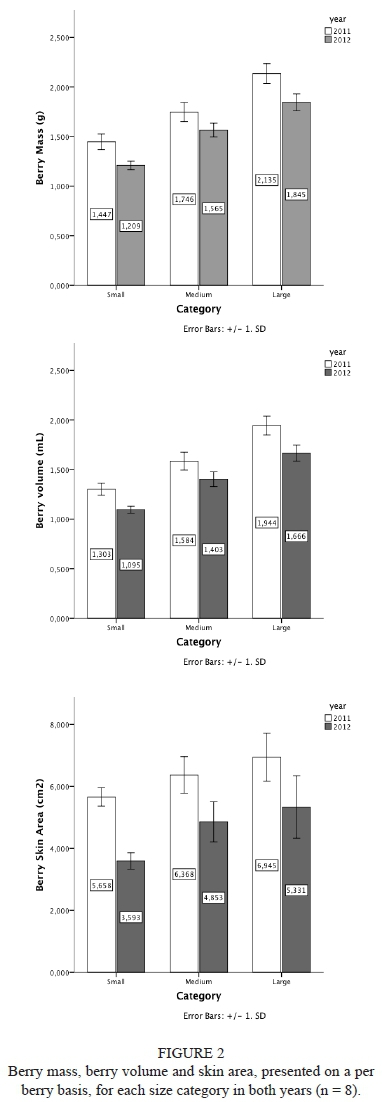
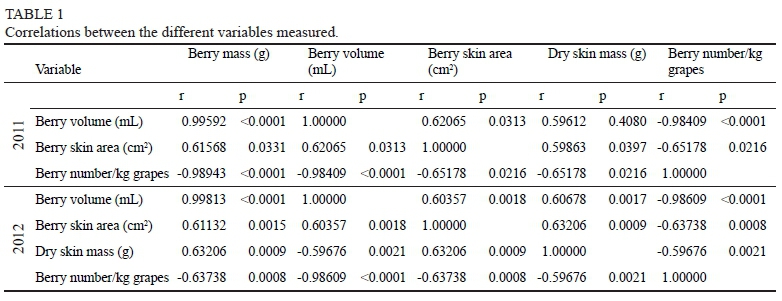
Positive correlations were found between berry mass, berry volume and berry skin area, and a negative correlation was found between berry volume and dry skin mass (in 2012) (Table 1). Berry number/kg grapes was negatively correlated with these variables. Berry number/kg grapes showed a trend in agreement with the physical measurements of the berries, with small-sized berries having the highest and large-sized berries the lowest numbers (Table 2).
Skin surface area/kg grapes showed a decreasing tendency from small to large berries in both 2011 and 2012. However, for both skin area/kg grapes and skin area/berry volume in 2012, small-sized berries had lower values than expected. Nevertheless, the results seem to indicate that large-sized berries may be more diluted than the remaining berries, as the skin surface area per berry volume showed the lowest values in both years. This ratio may also be a good indicator of the potential impact of the skin on the juice composition during crushing. In agreement with the results of others (Roby et al., 2004, and references therein; Matthews & Nuzzo, 2007; Barbagallo et al., 2011), it is clear that the vinification of large-sized berries would result in a different style of wine that may be less concentrated, at least in skin-available compounds, and therefore may not favour the full (qualitative) oenological potential of the vineyard.
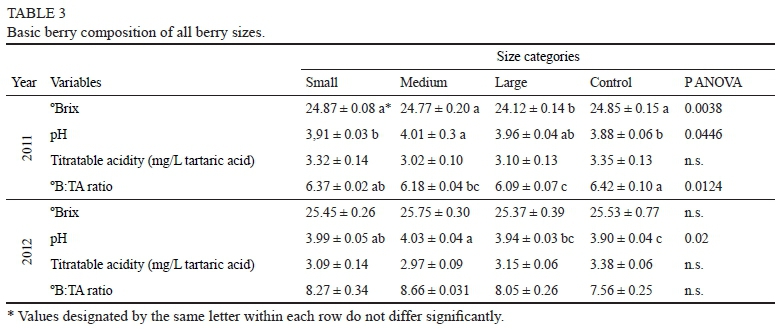
In 2012 the grapes were harvested at higher soluble solid levels than in 2011 (Table 3). Although only significant in 2011, large-sized berries had the lowest values in both 2011 and 2012. In all situations, titratable acidity and pH were lower and higher, respectively, than what is preferred in a healthy fermentation. In order to prevent possible difficulties during alcoholic fermentation, the acidity was adjusted to the same level for each batch before yeast inoculation. Although the °B:TA ratio may be an indicator of possible wine style differences (Hunter et al., 2004), this was largely nullified by the must corrections.
In general, the whole-berry analysis of total anthocyanins showed the typical decrease in concentration and increase per berry from small to large berries in both years (Table 4). In 2011, significant differences were found only for the content per berry, whereas in 2012 both concentration and total amount per berry differed significantly between the berry size groups. The results are in agreement with those of Roby et al. (2004) and Barbagallo et al. (2011). At pH 1.0, the disorganisation of the vacuolar membranes of the skins would facilitate the complete extraction of phenolic compounds, whereas at pH 3.2, a process more similar to maceration during vinification would occur (Romero-Cascales et al., 2005). Extractability is considered to be higher when the difference between these measurements is smaller, thus presenting a low extractability index (%). In this study, the extractability index was unconvincing and no pronounced differences could be found between berry size categories; individual berry sizes nonetheless fared better than the natural control mix (Table 4).
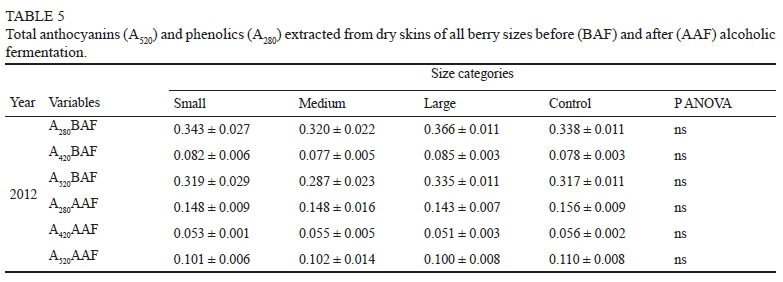
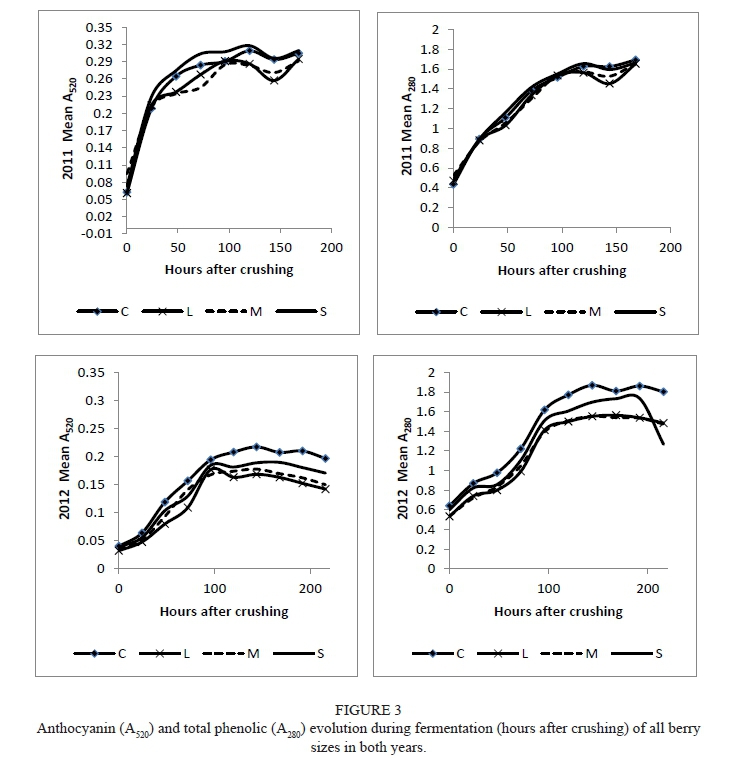
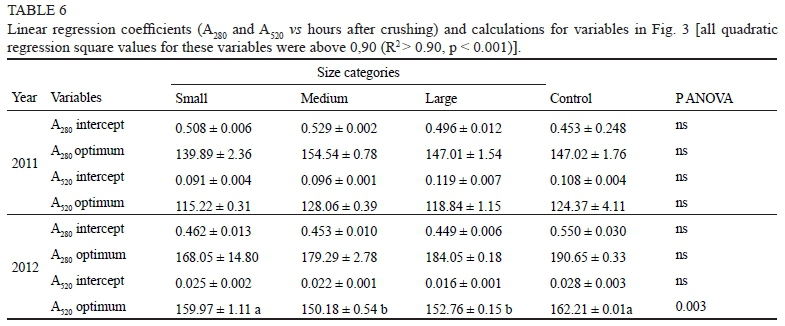
No significant differences were found in total anthocyanins and phenolics when the dry skins were extracted before and after the alcoholic fermentation period (Table 5). In general, the daily evolution of anthocyanins and total phenolics in the fermenting juice during alcoholic fermentation (representing skin extraction) showed an almost linear increase up to approximately 96 hours in both years (Fig. 3). After that, extraction seemed to have reached a plateau, indicative of saturation of the extracting solution (fermenting juice). With longer monitoring (in 2012) a decrease could be observed, which may be evidence of co-pigmentation and/or structural changes of the anthocyanins and phenolics (Guidoni & Hunter, 2012). In all replicates, the extraction profiles showed a good, positive relationship (R2 > 0.90) between the "hours after extraction" and "A520/ A280" (Table 6) The intercept values also showed that, in 2011, medium and small berries had the highest values at the moment of crushing (HAC = 0), while this was true for the small-sized berries and the control in 2012. This seems to indicate that the large berries had a lower propensity for skin extraction at the start of the alcoholic fermentation process when compared to the other classes. The differences between years were more evident in the anthocyanin than in the phenolic extraction profiles. In 2011, fast extraction of anthocyanins occurred during the first 48 hours, whereas this period was prolonged until 96 hours in 2012, similar to that of the phenolics. Several studies have shown that the maximum colour is reached in the first half of fermentation and that extra skin contact would not add more colour to the wines (Romero-Cascales et al., 2005, and the references therein; Sacchi et al., 2005; Guidoni & Hunter, 2012). Although the profiles were not significantly different, small-sized berries and the control mix seemed to generally release more anthocyanin and phenolics than medium- and large-sized berries.
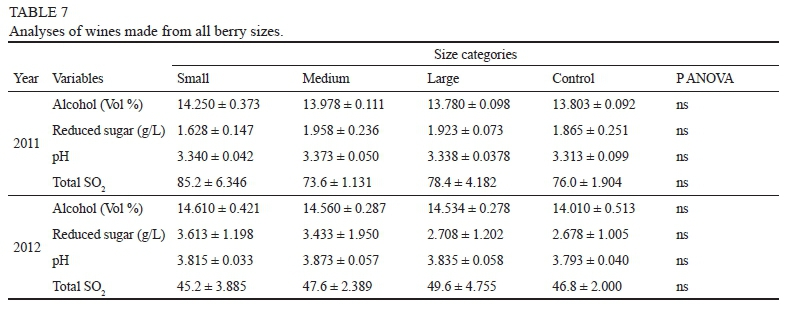
Although the panel of tasters used for the sensory analysis did not have specific training for this study, a statistical analysis (as described in Materials and Methods) showed consistency in both years (data not shown). The sensory descriptions of the different wines by the tasters for both years were quite similar (Fig. 4). Wines made from large-sized berries seemed to perform worst in both vintages and in almost all categories. A perusal of the data showed that medium-sized berries had the highest scores for overall quality, aroma intensity, astringency and persistence in 2011. In 2012, wine made from small-sized berries performed better in all characteristics except for acidity and astringency. The panel discussion carried out after the individual tasting was done to extract the most information possible from the sensory analysis session, as there also was an interest in a less formal perception of the wines. In this discussion, the wines made from medium-sized berries were described as having high aroma intensity, being fruity and balanced with high potential, and as having jammy and spicy notes more reminiscent of a Syrah wine. Wines made from small-sized berries were considered to have fruity and black pepper aroma with high alcohol intensity, but still being balanced. Wines made from large-sized berries were judged as being thin, watery, bitter and unbalanced with high acidity. The control grape mix produced wines described as balanced, having good potential, and having good colour and aroma complexity. The statistical results of the wine chemical analyses (Table 7) and the sensory analysis (Fig. 4) did not show significant differences between sizes in both years. Despite this, from a perusal of the results and considering the comments made during the panel discussion it was possible to observe tendencies relating different berry sizes to specific wine styles.
The flavour profiles linked to wine styles may be affected by numerous factors related to the sanitary condition, as well as the morphological and chemical composition, of the berries and originating from both the vineyard and the winery. In particular, the choice of harvest date, which affects wine chemical composition (Hunter et al., 2004; Nadal et al., 2004; Deloire et al., 2005; Hunter & Deloire, 2006; Nadal & Hunter, 2007; Guidoni & Hunter, 2012; Bindon et al., 2013), and the choice of yeast, which is important in the highlighting or suppressing of secondary aromas (Swiegers et al., 2005), are recognised as playing major roles in wine style. However, in view of the similar growth conditions in the vineyard and similar processes followed during vinification, wine style differences in this study can safely be associated with the berry size groupings. Profiles, however, may change according to terroir and variety.
In general, and considering physical, chemical and sensory characteristics, small- and medium-sized berries seemed more suitable for the production of quality wine than large-sized berries. Small berries seemed to have the potential to produce a concentrated, full-bodied wine, medium berries seemed more suitable for the production of a well-balanced young wine with good body, persistence and colour intensity, whereas large berries seemed only suited for a light style wine that may be perceived as unbalanced and atypical of the cultivar.
CONCLUSIONS
The composition characteristics of each berry size were found to be important in influencing the end product.
Although the transition from berries to wines was not always direct, the characteristics were present, and this suggests the possibility of knowing and even controlling the intended wine style as early as from the vineyard by means of visual berry size/s recognition and quantification. Although the study has demonstrated the complexity and difficulty of the direct materialisation of berry physical and chemical characteristics in wine, significant trends were found that brought new knowledge on the impact of berry size on the style and quality of wine. The results demonstrated that the determination of the population of berry sizes in a batch of grapes close to harvesting time would offer a definite possibility to predict the wine style/s that can be expected. Research on this aspect is continuing. The study also showed that the continuous making of distinctive wine styles may be possible in a uniformly managed vineyard, irrespective of the presence of naturally occurring berry variation.
These results therefore are highly applicable to the strategies used to produce grapes in the vineyard, as well as to finding the best oenological techniques for the production of a required wine style. This may also have a proactive impact on marketing decisions.
LITERATURE CITED
Barbagallo, M.G., Guidoni, S. & Hunter, J.J., 2011. Berry size qualitative characteristics of Vitis vinifera L. cv. Syrah. S. Afr. J. Enol. Vitic. 32, 129136. [ Links ]
Bindon, K., Varela, C., Kennedy, J., Holt, H. & Herderich, M., 2013. Relationship between harvest time and wine composition in Vitis vinifera L. cv. Cabernet sauvignon 1. Grape and wine chemistry. Food Chem. 138, 1696-1705. [ Links ]
Dai, Z.W., Ollat, N., Gomes, E., Decroocq, S., Tandonnet, J.P., Bordenave, L., Pieri, P., Hilbert, G., Kappel, C., Van Leeuwen, C., Vivin, P. & Delrot, S., 2011. Ecophysiological, genetic and molecular causes of variation in grape berry weight and composition: A review. Am. J. Enol. Vitic. 62, 413-425. [ Links ]
Deloire, A., Ojeda, H., Zebic, O., Bernard, N., Hunter, J.J. & Carbonneau, A., 2005. Influence de l'état hydrique de la vigne sur le style de vin. Progrés Agricole et Viticole 122, 455-462. [ Links ]
Gray, J.D. & Coombe, B.G., 2009. Variation in Shiraz berry size originates before fruitset but harvest is a point of resynchronisation for berry development after flowering. Aust. J. Grape Wine Res. 15, 156-165. [ Links ]
Guidoni, S. & Hunter, J.J., 2012. Anthocyanin profile in berry skins and fermenting must/wine, as affected by grape ripeness level of Vitis vinifera cv. Shiraz/R99. Eur. Food Res. Technol. 235, 397-408. DOI:10.1007/s00217-012-1744-5 [ Links ]
Holt, H.E., Francis, I.L., Field, J., Herderich, M.J. & Iland, P.G., 2008. Relationships between berry size, berry phenolic composition and wine quality scores for Cabernet Sauvignon (Vitis vinifera L.) from different pruning treatments and different vintages. Aust. J. Grape Wine Research 14, 191-202. [ Links ]
Hunter, J.J. & Bonnardot, V., 2011. Suitability of some climatic parameters for grapevine cultivation in South Africa, with focus on key physiological processes. S. Afr. J. Enol. Vitic. 32, 137-154. [ Links ]
Hunter, J.J. & Deloire, A., 2006. Terroir and vine water relation effects on grape ripening and wine quality of Syrah/R99. Proc. VIth Intern. Terroir Congress, July 2006, Bordeaux and Montpellier, France. pp. 110 - 116. [ Links ]
Hunter, J.J. & Volschenk, C.G., 2008. Implications of grapevine row orientation in South Africa. Proc. VIIth Int. Terroir Congress, May 2008, Nyon, Switzerland. pp. 336 - 342. [ Links ]
Hunter, J.J., Archer, E. & Volschenk, C.G., 2010. Vineyard management for environment valorisation. Proc. 8th Intern. Terroir Zoning Congress, June 2010, Soave, Italy. pp. 7.3 - 7.15. [ Links ]
Hunter, J.J., De Villiers, O.T. & Watts, J.E., 1991. The effect of partial defoliation on quality characteristics of Vitis vinifera L. cv. Cabernet Sauvignon grapes. II. Skin colour, skin sugar, and wine quality. Am. J. Enol. Vitic. 42, 13-18. [ Links ]
Hunter, J.J., Pisciotta, A., Volschenk, C.G., Archer, E., Novello, V., Deloire, A. & Nadal, M., 2004. Role of harvesting time/optimal ripeness in zone/ terroir expression. Proc. Joint Conf. (SASEV, OIV, GESCO) on Viticultural Zoning, November 2004, Cape Town, South Africa. pp. 466 - 478. [ Links ]
Matthews, M.A. & Kriedemann, P.E., 2006. Water deficit, yield, and berry size as factors for composition and sensory attributes of red wine. Proc. Aust. Soc. Vitic. and Oenol. "Finishing the Job" - Optimal ripening of Cabernet Sauvignon and Shiraz, July 2006, Mildura, Victoria, Australia. pp. 46 - 54. [ Links ]
Matthews, M.A. & Nuzzo, V., 2007. Berry size and yield paradigms on grape and wine quality. Proc. Int. Workshop on Advances in Grapevine and Wine Research. Acta Hortic. 754, 261-267. [ Links ]
Meilgaard, M., Civille, G.V. & Carr, B.T., 2007. Sensory evaluation techniques. CRC Press, Boca Raton. [ Links ]
Nadal, M. & Hunter, J.J., 2007. Different wine styles as related to ripeness level of Syrah/R99 grapes. Proc. Int. Intervitis Interfructa Congress, April 2007, Stuttgart, Germany, pp 139 - 148. [ Links ]
Nadal, M., Volschenk C.G. & Hunter, J.J., 2004. Phenolic extraction during fermentation as affected by ripeness level of Syrah/R99 grapes. Proc. Joint Conf. (SASEV, OIV, GESCO) on Viticultural Zoning, November 2005, Cape Town, South Africa. pp. 479 - 487. [ Links ]
Ott, R.L. & Longnecker, M., 2001 (5th ed). An introduction to statistical methods and data analysis. Belmont, CA, Duxbury Press. [ Links ]
Pirie, A. & Mullins, M.G., 1976. Changes in anthocyanin and phenolics content of grapevine leaf and fruit tissues treated with sucrose, nitrate and abscisic acid. Plant Physiol. 58, 468-472. [ Links ]
Ribéreau-Gayon, P., Glories, Y., Maujean, A. & Dubourdieu, D., 2006 (2nd ed). Handbook of Enology (Volume 2). The chemistry of wine stabilization and treatment. John Wiley & Sons, Ltd. Chichester, England. [ Links ]
Roby, G. & Matthews, M.A., 2004. Relative proportions of seed, skin and flesh, in ripe berries from Cabernet Sauvignon grapevines grown in a vineyard either well irrigated or under water deficit. Aust. J. Grape Wine Res. 10, 74-82. [ Links ]
Roby, G., Harbertson, J.F., Adams, D.A. & Matthews, M.A., 2004. Berry size and vine water deficits as factors in winegrape composition: Anthocyanins and tannins. Aust. J. Grape Wine Res 10, 100-107. [ Links ]
Romero-Cascales, I., Fernández-Fernández, J.I., López-Roca, J.M. & Gomes-Plaza, E., 2005. The maceration process during winemaking extraction of anthocyanins from grape skins into wine. Eur. Food Res. Technol. 221, 163-167. [ Links ]
Sacchi, K.L., Bisson, L.F. & Adams, D.O., 2005. A review of the effect of winemaking techniques on phenolic extraction in red wines. Am. J. Enol. Vitic. 56, 197-206. [ Links ]
SAS Institute, Inc., 2008. SAS Version 9.2. SAS Institute Inc, SAS Campus Drive, Cary, North Carolina 27513. [ Links ]
Shapiro, S.S. & Wilk, M.B., 1965. An analysis of variance test for normality (complete samples). Biometrika 52, 591-611. [ Links ]
Singleton, V.L., 1972. Effects on red wine quality of removing juice before fermentation to simulate variation in berry size. Am. J. Enol. Vitic. 23, 106113. [ Links ]
Swiegers, J.L., Bartowsky, E.J., Henschke, P.A. & Pretorius, I.S., 2005. Yeast and bacterial modulation of wine aroma and flavour. Aust. J. Grape Wine Res. 11, 139-173. [ Links ]
Walker, R.R., Blackmore, D.H., Clingeleffer, P.R., Kerridge, G.H., Rühl, E.H. & Nicholas, P.R., 2005. Shiraz berry size in relation to seed number and implications for juice and wine composition. Aust. J. Grape Wine Res. 11, 2-8. [ Links ]
Submitted for publication: April 2014
Accepted for publication: September 2014
* Corresponding author: E-mail address: hunterk@arc.agric.za
