


Servicios Personalizados
Articulo
 Inglés (pdf)
 Articulo en XML
 Referencias del artículo
Indicadores

Links relacionados
-
 Citado por Google
 -
 Similares en Google
Compartir

 Permalink
South African Journal of Enology and Viticulture
versión On-line ISSN 2224-7904
versión impresa ISSN 0253-939X
S. Afr. J. Enol. Vitic. vol.36 no.1 Stellenbosch 2015
The influences of different winemaking techniques on the mouthfeel of Shiraz grapes
A.P. NelI, II; L. LouwIII; M.G. LambrechtsI, III; P. van RensburgI, III
IDepartment of Viticulture and Oenology, Stellenbosch University, Matieland, South Africa
IIFaculty Applied Science, Department of Agriculture, CPUT, Wellington, 7654
IIIDistell, PO Box 184, Stellenbosch, 7599, South Africa
ABSTRACT
The objective of this study was to determine the effect of ripeness and of different tannin extraction methods on the sensory properties of wine, with a specific focus on mouthfeel properties. Quantitative descriptive analysis (QDA) was performed to evaluate the sensory properties of 20 young Shiraz wines in two phases. In Phase 1, wines from a cool area were evaluated and, in Phase 2, wines from a warm area were evaluated. Clear differences were found between the wines from the two regions. Wines from the cooler region were generally associated with higher levels of total non-flavonoids and total anthocyanins, and more intense numbing and puckering sensations. In contrast, the wines from the warmer region as a group were associated with a more drying and grippy mouthfeel, as well as less total anthocyanins and total non-flavonoids. In the set of wines from the cooler region, the effect of ripeness was more pronounced than in the set of wines from the warmer region. In both cases, riper grapes resulted in a coarser surface smoothness, a more numbing sensation, a bitter aftertaste and less adhesive mouthfeel. The wines from the cooler region that were harvested at a riper stage were associated with many of the anthocyanins/ anthocyanin derivatives and were negatively associated with hydroxycinnamate, procyanidin B1 and delphinidin-3-glucoside-p-coumaric acid. In the warmer area, the riper grapes were again associated with anthocyanins/anthocyanin derivatives, but this time were strongly associated with procyanidin B2, caffeic acid, p-coumaric acid, catechin, coutaric acid and total non-flavonoids. The effect of tannin extraction method on the sensory properties of the wines from the warmer region was more pronounced than in the wines from the cooler region. Unfortunately, the differentiation between treatments was not consistent from one ripeness level to the next. However, it appeared that the cold soak treatment differed the least from the control, regardless of region or ripeness, whereas the post-maceration treatment differed the most based on mouthfeel and phenolic composition. Although some mouthfeel attributes and phenolic compounds were consistently associated with region and ripeness, it is not clear if mouthfeel can be manipulated consistently by tannin extraction methods.
Key words: Sensory properties, mouthfeel, Shiraz, tannin extraction methods
INTRODUCTION
The macromolecular fraction of red wines is composed mainly of polysaccharides and polyphenolic compounds like proanthocyanidins and anthocyanidins (Vidal et al., 2004a). It has been suggested that anthocyanins could modulate the perception of astringency in red wines either directly or through reactions with proanthocyanidins (Gawel, 1998; Vidal et al., 2004a; Gawel et al., 2007; Oberholster et al.,, 2009). Vidal et al. (2004b) observed that an anthocyanin fraction complemented grape proanthocyanidin astringency and did not contribute to bitterness. Astringency is a tactile sensation, which can be described in sensory terms as drying (the lack of lubrication or moistness, resulting in friction between oral surfaces), roughing (the unsmooth texture in the oral cavity marked by inequalities, ridges and/or projections felt when oral surfaces come into contact with one another) or puckering (the drawing or tightening sensation felt in the mouth, lips and/or cheeks) and is ascribed to the binding and precipitation of the salivary proteins (Gawel et al., 2001; Vidal et al., 2004b; Landon et al., 2008). It has been found that seed tannins are more astringent (coarse, drying) than skin tannins of equivalent size, which is probably due to gallic acid derivatives (Oberholster et al., 2009).
Gawel et al. (2001) describe the tactile sensation of astringency as follows: "... a result from the cross-linking of polyphenols with glycoproteins found between and above the epidermal cells of the mucosal tissue in the mouth and/ or from the binding and subsequent precipitation of salivary proteins by polyphenols. The polyphenol-protein interaction results in a saliva with poorer lubricating properties and greater friction between mouth surfaces. The increased friction ultimately activates the mechano-receptors in the mouth leading to the perception of astringency." Therefore astringency is a characteristic of unripe fruit (Vidal et al., 2004b). Astringency may be intensely perceived in young red wines, but it will gradually decrease during maturation (Vidal et al., 2004b).
Different other molecules influence the perception of astringency or bitterness, such as polysaccharides, which are responsible for "mellowness" and viscosity (Videl et al., 2004a), acidity, which can contribute to astringency by increasing the efficacy of the bonding of polyphenols to salivary proteins (Gawel et al., 2001), alcohol, which can reduce the astringency sensation (Gawel et al., 2001; Fontoin et al., 2008). Gawel (1998) warned that astringency increases upon repeated ingestion, with the rate of increase being greater when the time between ingestions is shortened. Lee and Vickers (2009) also found that the astringent feeling can take as short as 15 seconds to develop fully (and can linger for more than 6 min.), and is known to build in intensity and became increasingly difficult to clear from the mouth over repeated exposures.
The aim of this study was to investigate the mouthfeel properties of Shiraz wine and the representative chemical components. We also wanted to see if there was discrimination between Shiraz wine made in two different climatic areas and from grapes of two different ripeness levels, and their mouthfeel properties. Different tannin extraction methods were used, so that the outcome of this study could also cast some light on the mouthfeel of wine made by different winemaking techniques.
MATERIALS AND METHODS
Samples
Grapes
The Shiraz grapes were harvested in two climatic areas and at two different ripeness levels. The first ripeness level was before commercial harvest and the second ripeness level was after commercial harvest. The first area is classified as IV according to the Winkler scale (1965), i.e. a warm area. This area is on the farm Plaisir de Merle in the Stellenbosch district of Simondium. The second area is classified as III according to the Winkler scale (1965), therefore it is regarded as slightly cooler than the first area. This second area is located on the farm Morgenster in the Durbanville district. The Winkler heat summation works as follows: the sum of the average daily temperature above 10°C for the growing months (September to March) are calculated and are then expressed as degree days. These degree days are then compared to a table (like Table 1). This table can be used to calculate which cultivar would suit the specific area.

Wine
Four different winemaking techniques (CM - cold maceration, E - enzyme, PM - post-maceration and CM+PM - a combination of cold and post-maceration) were used to extract the tannins and anthocyanins. These winemaking techniques were evaluated against a control. The cold maceration took place for three days at 15°C and, for the post-maceration, the skins were left for two weeks after alcoholic fermentation.
Two different tannin precipitation assays were used to quantify the tannin concentration of the Shiraz wine. The methylcellulose (MCP) assay uses a polysaccharide to precipitate tannin and is a more direct method, as it is read with a spectrophotometer at 280 nm. The bovine serum albumin (BSA) assay uses a protein to precipitate tannin and is a more indirect method, as it is read by a spectrophotometer at 520 nm. The latter method also took into consideration the bleaching effect of bisulphite. This method therefore is useful for following the evolution of the monopigments (MP), small polymeric pigments (SPP) and large polymeric pigments (LPP) as the wine matures.
RP-HPLC
Monomeric phenolic compounds were determined in duplicate using the RP HPLC method of Donovan et al. (1998). A Hewlett-Packard/Agilent model 1100 HPLC (Palo Alto, CA) with a diode array UV-visible detector coupled to HPChemStation software was used. The column was an Ascentis ® Express C18 (15 cm x 4.6 mm; 2.7 μπι) (Supelco, Sigma Aldrich). All wine samples and standards were filtered through 0.45-μπι PTFE syringetip filters (Gelman Sciences, Ann Arbor, MI) before use. The following standards were used: gallic acid, (+)-catechin, (-)-epicatechin, caffeic acid and rutin (Sigma, St. Louis, MO), and malvidin-3-glucoside (Mv-3-glc) (Extrasynthese, Genay, France). Compounds were identified by group on the basis of their UV spectra and reported in terms of the related standard compound. These were benzoic acids, hydroxycinnamates, flavan-3-ols, flavonols and anthocyanins expressed as mg gallic acid equivalents/L (mg GAE/L), mg caffeic acid equivalents/L (mg CAE/L), mg catechin equivalents (mg CE/L), mg rutin equivalents/L (mg RE/L), and mg Mv-3-glc equivalents/L (mg ME/L) respectively. The total area under the chromatograms at 280 nm was integrated and used to calculate the total phenol content expressed as mg GAE/L, probably lower than actual because of the high absorbance of gallic acid.
Tasting
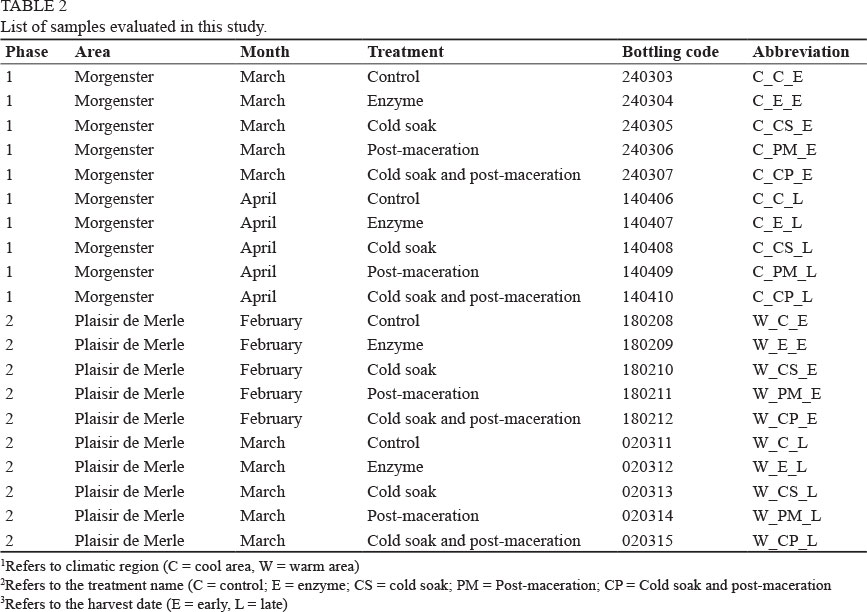
This study was conducted in two phases consisting of ten samples each, as indicated in Table 2. The grapes were harvested at two different ripening levels and were collected from Morgenster farm and Plaisir de Merle farm respectively. Five different tannin extraction procedures were evaluated within each ripening level. The area, bottling codes, treatment names and abbreviations are shown in Table 2. The month indicated in Table 2 refers to the month in which the grapes were harvested.
Sensory methodology
Quantitative descriptive analysis with a trained panel was used following the procedures outlined in Lawless and Heymann (1995). The same experimental design, testing facilities and sample preparation/presentation procedures were used in Phase 1 and Phase 2.
Panel
Eleven panellists were selected to participate in the profiling of the wines. Eight of the panellists had previous experience in quantitative descriptive analysis. The remaining three panellists were selected based on taste and smell acuity, interest, ability to discriminate between the four basic tastes, ability to verbally describe sensory experiences, concentration ability and availability. One of the panellists could not attend the second phase of the project, and therefore Phase 2 was conducted with only ten panellists.
Training
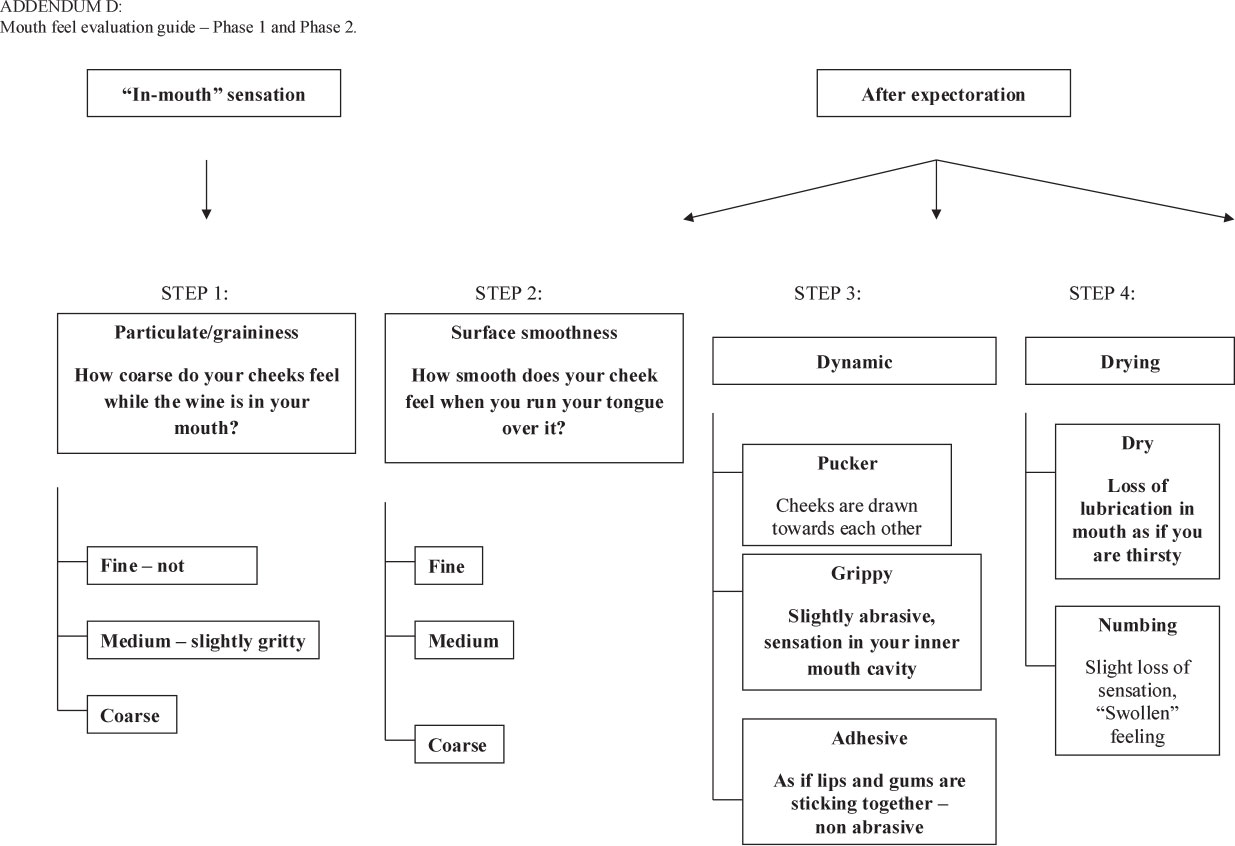
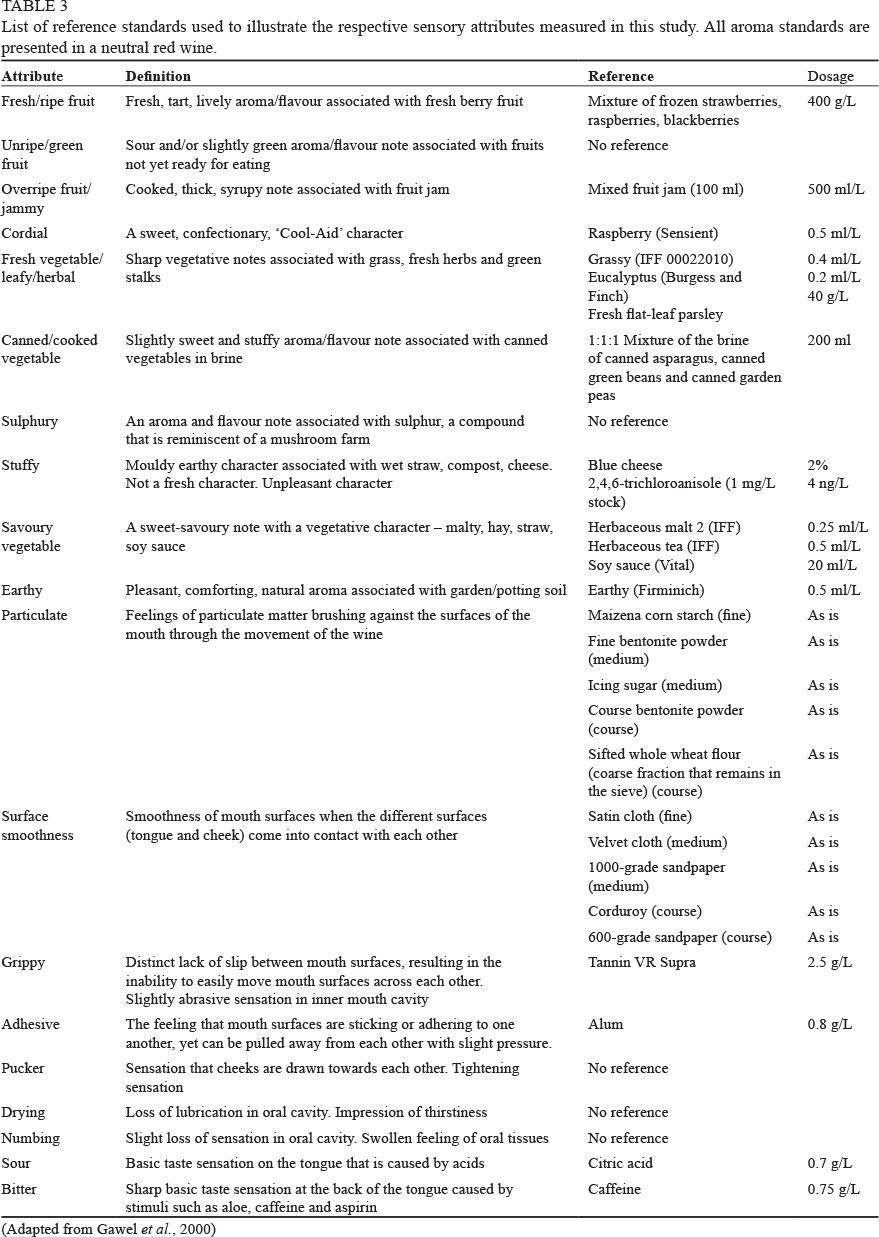
In the first training phase, the panel evaluated the ten samples from Morgenster. The panel was trained for eight weeks (2 x 2 h sessions per week), during which the panellists received representative samples of the different wines and were trained to increase their sensitivity and ability to discriminate between specific samples and the sensory attributes of each product sample. The list of sensory attributes with representative reference standards is shown in Table 3. Aroma identification guides, using the definitions of each descriptor, were compiled to help the panellists identify aromas, flavours and mouthfeel properties during tasting based on an elimination process (Addenda A to C). Throughout the training, the panellists were given aroma reference standards representing the aroma attribute term and asked to identify the aromas of each reference standard on a blind basis. The panellists were also provided with touch and taste standards for the mouthfeel terms, as indicated in Table 3.
The panel used a 100 mm line scale, with nil (0) denoting the least intense condition (e.g. no fresh berry aroma) and hundred (100) denoting the most intense condition (e.g. intense fresh berry aroma) to evaluate the aroma, flavour, aftertaste and mouthfeel characteristics of the different products. The attributes 'particulate/graininess' and 'surface smoothness' were evaluated on a 100 mm scale, on which nil (0) denoted the most smooth condition and hundred (100) denoted the most coarse condition. During the training phase the panel performance was monitored using Tucker plots, profile plots and three-way analysis of variance using the Panel CHECK 1.3 software (www.panelcheck.com).
The same training protocol was used during Phase 2 (evaluation of Plaisir de Merle wines). The different list of aroma and flavour attributes, which was more representative
of the characteristics of the Plaisir de Merle wines, was used during Phase 2 (Addendum C). The mouthfeel and aftertaste attributes were the same.
Experimental design used during final sample evaluation
Quantitative descriptive analysis was conducted over a three-day period in order to incorporate three replications. Each taster evaluated eight samples in a balanced, incomplete block design.
Test facilities
The sensory descriptive test was conducted in Distell's Sensory Laboratory, equipped with 12 separate booths designed according to American Society for Testing Materials (1989) standard requirements. Panellists evaluated products monadically in separate tasting booths to reduce distraction and panellist interaction, and to ensure uninterrupted, unbiased, individual responses. Data were collected using the computerised data collection software Compusense five Release 5.0. (Compusense Inc., Guelph, Canada).
Sample presentation
The wine samples were served according to research guidelines for the sensory evaluation measurements of alcoholic beverages. All samples were randomised to exclude any bias due to the position effect. The samples were served monadically at room temperature. Two 15 ml samples were served per wine in Vitria ISO tasting glass, covered with a Petri dish and coded with a three-digit random number. The panellists were instructed to taste the entire 15 ml of the first glass for their evaluation. This was done to reduce any variation in mouthfeel evaluations due to variance in sip sizes. The second glass was provided in case they wanted to re-evaluate some of the flavour attributes. Between samples, panellists were instructed to cleanse their pallets with distilled water and unsalted water crackers served at room temperature. A time delay of three minutes was allowed between samples. After rating four samples in this manner, a ten-minute break was introduced in order to avoid sensory adaption. Each panellist was provided with a sensory attribute identification guide during the evaluation of the products.
Data analysis
The scale values obtained forthe attribute 'surface smoothness' were inverted so that low ratings refer to a coarser mouthfeel and high ratings refer to a smoother mouthfeel. Three-way analysis of variance (ANOVA) was performed to determine if there were significant judge*sample or sample*replication interactions, and whether there were significant differences between the samples. Fisher's LSD post hoc tests were performed to determine which samples differed significantly from which. Principal component analysis (PCA) was performed to obtain a graphical representation of the interrelationships of the sensory attributes and/or phenolic composition of the samples. This was applied to the mean values of the attributes and phenolic compounds per sample. The data were centred and standardised prior to the PCA analysis. Agglomerative hierarchical cluster analysis (AHC) was performed to further investigate the relationships
between the sensory and chemical variables. ANOVA, PCA and AHC procedures were performed in XLStat version 2009.1.02 (Addinsoft, www.xlstat.com).
RESULTS AND DISCUSSION
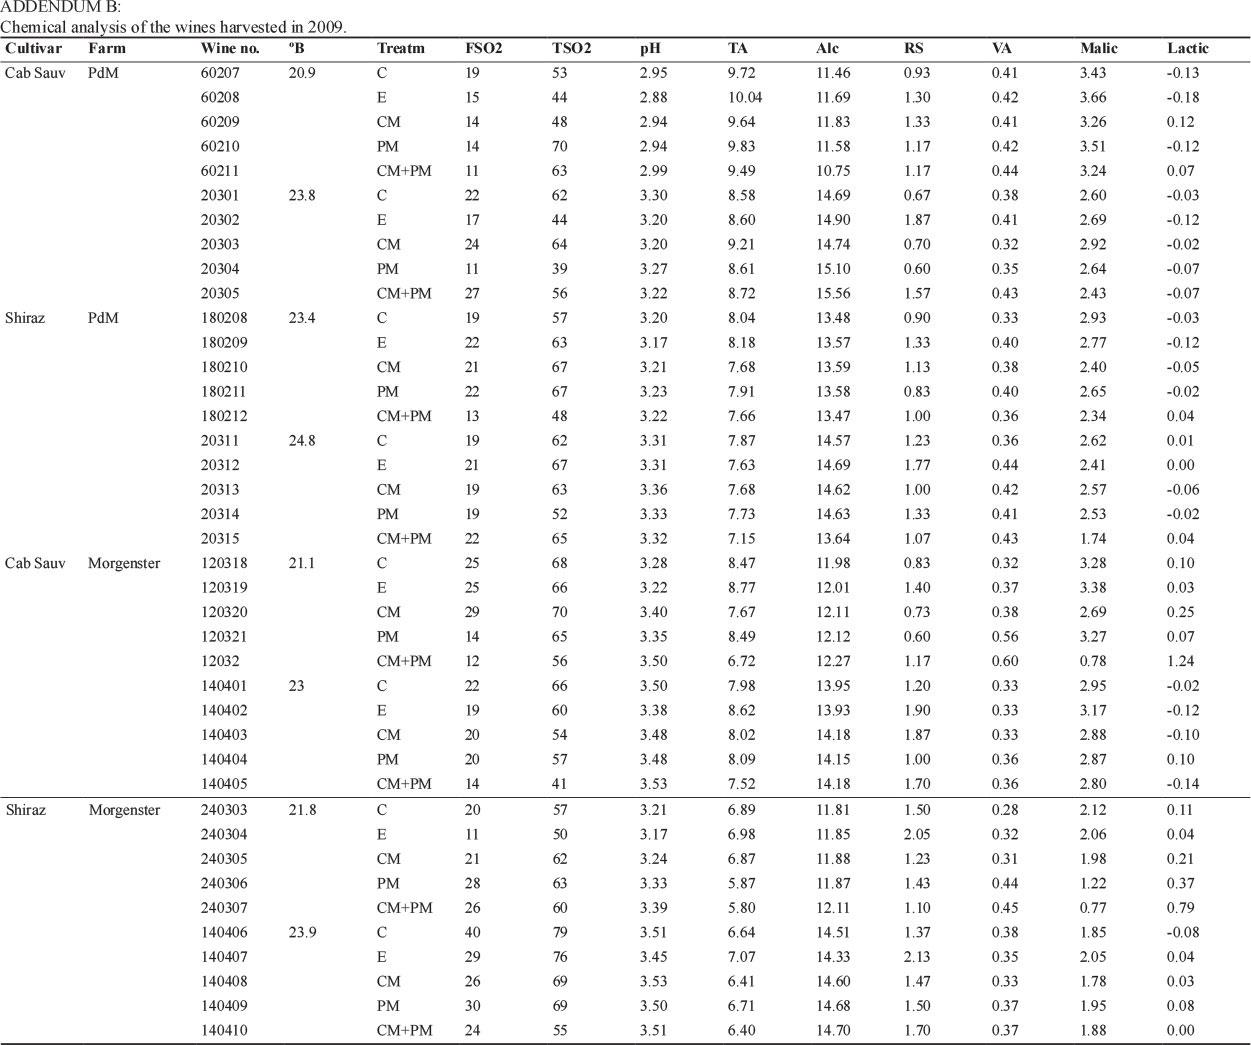
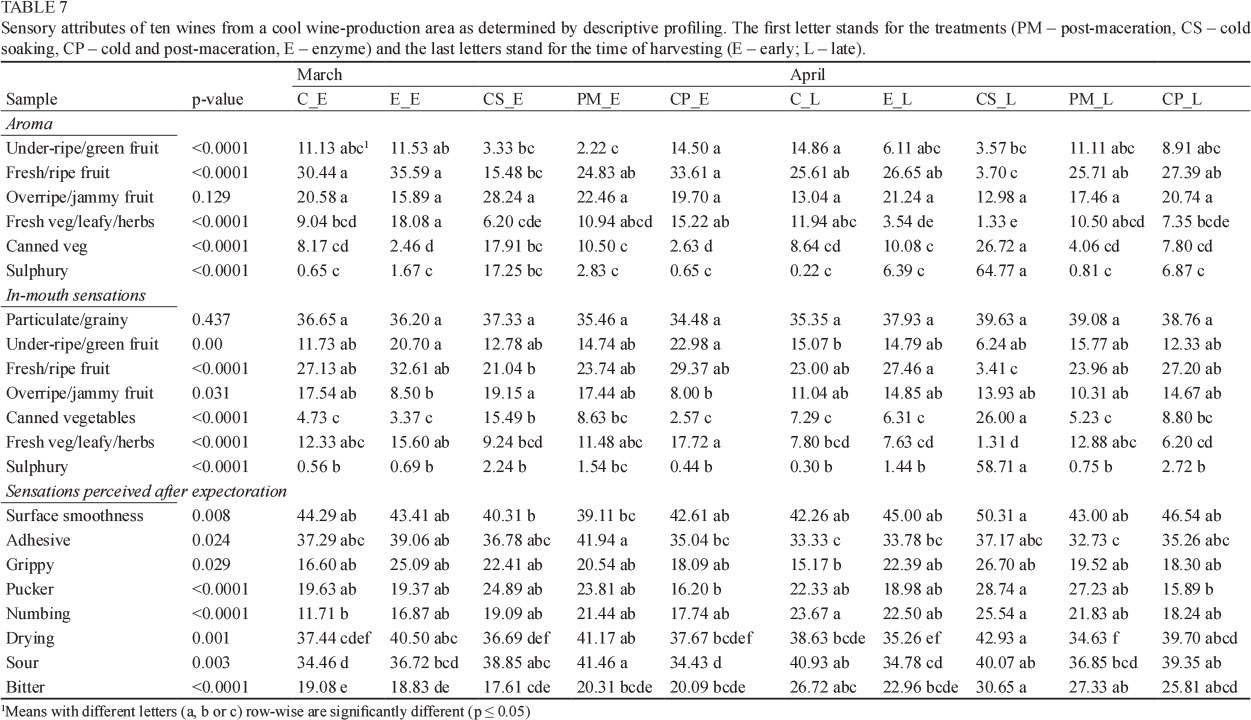
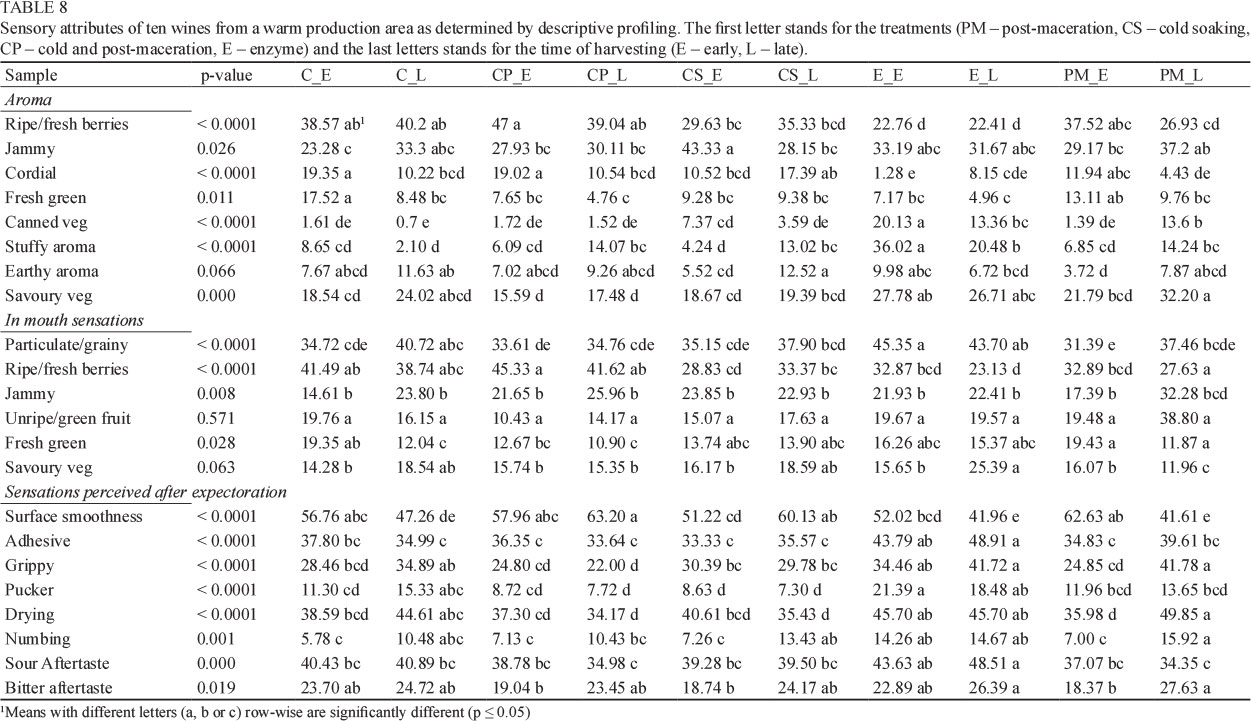
The results obtained from the analysis of variance (ANOVA) for the 10 wine samples evaluated in Phase 1 and Phase 2 are summarised in Tables 7 and 8. The mean values for all samples are provided and the statistical significance of the differences (p <0.05) is indicated. The univariate results will be discussed as supporting data for the interpretation of the multivariate analysis.
The effect of climatic area on mouthfeel and phenolic composition of red wine
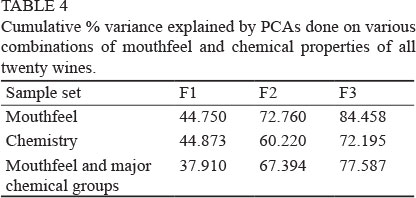
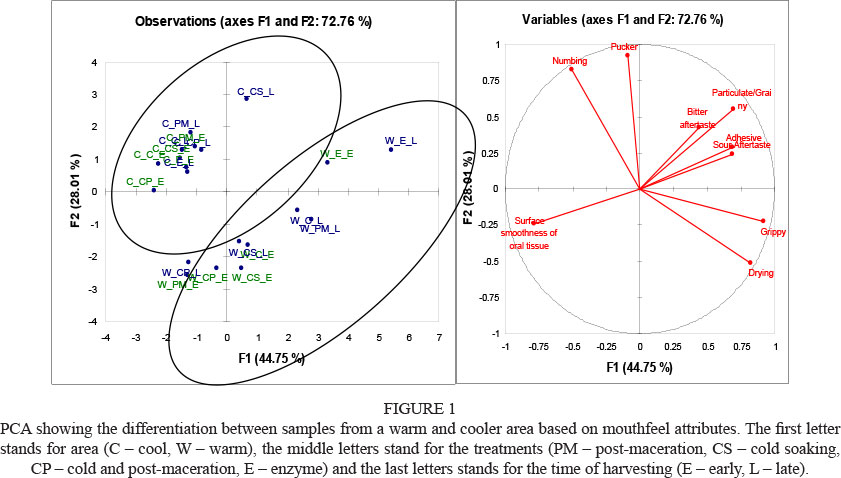
A PCA on the mouthfeel attributes of all twenty samples was done to investigate the effect of climatic region, ripeness level and tannin extraction method on the mouthfeel of red wines (Fig. 1). The first two principal components (PC) explained 72.8% of variance in the dataset (Table 4). The scores plot shows a clear differentiation between the samples from the warmer area (denoted by W) and the samples from the cooler area (denoted by C). All the samples from the cooler area had positive scores on PC 2 (i.e. situated at the top of the plot). With the exception of the enzyme treatments, all the samples from the warmer region had negative scores on PC 2.
The attributes puckering and numbing were strongly associated with PC 2. Overall, the wines from the cooler area (Table 7) were deemed to cause a more intense numbing and puckering effect compared to the wines from the warmer area (Table 8). The attributes grippy and drying had the strongest negative association with PC 2 (i.e. associated with the wines from the warmer climate). A closer look at the univariate results confirms that, overall, the wines from Plaisir de Merle were rated as more grippy and drying than the wines from Morgenster. This PCA did not show a clear trend in terms of the ripeness levels (marked as blue and green) or treatments within in each region.
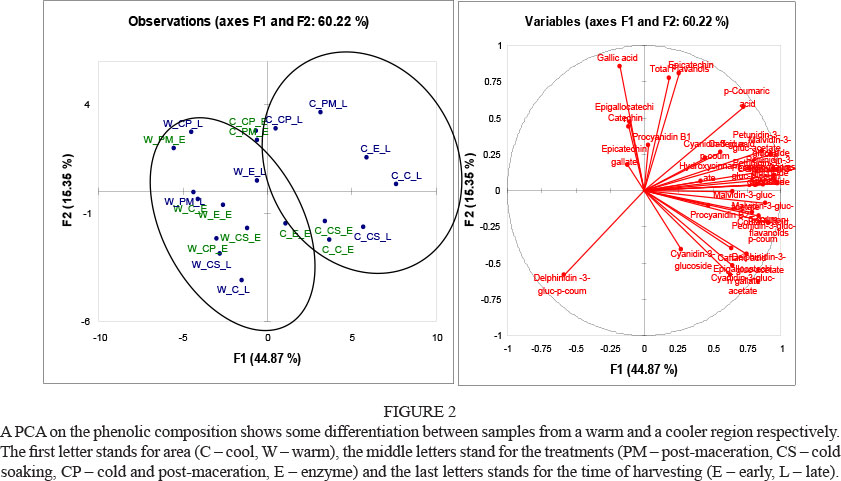
A second PCA was performed on the phenolic composition of the wines (Fig. 2). This PCA explained only 60% of the total variance in the data (Table 4). In Fig. 2 one can see that the degree of differentiation between the samples from the warmer (W) and cooler (C) areas was not as clear based on the phenolic composition compared to the sensory attributes in Fig. 1. There still was a fair degree of separation between the W samples and the C samples, as indicated by the two circles.
Based on the variable loadings (Fig. 2), delphinidin-3-glucoside-p-cournaric acid had the strongest association with the W samples. This compound had a strong negative association with p-coumaric acid (which was associated with the C samples). One could hypothesise that the warmer growth conditions encouraged the binding process of p-coumaric acid and delphinidin-3-glucoside.
A PCA on the mouthfeel and major chemical groupings (e.g. total flavanols) revealed even more interesting results (Fig. 3). As shown in Table 4, the first two PCs explained 67% of the variance in the data. PC 1 showed a clear separation between the samples from the warmer climatic region (W) and the wines from the cooler climatic region (C). PC 1 had a positive correlation with drying and grippy, and was negatively correlated with numbing, puckering, total non-flavonoids and total anthocyanins. This means that the wines from the cooler region generally were associated with higher levels of total non-flavonoids and total anthocyanins, and more intense numbing and puckering sensations. In contrast, the wines from the warmer region as a group were associated with a more drying and grippy mouthfeel, as well as less total anthocyanins and total non-flavonoids.
In addition to the differentiation between the regions, this PCA also showed some differences between the wines that were harvested early (denoted with the letter E at the end) vs. the wines that were harvested later (denoted with the letter L at the end) on PC 2 (Fig. 3). The wines that were harvested earlier generally were associated with a finer surface smoothness, while wines that were harvested later were associated with a more particulate/grainy mouthfeel, as well as a more bitter aftertaste. Although the separation between the ripeness levels was represented more clearly in this PCA, the chemical parameters did not contribute significantly to the differentiation observed. The effect of ripeness were evaluated in more detail in the wines from Plaisir de Merle and from Morgenster respectively.
Overall effect of ripeness level on the sensory attributes and phenolic composition of wines harvested in a cool area
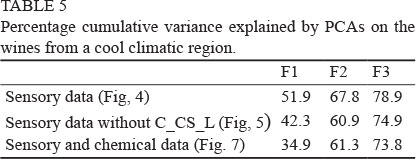
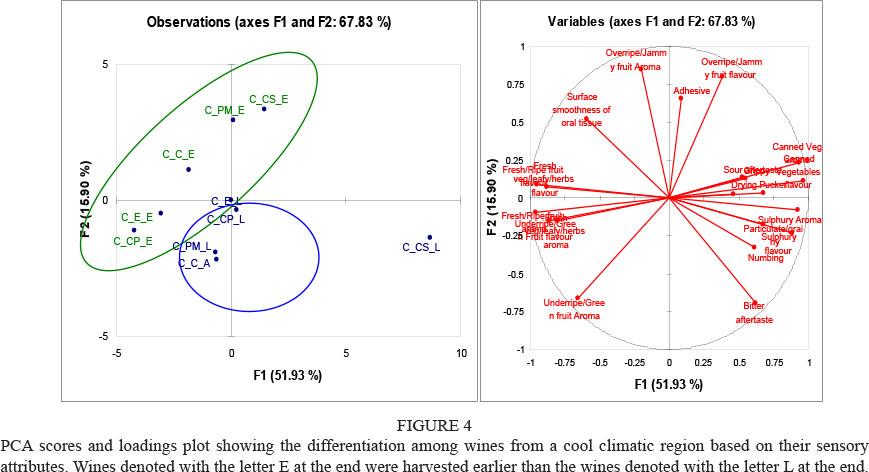
A PCA was done on the aroma, flavour, taste and mouthfeel properties of the wines evaluated in Phase 1 of the project (cool area). According to the results of the PCA, the first principal component (PC 1) accounted for 51.9% of the total variance in the data (Table 5). The second principal component accounted for 15.9% of the total variance. PC 3 accounted for a further 11.1% of the variance in the data. A total of 78.9% of the data could be explained by the first three PCs.
C_CS_L was a clear outlier in the sample set (Fig. 4). This sample differentiated from all the others based on significantly more intense cooked/canned vegetable aroma and flavour and sulphury aroma and flavour (Table 7). C_CS_E had the second highest intensity of these four characteristics, although in each case at significantly lower intensities than C_CS_L. Canned/cooked vegetable aroma and flavour occurred at very low intensities in the other wines. C_ CS_E had a low, but noticeable, sulphury aroma, but this characteristic disappeared on flavour. In the case of C_CS_L, the sulphury characteristic also decreased in intensity from aroma to flavour, but was present at medium to medium-high intensities. The intensity of the sulphury aroma and flavour in the other wines was negligible. In addition to the canned/cooked vegetable and sulphury aromas and flavours, C_CS_L also differentiated from the other wines in terms of mouthfeel properties. The position of C_CS_L on the scores plot is further associated with pucker, numbing and bitter aftertaste. C_CS_L induced a more intense puckering sensation than C_CP_E and C_CP_L. C_CS_L also caused a more intense numbing sensation than C_C_E. Furthermore, C_CS_L had a significantly more bitter aftertaste than C_C_E, C_E_E, C_CS_E, C_PM_E, C_CP_E as well as C_E_L.
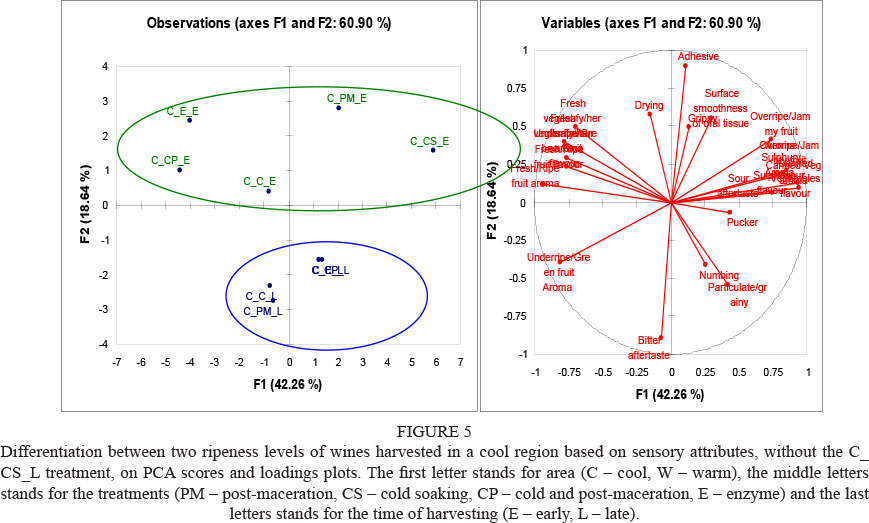
In order to visualise the differentiation between the two ripeness levels more clearly, it was decided to regard C_ CS_L as an outlier. A PCA was performed in which C_CS_L was excluded from the analyses. The total variance explained (60.9%) is shown in Table 5. On the PCA scores plot (Fig. 5), the wines from the two ripeness levels are separated on PC 2. The samples that were harvested earlier had positive loadings on PC 2, while the samples harvested later had negative loadings on PC 2. The loadings plot shows that the differentiation between the two ripeness levels is driven by mouthfeel attributes rather than aroma and flavour attributes.
As shown in the loadings plot, the attributes 'adhesive' and 'bitter aftertaste' were the most influential contributors to the differentiation between the samples on the PC 2 axis. According to the ANOVA results (Table 7), the early samples were more adhesive as a whole. However, only C_PM_E and C_PM_L differed on a statistically significant level from each other in this attribute. Similarly, the riper samples were all more bitter than the samples that were harvested earlier, but only C_C_E and C_C_L differed at a statistically significant level. Although C_CS_L was excluded from the PCA, the ANOVA results showed that this sample was significantly more bitter than C_CS_E. They did not differ significantly in terms of adhesiveness.
In addition to these two attributes, grippy, surface smoothness and numbing also contributed to the differentiation between ripeness levels. There was a trend that the samples harvested earlier were more grippy and had a finer surface smoothness overall, whereas the riper samples were generally more numbing.
The effect of tannin extraction method on the sensory attributes of wines in a cool area
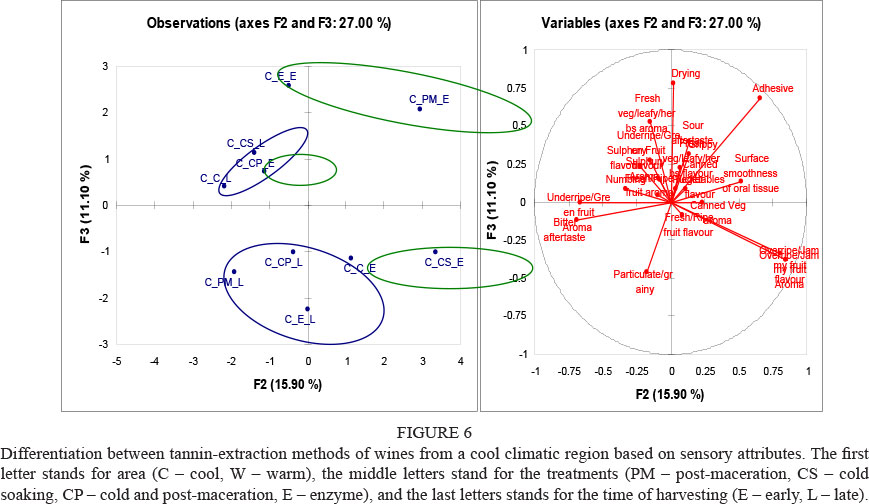
The differentiation between the tannin extraction treatments is shown more clearly in the second and third PCs of a PCA done on the sensory attributes of the wines (Fig. 6). The wines from the lower ripeness levels are circled in green in Fig. 6, and the wines from the riper ripeness level are circled in blue. In both cases, the control and cold soak wines were the most similar and separated from the other wines in the respective ripeness level on PC 3.
In the case of the wines from the grapes that were harvested earlier, the C and CS treatments differentiated the most from the E and PM treatments, while CP could be seen as an intermediate. The E and PM wines were both more drying and adhesive than the C and CS wines (positive association with PC 3). CP was more drying but not more adhesive than C and CS. C and CS were slightly more particulate/grainy, but not at a statistically significant level. In contrast, the C and CS treatments of the wines from the riper grapes were more drying than PM and E. The CS treatment was also more adhesive than PM and E. Furthermore, CS and C were more sour than PM and E. Therefore, although the treatments had a significant effect on the sensory properties of the wines, the way in which they differed changed as the ripeness level increased.
The influence of phenolic composition of the different ripeness levels in a cool area
Since the mouthfeel attributes were the main drivers of differentiation between two ripeness levels, only these attributes were considered in combination with the phenolic composition. A PCA on the mouthfeel and phenolic composition of the wines from the cooler region revealed trends between the different treatments, as well as between ripeness levels. The variance explained by the first three PCs is shown in Table 5.
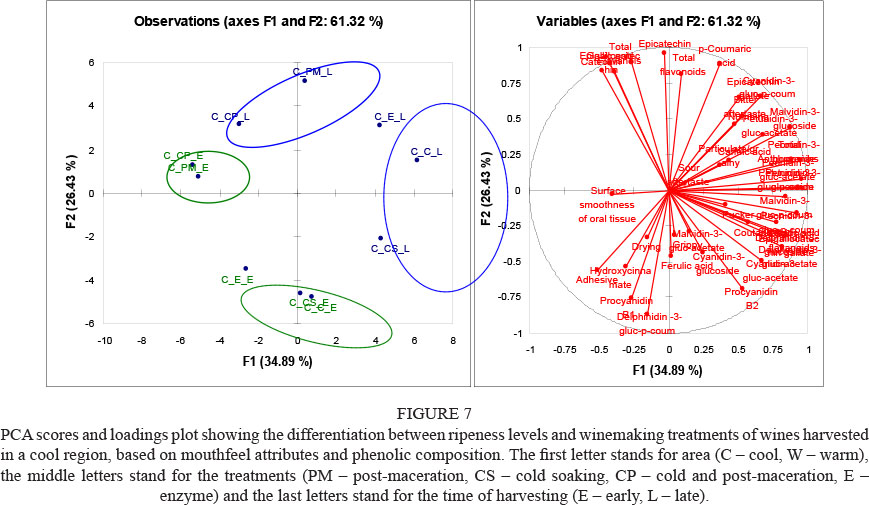
The different ripeness levels differentiated diagonally (from bottom left corner to top right corner) on the PCA scores plot (Fig. 7). The wines that were harvested at a lower ripeness level were associated with higher levels of hydroxycinnamate, procyanidin B1 and delphinidin-3-glucoside-p-coumaric acid, in addition to dryness, surface smoothness and adhesiveness (as illustrated in previous PCA). The wines that were harvested at a riper stage were associated with many of the anthocyanins/anthocyanin derivatives. Compounds that were strongly associated with ripeness were cyarudin-3-glucoside-p-coumaric acid, petunidin-3-glucoside-p-coumaric acid, malvidin-3-glucoside, peonidin-3-glucoside, petunidin-3-glucoside, petudinin-3-glucoside-acetate, peondidin-3-glucoside-acetate, total anthocyanins, epicatechin-gallate and p-coumaric acid. It is interesting that there is again a negative correlation between p-coumaric acid and delphinidin-3-glucoside-p-coumaric acid. As mentioned earlier, p-coumaric acid has a direct negative correlation with delphinidin-3-glucoside-p-coumaric acid, where the former is associated with grapes from a cooler climate and the latter with grapes from a warmer climate. In this case, delphinidin-3-glucoside-p-coumaric acid was associated with grapes that were harvested at a lower ripeness level, while p-coumaric acid was associated with grapes that were harvested at a riper stage.
The influence of phenolic composition on the different winemaking treatments in a cool area
Figure 7 also shows groupings among the winemaking treatments. Within each ripeness level there are two major sample groupings. In each case, the CP and PM treatments group together, while the E, C and CS treatments group together. There seems to be a larger variation between treatments in the wines that were harvested later (blue) than the wines that were harvested earlier (green). On this PCA it also appears that the CS treatment was closer to the control at a lower ripeness level, while the E treatment was more similar to the control at a higher ripeness level.
The differentiation between the CP and PM treatments and the C, E and CS treatment groups is driven mainly by phenolic composition. The CP and PM treatments are associated with higher levels of total flavanols, gallic acid, epigallocatechin and catechin. The C, E and CS treatments are associated with higher levels of cyanidin-3-glucoside-acetate, delphinidin-3-glucoside-acetate, delphinidin-3-glucoside and epigallocatechin gallate.
It is interesting that, in terms ofboth sensory and chemical data, the CS and C treatments appear to group together, and that the PM and CP treatments always are differentiated from the control. It also seems as if the perceived differences between the E and C treatments are larger than the phenolic composition suggests. The PM and CP treatments appear to have the biggest overall effect on mouthfeel and phenolic composition in a cool climate.
Overall effect of tannin and ripeness levels in a warm area
A PCA on the Plaisir de Merle samples from Phase 2 revealed the following trends and variations. The first two principal components explained 67.19% of the variance in the data set (Table 6)

As shown in Fig. 8, the ten samples from Plaisir de Merle formed distinct groups based on their sensory characteristics. Unlike the samples from Morgenster, there were no obvious outliers. In this case, the samples grouped according to treatment effect rather than ripeness effect. The enzyme (E) treatments, cold soak (CS) treatments and cold soak and post-maceration (CP) treatments formed separate clusters. This suggests that the effect of these three treatments on the sensory characteristics of the wines was stronger than the effect of ripeness level. In contrast, the control (C) treatments and post-maceration (PM) treatments had a direct negative correlation with their respective ripeness level counterparts. This suggests that the effect of these treatments on the sensory properties of wine was overshadowed by the effect of ripeness in this specific sample set.
The effect of tannin extraction method in a warm area
The two enzyme treatments were strongly differentiated from the rest of the samples due to high positive scores on both PC 1 and PC 2. PC 1 was positively associated with the following attributes: canned veggies aroma, stuffy aroma, savoury veggies aroma and flavour, particulate/graininess, adhesiveness, grippy, pucker, drying, numbing and bitter aftertaste. The two enzyme treatments were significantly more intense than many of the other treatments in these attributes. The significant differences are shown in Table 8 and will be discussed in more detail at a later stage.
PC 1 was also negatively associated with cordial aroma, fresh berry aroma and flavour, as well as surface smoothness. The two enzyme treatments had the least intense fresh berry aroma and flavour (Table 8). E_E did not have any cordial notes, whereas E_L had very weak cordial aroma notes. E_L was one of the coarsest samples, whereas E_E was average in terms of surface smoothness.
It appears as if the effect of the PM treatment on the sensory attributes of the wines was less significant than the other treatments, especially in the wines that were harvested earlier (Fig. 8). The PM_L treatment differentiated more from C_L, indicating that the effect of post-maceration was more significant in riper grapes.
The overall effect of ripeness on mouthfeel in a warm area
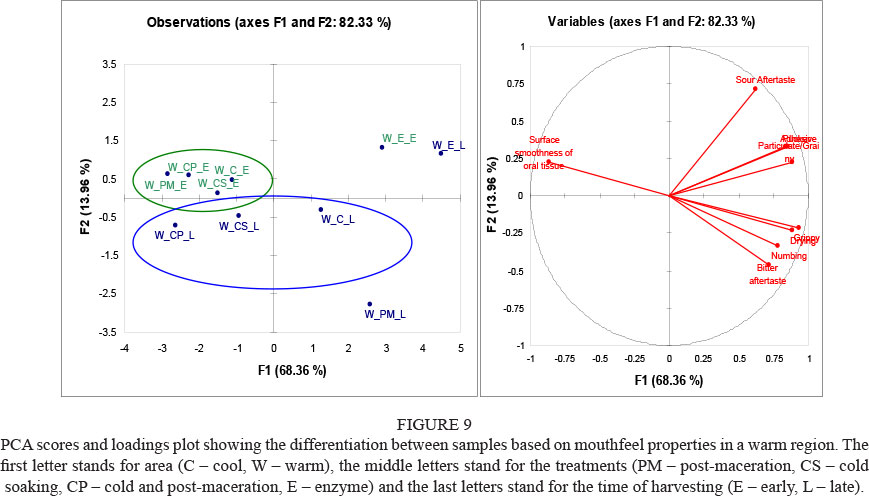
A PCA on the mouthfeel properties of the ten wines from Plaisir de Merle resulted in a clearer differentiation between wines from the two respective harvest dates (Fig. 9). The first two principal components explained 82% of the variance in the data (Table 6).
The differentiation of E_E, E_L and PM_L was still the most important source of variance in the data set, as shown in the separation of these three products from the rest of the set on PC 1. On PC 1, these samples were negatively associated with surface smoothness and, according to the ANOVA results, E_L and PM_L were perceived to have the coarsest surface smoothness. All the other mouthfeel attributes had strong positive loadings on PC 1 and therefore contributed to the separation of E_E, E_L and PM_L from the rest of the samples. Based on the ANOVA results, these samples, together with C_L, can collectively be regarded as the most 'astringent' overall. However, the 'astringency' of these four samples is manifested in different ways; therefore they are not clustered together on the PCA scores plot.
The differences between the harvest dates are more prominently described by PC 2. The wines from the earlier harvest date had positive loadings on PC 2, which was associated with the characteristics surface smoothness, sour aftertaste, adhesiveness, pucker and particulate grainy. On the opposite end of PC 2, associated with the riper grapes, are the attributes drying, grippy, numbing and bitter aftertaste.
The treatments PM, E and C that were harvested earlier were significantly finer on surface smoothness than their riper counterparts. CP_E and CP_L did not differ significantly on surface smoothness. CS_L was the exception, where the riper grapes resulted in smoother wines. All the wines that were made from riper grapes were perceived as more numbing than their earlier harvested counterparts. These differences were significant in the cases of PM and CS, but not in the rest of the treatments. Overall, the wines were not perceived as very numbing. PM_L caused a significantly more dry sensation than PM_E. The enzyme and control treatments were also perceived as more drying and grippy when made from riper grapes, but not at a statistically significant level. This trend was not observed in the CS and CP treatments, and the differences between harvest dates of these two treatments were not significant in terms of drying or grippiness. All the wines made from riper grapes were perceived as more bitter than their less ripe counterparts. The difference was only significant for the PM treatment. The CS treatment had the second largest difference between early and later harvested grapes in terms of bitterness.
The influence of chemical composition in a warm area
Including the chemical parameters in the PCA increased the differentiation between harvest dates even more (Fig. 10). A PCA done on the mouthfeel and detailed phenolic composition of the wines explained 57% of the variance in the data in the first two PCs (Table 6). The third PC contributed a further 15% to the total explained variance (accumulating to 73%). The differentiation between ripeness levels was explained on PC 2, where the riper grapes were positively associated and the more unripe grapes were negatively associated with PC 2.
Epicatechin gallate was strongly associated with the negative side of PC 2 and therefore with the riper grapes. Petunidin-3-glucoside, malvidin-3-glucoside, malvidin-3-glucoside-acetate and malvidin-3-glucoside-p-coumaric acid were also associated with riper grapes, but to a lesser extent.
On the opposite end of PC 2, the grapes that were harvested later were associated with bitterness, procyanidin B2, caffeic acid, p-coumaric acid and total non-flavonoids. Numbing, catechin and coutaric acid also contributed to the differentiation on PC 2, but to a lesser extent. The inverse relationship between p-coumaric acid and delphinidin-3-gluc-p-coum was not significant.
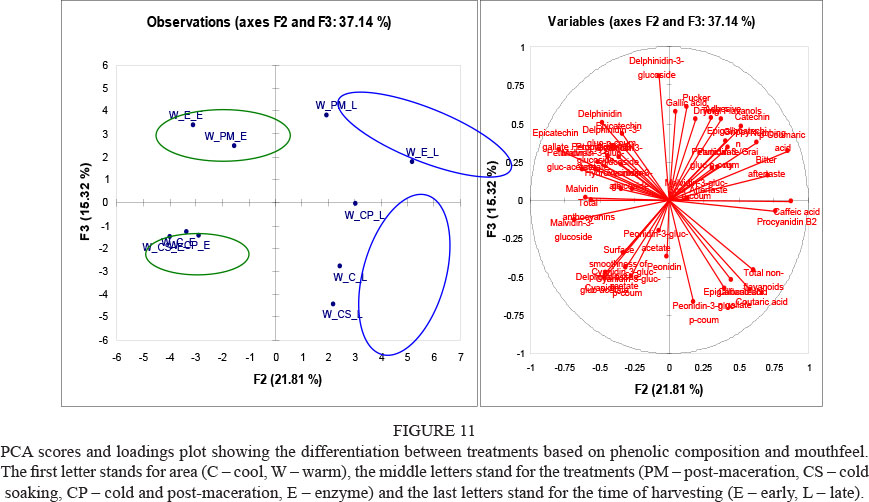
The third PC highlights the influence of the phenolic composition on the clustering among treatments (Fig. 11). Within each ripeness level, the E and PM treatments are positioned in one cluster, with positive scores on PC 3. The C, CS and CP treatments form a second cluster with negative scores on PC 3 for each ripeness level. Interestingly, the clustering among the riper group is less concentrated than in the less ripe group. This may suggest that the effect of the treatments on the phenolic and mouthfeel of the wines becomes more obvious as ripeness increases.
Based on the variable loadings, it appears as if the E_E and PM_E group is associated with the compounds delphinidin, epicatechin, delphinidin-3-glucoside-p-coumaric acid, epicatechin gallate and delphinidin-3-glucoside. In contrast, the CS_E, C_E and CP_E cluster seems to be associated with cyanidin, cyanidin-3-glucoside-p-coumaric acid and cyanidin-3-glucoside-acetate. It appears as if the differentiation between the E and PM treatments from the rest of the treatments in the group harvested early is based on an interrelationship between delphinidin, cyanidin and their derivatives.
In the riper group, on the right side of the scores plot, the PM_L and E_L cluster is associated with gallic acid, catechin, total flavanols, p-coumaric acid and delphinidin-3-glucoside. At the opposite end of PC 3, the CS_L, C_L and CP_L cluster is associated with epigallocatechin gallate, caftaric acid, coutaric acid, total non-flavonoids and peonidin-3-glucoside-p-coumaric acid. In this case, the differentiation between the clusters does not appear to be related to specific groups of non-flavonoids, but rather to total non-flavonoids.
The relationship between mouthfeel and phenolic composition in a warm area
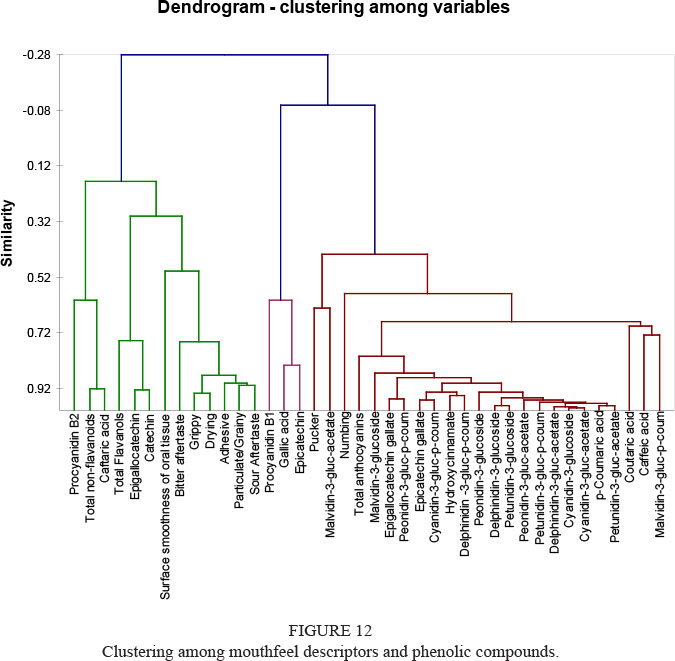
Hierarchical cluster analysis (Fig. 12) showed that the mouthfeel and phenolic compounds formed three clusters. The smallest cluster consisted of procyanidin B1, gallic acid and epicatechin. These variables did not seem to have a strong relationship with any of the mouthfeel attributes.
Another cluster consisted of mostly anthocyanins and anthocyanin derivatives, along with epicatechin gallate, epigallocatechin gallate, hydroxycinnamate, p-coumaric acid, caffeic acid and coutaric acid. The mouthfeel attributes, pucker and numbing, were also associated with this group. The puckering sensation was closely associated with malvidin-3-glucoside-acetate, while the numbing sensation was associated with anthocyanins as a whole.
In the final cluster, procyanidin B2, total non-flavonoids, caftaric acid, total flavanols, epigallocatechin and catechin clustered together, along with the rest of the mouthfeel attributes. However, this cluster is less homogenous than the first cluster, which suggests that the relationship of numbing and puckering with the phenolic compounds in the first cluster is stronger than the relationship between the mouthfeel and phenolic variables in the second cluster.
Relationship of MP, SPP and LPP with mouthfeel properties of wine
A PCA was performed to investigate the interrelationships between the monomeric pigments (MP), short polymeric pigments (SPP) and long polymeric pigments (LPP), and mouthfeel attributes. LPP, MP and SPP are strongly correlated with each other and with PC 1 (Fig. 13). Furthermore, the compounds are associated more with samples from the warm climatic region, late harvest, and specifically with the control, enzyme and cold soak treatments. SPP, LPP and MP are correlated with bitter aftertaste, particulate, sour aftertaste, grippy and drying mouthfeel attributes. Furthermore, MP, SPP and LPP are negatively correlated (Pearson's correlation co-efficient of P < 0.05) with procyanidin B1, epicatechin and gallic acid.
CONCLUSIONS
Three experimental factors were evaluated in this study, namely climatic region, ripeness level and tannin extraction method. Of these three, climatic region had the biggest effect on mouthfeel and phenolic composition.
The wines from the cooler region were generally associated with higher levels of total non-flavonoids and total anthocyanins and more intense numbing and puckering sensations. In contrast, the wines from the warmer region as a group were associated with a more drying and grippy mouthfeel, as well as less total anthocyanins and total non-flavonoids. There also was evidence that a warmer climate may encourage the binding of p-coumaric acid and delphinidin-3-glucoside, although this still has to be confirmed in a follow-up vintage.
Within the group of wines harvested in a cooler climate, the ripeness level had a larger impact on the mouthfeel and phenolic composition than the treatment effects. There was a trend that the samples harvested earlier were more adhesive and grippy and had a finer surface smoothness overall, whereas the riper samples were generally more bitter and numbing. In the cooler region, the ripeness level also affected the phenolic composition of the wines. The wines that were harvested at a riper stage were associated with many of the anthocyanins/ anthocyanin derivatives and were negatively associated with hydroxycinnamate, procyanidin B1 and delphinidin-3-glucoside-p-coumaric acid. The inverse relationship between p-coumaric acid and delphinidin-3-glucoside-p-coumaric acid was observed again, where p-coumaric acid was associated with riper grapes. In comparison to wines from the cooler region, grapes harvested later resulted in a coarser surface smoothness, a more numbing sensation, a bitter aftertaste and less adhesive mouthfeel. In terms of phenolic composition, the riper grapes were again associated with anthocyanins/anthocyanin derivatives, but were this time strongly associated with procyanidin B2, caffeic acid, p-coumaric acid, catechin and coutaric acid and total non-flavonoids.
The effect of tannin extraction method on the sensory properties of the wines from the warmer region was more pronounced than in the wines from the cooler region. However, within both regions there was a larger variance between treatments when riper grapes were used, in terms of both mouthfeel and phenolic composition. In both regions the specific effect of the treatments on mouthfeel changed as the ripeness levels of the grapes increased. This was especially evident in wines from the cooler climate. In addition, the treatment effect on the phenolic composition of the wines was more pronounced in riper grapes.
However, the enzyme treatment was generally associated with a more drying and adhesive character. Interestingly, the enzyme treatment had a larger effect on mouthfeel than the phenolic composition suggested, especially in the cooler climate.
It also appears as if the cold soak treatment generally had the smallest effect on mouthfeel and phenolic composition, while the post-maceration treatment had the largest effect, regardless of ripeness or region. The control and cold soak treatments were consistently associated with cyanidin-3-glucoside-acetate in grapes harvested at a lower ripeness level, while the post-maceration treatment was consistently associated with catechin, gallic acid and total flavanols in riper grapes.
In conclusion, phenolic composition and mouthfeel are strongly influenced by climatic region. In warmer climates, the effect of ripeness on mouthfeel is smaller than in cooler climates. The effect of the five tannin-extraction methods differed depending on climatic region and ripeness level. At this point it is not clear if the specific way in which astringent mouthfeel is manifested in wine can be manipulated consistently by tannin-extraction methods. SPP, LPP and MP are also correlated with bitter aftertaste, particulate, sour aftertaste, grippy and drying mouthfeel attributes.
LITERATURE CITED
American Society for Testing and Materials (ASTM). 1989. Standard definitions of terms relating to sensory evaluation of materials and products. In: Annual Book of ASTM Standards. American Society for Testing and Materials, Philadelphia. [ Links ]
Donovan, J.L., Meyer, A.S. & Waterhouse, A.L., 1998. Phenolic composition and antioxidant activity of prunes and their juice (Prunus domestica). J. Agric. Food Chem. 46, 1247-1252. [ Links ]
Fontoin, H., Saucier, C., Teissedre, P-L. & Glories, Y., 2008. Effect of pH, ethanol and acidity on astringency and bitterness of grape seed tannin oligomers in model wine solution. Food Qual. Pref. 19, 286-291. [ Links ]
Gawel, R., 1998. Red wine astringency: A review. Austr. J. Grape Wine Res. 4, 74-95. [ Links ]
Gawel, R., Francis, I.L. & Waters, E.J., 2007. Statistical correlations between the in-mouth textural characteristics and the chemical composition of Shiraz wines. J. Agric. Food Chem. 55, 2683-2687. [ Links ]
Gawel, R., Iland, P.G. & Francis, I.L., 2001. Characterizing the astringency of red wine: A case study. Food Qual. Pref. 12, 83-94. [ Links ]
Gawel, R., Oberholster, A. & Francis, I.L., 2000. A "Mouth feel Wheel": Terminology for communicating the mouth feel characteristics of red wine. Aust. J. Grape Wine Res. 6, 203-207. [ Links ]
Landon, J.L., Weller, K., Harbertson, J.F. & Ross, C.F., 2008. Chemical and sensory evaluation of astringency in Washington State red wines. Am. J.Enol. Vitic. 59(2), 153-158. [ Links ]
Lawless, H.T. & Heymann, H., 1995 (1st ed). Sensory evaluation of food. USA: Chapman & Hall. [ Links ]
Lee, C.A. & Vickers, Z.M., 2009. Discrimination among astringent samples is affected by choice of palate cleanser. Food Qual. Pref. 1-7. [ Links ]
Oberholster, A., Francis, I.L. Iland, P.G. & Waters, E.J., 2009. Mouth feel of white wines made with and without pomace contact and added anthocyanins. Aust. J. Grape Wine Res. 16, 59-69. [ Links ]
Vidal, S., Courcoux, P., Francis, I.L., Kwiatkowski, M., Gawel, R., Williams, P., Waters, E. & Cheynier, V., 2004b. Use of an experimental design approach for evaluation of key wine components on mouth feel perception. Food Qual. Pref. 15, 209-217. [ Links ]
Vidal, S., Francis, I.L, Williams, P., Kwiatkowski, M., Gawel, R., Cheynier, V. & Waters, E., 2004a. The mouth feel properties of polysaccharides and anthocyanins in a wine like medium. Food Chem. 85, 519-525. [ Links ]
Winkler, A.J., 1965 (2nd ed.). General Viticulture, USA. [ Links ]
Date of submission for publication: June 2014
Date of acceptance for publication: July 2014
*Corresponding author: E-mail: pvanrensburg@distell.co.za


