


Serviços Personalizados
Artigo
 Inglês (pdf)
 Artigo em XML
 Referências do artigo
Indicadores

Links relacionados
-
 Citado por Google
 -
 Similares em Google
Compartilhar

 Permalink
South African Journal of Enology and Viticulture
versão On-line ISSN 2224-7904
versão impressa ISSN 0253-939X
S. Afr. J. Enol. Vitic. vol.35 no.2 Stellenbosch 2014
Use of boundary lines to determine effects of some salinity-associated soil variables on grapevines in the Breede River Valley
P.A. Myburgh; C.L. Howell*
ARC Infruitec-Nietvoorbij, the Fruit, Vine and Wine Institute of the Agricultural Research Council, Private Bag X5026, 7599, Stellenbosch, South Africa
ABSTRACT
The boundary line concept was used to assess grapevine responses to salinity-associated soil variables. Soil chemical status and grapevine responses were measured in 13 vineyards in the Breede River Valley during the 2001/2002 season. Chardonnay grafted onto 110R and 101-14 Mgt, as well as Ruby Cabernet on the same two rootstocks, was included. The selected vineyards were representative of the variation in salinity-associated soil variables, as well as of leaf and juice element contents previously reported for South African vineyards. Under the prevailing conditions, the four scion-rootstock combinations responded similarly to the salinity-associated variables. The results confirm that soil pH should be at least 6.0 for grapevines. The salinity threshold for vineyards in the Breede River Valley should be between 0.7 dS/m and 1.5 dS/m to avoid growth and yield reductions. To reduce the risk of Na toxicity, the SAR should be below 3, and the soluble Na content in the soil should not exceed 5 mg/kg. If gypsum is used to reduce soil Na, it should be applied judiciously to avoid soil SO4 accumulation, thereby reducing the risk of K and Mg deficiencies. Under the prevailing conditions, B and Cl toxicity apparently contributed to reduced vegetative growth. Therefore, soil Cl and B should be kept as low as possible, but care should be taken that B is not reduced to deficient levels. The boundary line concept proved to be useful for determining the effect of a single salinity-associated soil variable on grapevine response.
Key words: Juice characteristics, sodicity, thresholds, toxicity, vegetative growth, yield
INTRODUCTION
Saline soil conditions occur naturally in some vineyards, particularly in the semi-arid areas of South Africa. High salt content can increase osmotic potential in the soil solution to such an extent that water uptake by plant roots is reduced. Consequently, plants may exhibit drought symptoms in saline soils, although there is adequate soil water to sustain physiological functioning. In severe cases, water can also flow from plant cells to the soil solution, causing dieback of plants. Saline soil conditions may reduce K uptake and induce deficiencies, which usually can be recognised visibly by necrotic leaf edges (Walker, 1994; Marschner, 1995). In addition to the negative effects of total salt contents, there is ample evidence that Na and Cl are problematic, since their toxic effects cause reductions in grapevine vegetative growth and yield (Moolman et al., 1999; De Clercq et al., 2001; Walker et al., 2002; Zhang et al., 2002). High levels of Na can suppress the uptake of Ca, which is needed for cell division and elongation, as well as protein secretion and gene expression (Zocchi & Mignani, 1995). Due to the negative effects of excessive Na intake on human health (Martínez-Ballesta et al., 2010), Na concentrations are not allowed to exceed prescribed maxima in certain foods. In South Africa, Na contents in wine must be less than 100 mg/L (Department of Water Affairs & Forestry, 1996). However, according to Leske et al. (1997), the L'Organisation Internationale de la Vigne et du Vin (OIV) recommends that wine Na should be less than 60 mg/L. Excessive K uptake may have negative effects on wine quality, particularly in red wine. High K levels in grapes, and eventually in the wine, could increase wine pH, which will reduce the colour stability of red wine upon ageing (Mpelasoka et al., 2003 and references therein). Therefore, viticultural practices should be adapted to minimise the uptake and accumulation of problematic ions in grapevines. Adaptations can only be based on knowledge regarding the interaction between soil salinity and grapevines. The objective of this study was to determine whether the boundary line concept could be used to determine the effects of salinity-associated soil variables on grapevine growth, yield and juice characteristics.
MATERIALS AND METHODS
The study was carried out in 13 full-bearing vineyards near Robertson in the Breede River Valley during the 2001/2002 season. The region has a Mediterranean climate, i.e. warm, dry summers with a mean annual rainfall of c. 300 mm. Based on the growing degree days (GDD) from September until March (Winkler, 1962), the Robertson area is in a class V climatic region. Chardonnay/110R (three vineyards), Chardonnay/101-14Mgt (three vineyards), Ruby Cabernet/110R (three vineyards) and Ruby Cabernet/101-14Mgt (four vineyards) were included in this study. All vineyards were trained onto vertical trellises and drip irrigated. Each vineyard had a poor-performing patch, presumably caused by saline or sodic soil conditions. In September 2001, soil samples were taken along a grapevine row from the centre of the poor patch up to a point where grapevines showed no constraints. Samples were taken at every second or third grapevine, depending on the size of the poor patch. In total, soil samples were taken from the 0 to 30 cm and 30 cm to 60 cm layers at 102 grapevines. A Thompson auger was used to collect these samples c. 30 cm from a grapevine. Soil pH(KCl), electrical conductivity (ECe), as well as water-soluble K, Ca, Mg, Na, Cl and SO4 in the saturated soil extract, were determined for all samples. The sodium adsorption ratio (SAR) and potassium adsorption ratio (PAR) were calculated from the K, Ca, Mg and Na concentrations. Leaf N, P, K, Ca, Mg, Na, B, Cl and SO4 contents were determined at harvest in mature, unscathed leaves opposite a bunch on the second spur. Yield per grapevine was determined when the total soluble solids (TSS) reached 20±2°B and 22±2°B for the Chardonnay and Ruby Cabernet respectively. Since wine quality evaluation was beyond the scope of the study, grapes were picked when the TSS was lower than the targets for winemaking to avoid grapes being harvested by growers before the yields of the experiment grapevines were determined. Juice pH, TSS and total titratable acidity (TTA) were determined according to the standard procedures of the winery at ARC Infruitec-Nietvoorbij. Juice K, Ca, Mg and Na contents were also determined. Juice B and Cl were not determined. Soil, leaf and juice samples were analysed at the ARC Infruitec-Nietvoorbij according to recommended procedures (Lategan, 2011). Cane mass per grapevine was measured at pruning in August 2002.
The advantage of collecting data as described above is that the grapevines were in equilibrium with their environment, as opposed to more conventional experiments where grapevines are subjected to treatments, e.g. level of nutrition or irrigation, and have to adjust within a limited period. Since basic statistical analysis procedures could not be used, it was decided to evaluate trends in grapevine and juice responses to soil conditions according to the boundary line concept (M.E. Sumner, personal communication, 2003). The latter concept entails collecting a set of observations that represent the variability encountered in the real world, i.e. in practical field situations (Walworth et al., 1986). A scatter diagram of plant response is plotted against a plant growth factor. In most cases it would be possible to draw a line, or lines, which confine the data. These boundary lines would then describe the sole effect of a plant growth factor, e.g. soil chemical status, where no other limitations occur. This means that, although the soil chemical status may be sound, other soil or environmental constraints could impede plant functioning. The boundary line concept was used to develop a relationship between leaf Ca and the occurrence of bitter pit in apples under South African conditions (Terblanche, 1985). This was achieved by carrying out extensive surveys on apple trees cultivated under a wide range of conditions. Maximum grain yield in relation to total rainfall during the growing season was quantified in a similar way (Wentzel, 2003).
RESULTS AND DISCUSSION
Leaf element content
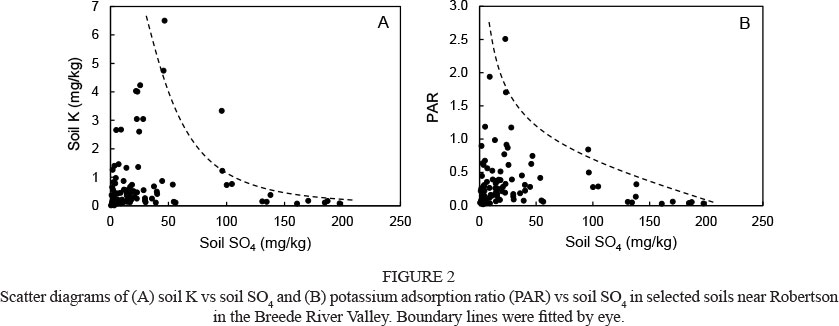
Leaf N contents ranged between 1.3% and 2.7%, which was comparable to the norm of 1.5% to 2.4% proposed for grapevines by Conradie (1994). Leaf P contents varied between 0.10% and 0.26%, which was also close to the norm of 0.12% to 0.45% for grapevines (Conradie, 1994). However, under the prevailing conditions, variation in leaf N and P could not be related to salinity-associated soil variables, which agrees with previous findings (Prior et al., 1992). In a substantial number of samples, leaf K contents fell outside the proposed minimum (0.55%) and maximum (1.05%) (Conradie, 1994). Leaf K increased with soil pH to a maximum, followed by a decline (Fig. 1A). Since exchangeable Na can be high if the pH in the saturated paste exceeds 8.2 (Abrol et al., 1988), the decline above pH 7.5 suggested that Na could have suppressed K uptake. The unexpected low pH, i.e. < 4.0, associated with saline conditions indicated acid-saline soils. These soils are formed by the oxidation of FeS2 (pyrite) to H2SO4 and other reduced sulphur compounds (Abrol et al., 1988). Visual observations revealed that grapevines performed poorly where these acid-saline soils occurred. Leaf K also declined with an increase in soil SO4 content (Fig. 1B). Sulphate salinisation is known to reduce K in plant tissues (Marschner, 1995). For the range of soils in this study, the soil K and PAR decreased as the SO4 increased (Fig. 2). Therefore, higher SO4 concentrations seemed to have reduced K availability, which reflected in lower leaf K contents. As discussed above, low pH(KCl) values could be associated with acid-saline soils containing high SO4 levels. On the other hand, high SO4 levels in association with higher soil pH(KCl) indicates free gypsum, or gypsum applied to poor performing vineyards. Verification of the latter aspect was beyond the scope of the study.
In most samples, leaf Ca ranged between 1.5% and 2.4%, i.e. the proposed limits for grapevines (Conradie, 1994). Leaf Ca reached a maximum at soil pH 7 (Fig. 1C). Decreasing leaf Ca as soil Na:Ca increased indicated that high soil Na might have suppressed Ca uptake and accumulation in the leaves (Fig. 1D). Similar antagonistic effects were reported for Ca uptake by other plants (Abrol et al., 1988 and references therein) and grapevine tissue (Stevens et al., 2011 and references therein). Given the levels of leaf Ca, this antagonism seems unlikely to have induced serious Ca deficiencies. Leaf Mg contents were higher than the minimum of 0.2% (Fig. 1E), and some exceeded the proposed maximum of 0.6% (Conradie, 1994). Unlike leaf Ca, leaf Mg contents showed no clear trend with respect to soil pH(KCl), soluble Mg or any other cation in the saturated soil extract. However, leaf Mg decreased with increasing PAR (Fig. 1E), which suggested a K-induced suppression of Mg uptake (Marschner, 1995). Leaf Mg tended to decline as soil SO4 content increased (Fig. 1F), probably due to sulphate salinisation (Marschner, 1995). Given the relatively high leaf Mg contents, the suppressing effects of K and SO4 were not likely to have caused Mg deficiencies under the given conditions.
All leaf Na contents were lower than the maximum of 0.25% for grapevines (Conradie, 1994) (Fig. 1G). Leaf Na values were also substantially lower than c. 0.6% reported for Colombar grapevines irrigated with saline water in the Breede River Valley (Moolman et al., 1999). Soil pH(KCI), water-soluble Na and SAR had no effect on Na accumulation in the grapevine leaves (data not shown). However, leaf Na declined with an increase in soil K:Na (Fig. 1G), which suggested that K probably suppressed Na uptake, thereby preventing Na accumulation to toxic levels. Previous findings showed that the rootstock 101-14Mgt suppressed Na uptake compared to own-rooted grapevines when the irrigation water EC was 0.43 dS/m (Walker et al., 2000). However, 101-14Mgt did not suppress Na uptake compared to own-rooted grapevines when the irrigation water EC was 2.3 dS/m. In the present study, the effect of soil K:Na on leaf Na content was not affected by scion or rootstock cultivar.
Leaf B contents were higher than the minimum of 0.0025% (Fig. 1H), but some exceeded the proposed maximum of 0.01% (Conradie, 1994). Since B adsorption occurs above pH 8.0 (Goldberg, 1997), B deficiencies would not be expected, given the pH(KCl) range as indicated in Fig. 1A. Leaf B tended to decrease with an increase in soil Na content (Fig. 1H), probably due to the formation of NaB(OH)4 (sodium borate) (Abrol et al., 1988; Marschner, 1995). This suggests that low Na levels could increase the risk of excessively high B absorption by grapevines. Leaf Cl contents ranged between 0.1% and 0.83%, indicating that the toxicity level of 0.5% (Conradie, 1994) was exceeded in some grapevines. However, leaf Cl contents were substantially lower than the 2% to 12% reported for Colombar grapevines irrigated with water containing between 117 mg/L and 1 760 mg/L Cl (Moolman et al., 1999). Except for a tendency to decrease with an increase in water-soluble K, leaf Cl could not be related to any of the soil chemical variables. This was probably because Cl in the soil (i) is not adsorbed by clay minerals, (ii) leaches easily from free-draining soils and (iii) can accumulate from external sources such as irrigation water (Mengel & Kirby, 1987). Furthermore, there is a possibility that the rootstocks could have affected Cl uptake.
Leaf Cl content was 0.08% for Shiraz/101-14Mgt compared to 0.25% in leaves of own-rooted grapevines when irrigation water contained 88 mg/L Cl (Walker et al., 2000).
Vegetative growth
Cane mass tended to increase with an increase in leaf K, reaching a maximum at c. 1.5% (Fig. 3A). This level was slightly higher than the proposed maximum leaf K norm of 1.05% (Conradie, 1994). In the case of Chardonnay/110R, cane mass remained at c. 1.4 t/ha, despite leaf K increasing to 2.5% (Fig. 3A). This suggests that vegetative growth is unlikely to respond to excessively high leaf K. Maximum cane mass corresponded with c. 2.4% leaf Ca (Fig. 3B), which was equal to the proposed maximum (Conradie, 1994). Maximum cane mass occurred at c. 0.4% leaf Mg (Fig. 3C), which was within the proposed norm of 0.2% to 0.6% (Conradie, 1994). Cane mass declined with increasing leaf Na (Fig. 3D). Maximum shoot growth was obtained at leaf Na values of less than c. 0.05%, which was appreciably lower than the toxicity level of 0.25% (Conradie, 1994). This suggests that the latter Na norm could be too high for grapevines in the Breede River Valley. Boron toxicity, which is often encountered under saline conditions (Yermiyahu et al., 2008 and references therein), probably reduced the cane mass as leaf B exceeded 0.005% (Fig. 3E). Therefore, the toxicity level of 0.01% for leaf B proposed by Conradie (1994) could be too high for the vineyards included in the study. Due to the low toxicity level, irrigation water should be free of B, since concentrations as low as 1.5 mg/L in irrigation water can cause toxicity (Faust, 1989 and references therein). A possible Cl toxicity effect could have contributed to the decline in cane mass, as leaf Cl exceeded 0.2% (Fig. 3F). This suggests that the leaf Cl toxicity level of 0.5% proposed by Conradie (1994) could be too high for grapevines under the prevailing conditions. In addition to effects of leaf element contents, cane mass increased with an increase in soil pH(KCl) (Fig. 4A). The cane mass increase became more prominent above pH(KCl) 6, which corresponds to the lower threshold recommended for grapevines (Conradie, 1983). Cane mass declined at a rate of 0.26 kg per dS/m, i.e. 14% per dS/m (Fig. 4B), but a definite salinity threshold value could not be identified. The rate of cane mass decrease with increasing ECe was comparable to the 13% per dS/m reported for grapevines by Shani and Ben-Gal (2005).
Yield
Following a threshold at SAR c. 3, yield declined at a rate of 6.3% per SAR unit (Fig. 4C). A substantially steeper yield decline occurred when Colombar/99R was subjected to saline irrigation in the Breede River Valley (De Clercq et al., 2001). Following a threshold at c. 5 mg/kg Na, yield declined at a rate of 3% per mg/kg water-soluble Na, with zero yield occurring at c. 33 mg/kg. These results indicated that Na toxicity could have contributed to the yield variation under the given conditions. Although toxic soil Cl levels, viz. > 0.57 mg/kg (Abrol et al., 1988), occurred in some soils, it could not be related to yield variation (data not shown). Yield began to decline at a salinity threshold of c. 1.5 dS/m (Fig. 4D). This value was substantially higher compared to the 0.7 dS/m reported for Colombar in the Breede River Valley (Moolman et al., 1999), but less than the 1.8 dS/m considered to be a general threshold for grapevines (Abrol et al., 1988 and references therein). Following the threshold, yield declined at 13% per dS/m (Fig. 4D), which was comparable to 14.4% per dS/m reported for grapevines (Shani & Ben-Gal, 2005). This decline was steeper than the generally accepted norm of 10% per dS/m (Abrol et al., 1988 and references therein), but not as steep as the 33% per dS/m reported for Colombar/99R (Moolman et al., 1999). Scion-rootstock combination may play a role in the effect of salinity on grapevine yield (Zhang et al., 2002). However, the combinations used in the present study did not seem to have any effect. The boundary line indicated that zero yields would occur at c. 8 dS/m (Fig. 4D), which corresponds to the lower limit for moderately sensitive fruit crops proposed by Abrol et al. (1988). The foregoing suggests that grapevines in the Breede River Valley should be regarded as "sensitive" to salinity, rather than as "moderately sensitive".
Juice element contents
Juice K varied within the range of 600 mg/L to 2 000 mg/L reported for grapevines in the Breede River Valley (Moolman et al. , 1999). Despite this variation, juice K did not show any prominent trends with respect to salinity-associated soil variables. However, it should be noted that juice K can be highly variable due to scion-rootstock combination, canopy characteristics and irrigation strategies (Mpelasoka et al., 2003). Under the given conditions, R110 tended to enhance juice K compared to 101-14 Mgt, irrespective of scion cultivar (data not shown). Juice Ca content was lower than the maximum of c. 140 mg/L reported by Moolman et al. (1999). Similar to the leaves, Ca uptake and accumulation in the berries was also related to soil pH(KCl) (Fig. 5A). Juice Ca also decreased with an increase in soil SO4, suggesting a possible ionic association, but the trend was less prominent than for leaf Ca (data not shown). In most samples, juice Mg levels were higher than 60 to 70 mg/L reported for grape juice (Conradie, 2001; Wooldridge et al., 2010). Similar to K, juice Mg did not show any trends with respect to salinity-associated soil variables. In this study, juice Na was lower than the 200 mg/L reported for Colombar irrigated with c. 5 dS/m water in the Breede River Valley (Moolman et al., 1999). Similar to leaf Na, variation in juice Na was soil related, i.e. juice Na decreased as soil (K + Ca):Na increased (Fig. 5B). Since the ratio between juice Na and wine Na was found to be practically 1:1 (Moolman et al., 1999), the soil (K + Ca):Na should preferably be higher than 3 to reduce the risk of excessively high Na in the juice and wine. Under the prevailing conditions, TTA did not show any trends with respect to salinity-associated soil variables. Likewise, the latter did not affect juice pH, probably due to the fact that it did not contribute to the variation in juice K.
CONCLUSIONS
The boundary line concept proved to be useful to determine the effect of a single salinity-associated soil variable on grapevine response. The selected vineyards were representative of the variation in salinity-associated soil variables, as well as of leaf and juice element contents previously reported for South African vineyards. It was confirmed that soil pH should preferably be at least 6.0 to allow adequate mineral uptake and vegetative growth. Due to the 13% yield decline per dS/m, grapevines in the Breede River Valley should be classified as "sensitive" to salinity, rather than as "moderately sensitive". The salinity threshold should be between 0.7 dS/m and 1.5 dS/m. Applying irrigation to maintain lower thresholds will lead to over irrigation and increase the risk of leaching excessive salts into natural water resources. In most cases, concentrations of a specific ion in the leaves or juice were not directly related to the concentration of the same ion in the soil solution. However, leaf and juice ion concentrations could be related to ratios between other ions in the soil solution. To reduce the risk of Na toxicity in the Breede River Valley, the SAR should be maintained below 3, whereas the soluble Na in the soil should not exceed 5 mg/kg. If soil physical conditions allow adequate internal drainage, this could be achieved by lowering Na concentrations by means of gypsum application and/or leaching with non-sodic irrigation water. If gypsum is applied, care should be taken that SO4 in the soil solution does not exceed c. 40 mg/kg to avoid possible K and Mg deficiencies. The results indicated that Cl toxicity might have contributed to the variation in grapevine growth. Since high Cl levels in irrigation water are more likely to cause toxic levels in grapevines than soil-derived Cl, water quality management is an important consideration in saline environments. The selected scion-rootstock combinations did not have prominent effects on the relationships between grapevine responses and salinity-associated soil variables under the given conditions.
LITERATURE CITED
Abrol, I.P., Yadav, J.S.P. & Massoud, F.I., 1988. Salt-affected soils and their management. FAO Soils Bull. 39, FAO, Rome. [ Links ]
Conradie, W.J., 1983. Liming and choice of rootstocks as cultural techniques for vines in acid soils. S. Afr. J. Enol. Vitic. 4, 39-44. [ Links ]
Conradie, W.J., 1994. Vineyard fertilisation. Proceedings of workshop on vineyard fertilization. Nietvoorbij, 30 September 1994. ARC Infruitec-Nietvoorbij, Private Bag X5026, 7599 Stellenbosch, South Africa. [ Links ]
Conradie, W.J., 2001. Timing of nitrogen fertilisation and the effect of poultry manure on the performance of grapevines on sandy soil. II. Leaf analyses, juice analyses and wine quality. S. Afr. J. Enol. Vitic. 22, 60-68. [ Links ]
De Clercq, W.J., Fey, M.V., Moolman, J.H., Wessels, W.P.J., Eigenhuis, B. & Hoffman, J.E., 2001. Experimental irrigation of vineyards with saline water. WRC Report No 695/1/01, Water Research Commission, Pretoria. [ Links ]
Department of Water Affairs & Forestry, 1996. South African Water Quality Guidelines Vol. 4. Agricultural Use: Irrigation. Private Bag X313, 0001, Pretoria, South Africa. [ Links ]
Faust, M., 1989. Physiology of temperate zone fruit trees. Wiley, New York. [ Links ]
Goldberg, S., 1997. Reaction of boron with soils. Plant Soil 193, 35-48. [ Links ]
Lategan, E.L., 2011. Determining of optimum irrigation schedules for drip irrigated Shiraz vineyards in the Breede River Valley. Thesis, Stellenbosch University, Private Bag X1, 7602 Matieland (Stellenbosch), South Africa. [ Links ]
Leske, P.A., Sas, A.N., Coulter, A.D., Stockley, C.S. & Lee, T.H., 1997. The composition of Australian grape juice: Chloride, sodium and sulphate ions. Aust. J. Grape Wine Res. 3, 26-30. [ Links ]
Marschner, H., 1995. Mineral nutrition of higher plants. Academic Press, London. [ Links ]
Martínez-Ballesta, M.C., Dominguez-Perles, R., Moreno, D.A., Muries, B., Alcaraz-López, C., Bastías, E., García-Viguera, C. & Carvajal, M., 2010. Minerals in plant food: Effect of agricultural practices and role in human health. A review. Agron. Sust. Develop. 30, 295-309. [ Links ]
Mengel, K. & Kirby, E.A., 1987. Principles of plant nutrition. International Potash Institute, Bern. [ Links ]
Moolman, J.H., De Clercq, W.P., Wessels, W.P.J., Meiri, A. & Moolman, C.G., 1999. The use of saline water for irrigation of grapevines and the development of crop salt tolerance indices. WRC Report No 303/1/99, Water Research Commission, Pretoria. [ Links ]
Mpelasoka, B.S., Schachtman, D.P., Treeby, M.T. & Thomas, M.R., 2003. A review of potassium nutrition in grapevines with special emphasis on berry accumulation. Aust. J. Grape Wine Res. 9, 154-168. [ Links ]
Prior, L.D., Grieve, A.M. & Cullis, B.R., 1992. Sodium chloride and soil texture interactions in irrigated field grown Sultana grapevines. II. Plant mineral content, growth and physiology. Aust. J. Agric. Res. 43, 1067-1083. [ Links ]
Shani, U. & Ben-Gal, A., 2005. Long-term response of grapevines to salinity: Osmotic effects and ion toxicity. Am. J. Enol. Vitic. 56, 148-154. [ Links ]
Stevens, R.M., Harvey, G. & Partington, D.L., 2011. Irrigation of grapevines with saline water at different growth stages: Effects on leaf, wood and juice composition. Aust. J. Grape Wine Res.17, 239-248. [ Links ]
Terblanche, J.H., 1985. Integrated approach to fertilisation of apples for optimum production and quality under South African conditions. Hort. Science 3, 1-6. [ Links ]
Walker, R.R., 1994. Grapevine responses to salinity. Bulletin de L'O.I.V. 67, 634-661. [ Links ]
Walker, R.R., Blackmore, D.H., Clingeleffer, P.R. & Correll, R.L., 2002. Rootstock effects on salt tolerance of irrigated field-grown grapevines (Vitis vinifera L. cv. Sultana). 1. Yield and vigour inter-relationships. Aust. J. Grape Wine Res. 6, 3-14. [ Links ]
Walker, R.R., Read, P.E. & Blackmore, D.H., 2000. Rootstock and salinity effects on rate of berry maturation, ion accumulation and colour development in Shiraz grapes. Aust. J. Grape Wine Res. 6, 227-239. [ Links ]
Walworth, J.L., Letzsch, W.S. & Sumner, M.E., 1986. Use of boundary lines in establishing diagnostic norms. Soil Sci. Soc. Am. J. 50, 123-128. [ Links ]
Wentzel, W.G., 2003. Rainfall and the prediction of sorghum in South Africa. S. Afr. J. Plant Soil 20, 38-40. [ Links ]
Winkler, A.J., 1962. General viticulture. University of California Press, Los Angeles. [ Links ]
Wooldridge, J., Louw, P.J.E. & Conradie, W.J., 2010. Effects of liming to near-neutral pH on Vitis vinifera L. S. Afr. J. Enol. Vitic. 31, 34-37. [ Links ]
Yermiyahu, U., Ben-Gal, A., Keren, R. & Reid, R.J., 2008. Combined effect of salinity and excess boron on plant growth and yield. Plant Soil 304, 7387. [ Links ]
Zhang, X., Walker, R.R., Stevens, R.M. & Prior, L., 2002. Yield-salinity relationships of different grapevine (Vitis vinifera L.) scion-rootstock combinations. Aust. J. Grape Wine Res. 8, 150-156. [ Links ]
Zocchi, G. & Mignani, H., 1995. Calcium physiology and metabolism in fruit trees. Acta Hort. 385, 15-21. [ Links ]
Submitted for publication: January 2014
Accepted for publication: March 2014
Acknowledgements: The ARC is thanked for infrastructure and other resources, Winetech for partial funding, and the Soil and Water Science staff at ARC Infruitec-Nietvoorbij for technical support.
* Corresponding author: howellc@arc.agric.za
