


Services on Demand
Article
 English (pdf)
 Article in xml format
 Article references
Indicators

Related links
-
 Cited by Google
 -
 Similars in Google
Share

 Permalink
South African Journal of Enology and Viticulture
On-line version ISSN 2224-7904
Print version ISSN 0253-939X
S. Afr. J. Enol. Vitic. vol.35 n.2 Stellenbosch 2014
The influence of different winemaking techniques on the extraction of grape tannins and anthocyanins
A.P. NelI, II; P. van RensburgI, III; M.G. LambrechtsI, III, *
IDepartment of Viticulture and Enology, Institute for Wine Biotechnology, Stellenbosch University, Matieland, South Africa
IIElsenburg, Private Bag X1, Stellenbosch, South Africa
IIIDistell, PO Box 184, Stellenbosch 7599, South Africa
ABSTRACT
The aim of this study was to determine the effect of different maceration techniques on the extraction of grape tannins and anthocyanins. Two cultivars (Cabernet Sauvignon and Shiraz) were harvested in two different climatic regions (Durbanville and Simondium) at two different ripeness levels for the 2008 and 2009 harvest seasons. Five basic winemaking processes were applied, namely a normal alcoholic fermentation (C), enzyme treatment (E), cold soaking (CM), post-maceration (PM), and a combination of cold and post-maceration (CM+PM). At harvest the phenolic ripeness was determined with the Glories method, while the tannin concentration was determined with the methyl cellulose (MCP) method. The grapes in the warmer area had higher tannin levels than grapes harvested in the cooler area in both years. In the 2009 harvest season, the enzyme treatment extracted the highest levels of tannin. CM+PM showed the best results of tannin extraction with early ripeness (Cabernet Sauvignon), and CM with fuller ripeness in the warm area. CM showed the best results with both early and fuller ripeness levels in the cooler area. PM showed the best results with the early ripeness levels, and the E treatment with the fuller ripeness levels, in the warm area. CM+PM showed the best results with the early ripeness level in the cooler area, and varied results with the fuller ripeness levels. In both years, grapes from the cooler area contained more anthocyanin than those from the warmer area. At a fuller ripeness level (2009) the treatments had no effect.
Key words: Tannin extraction, anthocyanins, phenolic ripeness, Glories method, methyl cellulose method.
INTRODUCTION
Several methods are available to the farmer/viticulturist/ winemaker to establish the ripeness level of grapes. Methods like the traditional °Brix, pH and TA, °Brix:pH, TA:pH, °Brix:TA or °Brix x (pH)2 (Du Plessis & Van Rooyen, 1982) can be used, but they all have limited success. Erika Winter (Winter et al., 2004) compiled a book on berry sensory assessment that describes the different methods that the viticulturist can use to determine the ripeness of the grapes. Although these are not foolproof methods, they certainly give indications to the farmer/viticulturist/winemaker as to the potential quality of the grapes and, of course, also the ripeness.
The fact that red wine contains tannin and anthocyanin is well known. The importance of tannin is its contribution to organoleptic characteristics such as astringency (Gawel, 1998; Monagas et al., 2005), bitterness (Monagas et al., 2005), colour stability (Monagas et al., 2005) and maturation potential (Lorenzo et al., 2005), and also to health benefits (Corder, 2007). Anthocyanin, on the other hand, is responsible for the colour of red wines.
Webster's Encyclopedic Unabridged Dictionary (1989) states that the word macerate originates from the French word maceratus, which means to soften by steeping in a liquid, with or without heat. Thus maceration is a technique that is used to extract components and pigments out of grape pomace by leaving the skins on the juice or wine for an extended time before or after fermentation.
There are certain factors that can influence the effect of maceration: temperature, contact between solids and liquids, degree of agitation, contact time and composition of the extracting liquid (Robinson, 1999). The final concentration of anthocyanins and tannins in wine can be influenced by manipulating the abovementioned factors. Different techniques have been developed to help winemakers in achieving their goal for colour and tannin extraction. According to McMahon et al. (1999), the rationale behind cold soaking is that the aqueous extraction in a non-alcoholic matrix improves wine colour and colour stability and increase aromatic intensity. However, the research on the effect of maceration is limited.
Temperature or heat is a means of degrading grape tissue. It increases the breakup of grape tissue components and accelerates maceration (Ribereau-Gayon et al., 2000a). Alcoholic fermentation causes an increase in the temperature of the grape must, and therefore the extraction of grape tissue components is increased during this period. Furthermore, the increase in ethanol that occurs during alcoholic fermentation also increases extraction (Robinson, 1999).
Contact between skins, seeds and the juice has an impact on colour and tannin concentration. A study conducted by Ferre in 1958 showed that at least 80% of the grape colour is extracted by the sixth day of maceration (Robinson, 1999). Because the grape skins are broken during destemming, the cells in the skin are damaged and therefore a leaching of anthocyanins into the juice takes place. This leaching of anthocyanins turns the juice red (McMahon et al., 1999). The phenolic compounds are bound to the vacuole membranes and need another process to release them. The process of alcoholic fermentation helps with the release of these phenolic compounds into the wine (Joscelyne & Ford, 2008).
The degree of agitation has formed part of a great deal of research. Two types of agitation can be identified. The first method is the so-called punch down of the cap (Fr. Pigeage). The grapes were first stomped with the feet, but as the vats/ tanks got bigger and deeper and the danger of toxic carbon dioxide gas increased, other methods were used. The caps are broken up by wooden punches, but as this is a very labour-intensive job, pneumatic punches were invented. Spin-offs of these methods are the rotofermenters and the autovinificators (Robinson, 1999). The second method is the pump over of the wine/juice over the cap (Fr. Remontage). Here, the juice/wine is drawn from the bottom of the tank and then pumped over the cap. The force can be used to break up the cap, or the juice/wine can be sprayed onto the cap so that the juice/wine seeps through the cap. If the pump-over is done at the end of fermentation, more seed tannins are extracted, and the seed tannins are needed along with the skin tannins to give a balanced wine (Ribereau-Gayon et al., 2000).
Maceration of grapes can be divided in cold soaking and post-maceration. After the crushing of the grapes, the vacuoles of the skin cells are broken and the anthocyanins can seep out. The absence of alcohol at that time allows the formation of higher molecular weight pigmented phenolic species, which will enhance colour stability (McMahon et al., 1999). This can be done at different temperatures and for different lengths of time, as has been shown by a number of studies (McMahon et al., 1999; Gomez-Plaza et al., 2000, 2001; Joscelyne & Ford, 2008). Gomez-Plaza et al. (2000) used Monastrell cooled down to 10°C for five days in 2001 and tested three different maceration times (four, five and 10 days). In two studies, Gomez-Plaza et al. (2000 and 2001) found that low maceration temperature (10°) and longer maceration time (10 days) had a positive influence on the anthocyanin concentration, chromatic characteristics and hydroxyl cinnamic acid derivatives of the wines. After storage for twelve months, the wines made with the longer maceration time (10 days) kept their colour density and phenolic contents longer than the wines made with shorter maceration times (four days) (Gomez-Plaza et al., 2000). Longer skin contact may lead to greater polymerisation of pigments and higher concentrations of procyanidins, and therefore to greater colour stability in the early stages of red wine maturation (Gomez-Plaza et al., 2001).
Post-maceration. where the skins are left in the wine after fermentation, is completed for up to two/three weeks (Zimmer et al., 2002; Joscelyne & Ford, 2008). This maceration will extract more seed tannins and care should be taken not to use this method if the cultivar is prone to too high concentrations of tannins. The rationale behind maceration is that more colour will be extracted from the grape skins with cold soaking, and more phenols will be extracted with extended maceration, which will help to stabilise wine colour and tannin structure (Joscelyne & Ford, 2008). A study was done on the consequences of extended maceration on red wine colour and phenolic compounds by the University of Adelaide (Joscelyne & Ford, 2008). It was found that extended maceration resulted in lower colour intensity, but higher hue (browner colour) and total phenols, than the other treatments (Joscelyne & Ford, 2008).
The aim of this study was to compare the impact of different maceration techniques on the extraction of tannins and anthocyanins. The difference between early (before commercial harvest) and later (after commercial harvest) ripeness levels were compared to the extraction of tannin and anthocyanin concentrations. The effect of phenolic ripeness was also compared at the different harvesting times.
MATERIALS AND METHODS
Origin of grapes
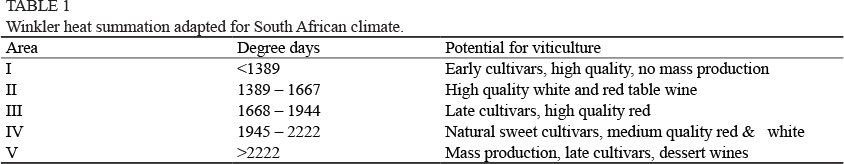
In 2008 and 2009, two cultivars of Vitis vinifera L., Cabernet Sauvignon and Shiraz, from two different climatic areas were used in this trial. The first area was located in the Stellenbosch district of Simondium, on the farm Plaisir de Merle, and is classified as IV according to the Winkler scale (Winkler, 1965), i.e. a warm area. The second area was located in the Durbanville district, on the farm Morgenster, and is classified as III according to the Winkler scale (Winkler, 1965), therefore it is regarded as slightly cooler than the first area. The Winkler heat summation works as follows: The sum of the average daily temperatures above 10°C for the growth months (September to March) is calculated and then expressed as degree days. These degree days are then compared to a table (see Table 1). This table can be used to calculate which cultivar would suit the specific area.
On Plaisir de Merle, the vineyards are Cabernet Sauvignon grafted onto Richter 99, while the Shiraz is grafted onto Mgt 101-14. The row direction for the Shiraz is South-East to North-West, while the Cabernet Sauvignon is South to North. The vineyards are thus planted to be exposed to the morning sun. The vineyards of Morgenster are Cabernet Sauvignon and Shiraz grafted onto Richter 99. The row direction for the Cabernet Sauvignon is East-West, while the Shiraz is in a South-West - North-East direction, and therefore the sun moves over the rows.
Harvesting and winemaking
During the 2008 and 2009 seasons, grapes were harvested at two different ripeness levels. The low ripeness level was harvested before commercial harvest (< 24°B) and the late ripeness level after commercial harvest (> 24°B). Traditionally in South Africa, red grape are seen as ripe (not to be confused by phenolic ripeness) when they obtain a sugar level of at least 24°B.
An average of 200 kg grapes were harvested for each cultivar at both locations and for both ripeness levels. The grapes were destemmed and crushed in a bin. The SO2 concentrations were adjusted to 25 parts per million (ppm). The grape must and skins were separated, weighed and then divided into twelve homogeneous samples containing equal amounts of skins and juice.
The grape musts were subjected to four winemaking processes, namely a control, cold soaking, post-maceration, and a combination of cold soaking and post-maceration to allow for the extraction of tannin. The control treatment (C) was inoculated with 25 g/hL WE372 (Anchor, South Africa) directly after destemming and was pressed just after alcoholic fermentation was completed. All the other treatments were also inoculated with 25 g/hL WE372. During the cold soaking (CM) treatments, the must was left on the skins at 15°C for three days before the must was inoculated. After alcoholic fermentation, the wine was pressed. During the post-maceration (PM) treatment, the must was inoculated after destemming, but the skins were left on the wine at room temperature after alcoholic fermentation and before pressing. With the combination of cold and post-maceration (CM+PM) treatments, the must was left on the skins for three days at 15°C before inoculation, and, after alcoholic fermentation, the skins were left on the wine for two weeks at room temperature before pressing. The grapes for all treatments were pressed through three times a day during fermentation. After alcoholic fermentation, the total SO2 of every wine was adjusted to 50 ppm. The total SO2 was again adjusted to 50 ppm before bottling. Each treatment was done in triplicate.
The experiment was repeated in 2009, but another treatment was added, namely an enzyme (E) treatment. The enzyme treatment was handled in precisely the same way as the control, but a pectolytic enzyme was added (0.04 mL/L) before the start of fermentation (Pectinex Ultra SPL from Novozym SA [South Africa]).
Sampling of grapes and chemical analyses
Five hundred berries were randomly selected from the twelve crates, of which 100 berries were weighed and homogenised.
The homogenisation was done in a Retch GM200 GRINDOMIX for 30 seconds at 5 000 rpm. The remaining grapes were sent to a contracted laboratory to be analysed for phenolic ripeness. Two grams of the homogenate were used for colour analysis and one gram for tannin analysis.
Samples of the wine were taken at different stages in the winemaking process (after cold soaking, after alcoholic fermentation, after post-maceration, after bottling, and three months after bottling) for tannin and anthocyanin concentration analyses.
Tannin analysis
The samples were prepared for tannin analysis by mixing 1 g homogenised grape must with a 10% aqua solution (50% deionised water and 50% of 96.5% ethanol). This mixture was shaken for an hour on a rotator. The samples were then centrifuged in a Beckman Model J2-21 centrifuge for 10 min at 4 500 rpm. The supernatant was used for tannin analysis, using the BSA assay as described by Hagerman and Butler (1978) and later modified by Harbertson et al. (2003), and the MCPT assay as described by Sarneckis et al. (2006). The analyses took place after alcoholic fermentation (AF), after bottling (BOT) and after three months' maturation (3MD). Each sample was done in triplicate.
The percentage of tannin extracted from the grapes into the wine was calculated as follows:

Anthocyanin analysis of grapes and wine
An anthocyanin analysis of the grapes was done according to the method of Iland et al. (1993). For the total anthocyanin analysis of the wine, 100 μL of wine was mixed with 10 mL of 1 M HCl, shaken and left to stand for three hours before the sample was read on a spectrophotometer at 520 nm. The analyses took place after alcoholic fermentation (AF), after bottling (BOT) and after three months' maturation (3MD). Each sample was done in triplicate.
Analysis of colour density and hue
Colour density and hue were measured with a spectrophotometer. Colour density of the wine was measured in a 2 mm quartz cuvette at 420 nm and 520 nm. The results from these two absorbance spectrums were added together to obtain the colour density. For colour hue the 420 nm values were divided by the 520 nm values. The analyses took place after alcoholic fermentation (AF), after bottling (BOT) and after three months' maturation (3MD). Each sample was done in triplicate.
Analysis of phenolic ripeness
The analysis of phenolic ripeness using the Glories method (Glories, 1984b) was outsourced to contracted laboratories.
Statistical analysis
Data was analysed using STATISTICA version 9 (Tulsa, USA). A mixed model repeated measures ANOVA and post-hoc tests were conducted using Fisher's LSD (least significant difference) model. The error bars were set as 95% confidence intervals and, on the supposition that the variances were the same, the error bars will have the same width.
RESULTS AND DISCUSSION
The phenolic ripeness of grapes was a topic that was of great interest to Glories (Glories, 1984a). In 1984 he developed a method to determine the phenolic ripeness of grapes by looking at the extractability of anthocyanin in the wine. His method was based on the principle of extracting anthocyanin at pH 1.0 (total anthocyanin) and at wine pH (extractable anthocyanin). By subtracting the extractable anthocyanin from the total anthocyanin and then dividing by the total anthocyanin, he got a percentage of extractability (EA%). The closer the extractable anthocyanin was from the total anthocyanin, the better the extractability would be and also the more phenolically riper the grapes (Glories, 1984b). An EA% of 45 and less means that the grapes are phenolically ripe and can be harvested, and more than 45% means the grapes are still green and the grapes can hang on the vines a little longer (Glories, 1984b)
Phenolic ripeness according to the method of Glories
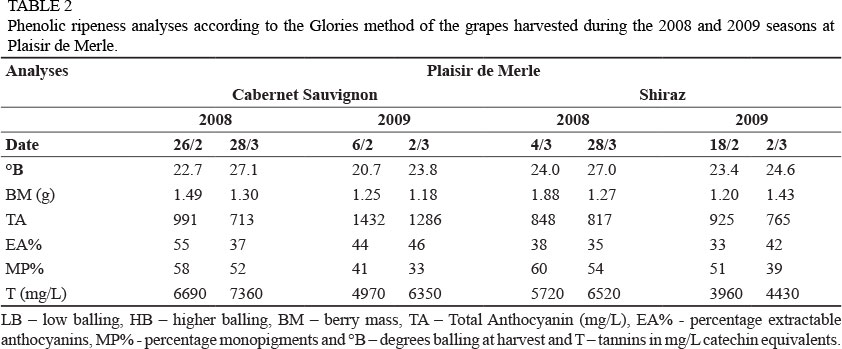
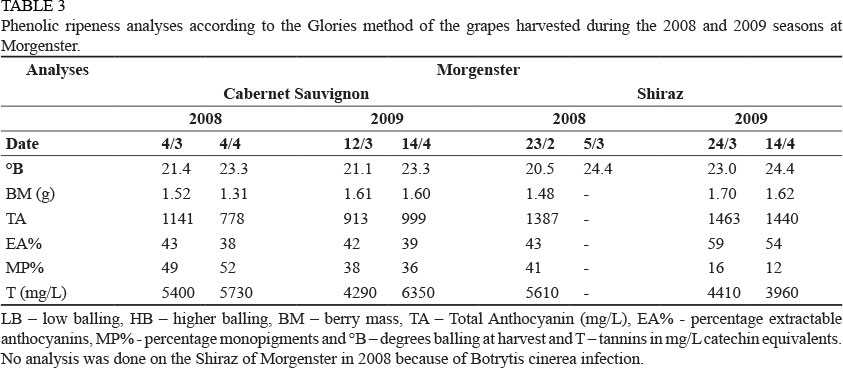
The effect of grape ripeness level on tannin extractability is illustrated by the results in Tables 2 and 3. Cabernet Sauvignon from Plaisir de Merle had an EA% of 55 when the grapes were harvested at 22.7°B, but when the grapes reached 27.1°B the EA% dropped to 37. The Shiraz from Plaisir de Merle reached phenolic ripeness at 24°B, and the extractability of the grapes did not improve at the higher sugar level. The reason for the increase in EA% was due to a decrease in total anthocyanin while the extractable anthocyanin basically stayed the same. The Cabernet Sauvignon grapes from Morgenster also reached phenolic ripeness at 23.5°B, when the EA% was 38. The Shiraz from Morgenster in 2009 shows a low extractability (59 to 54%). The reason for these higher values was that the grapes were not yet fully ripe when they were harvested, as Morgenster is situated in a cool area and ripening is prolonged.
The percentage monomeric pigments (MP%) is the contribution of the seed tannins to the wine and, therefore, the higher the MP% value the more astringent the wine will be. As the berry ripens the MP% decreases. This was especially prominent in the cultivars on Plaisir de Merle of both harvest seasons, and the same tendency could be seen for Morgenster. The Shiraz on Morgenster was heavily infected with Botrytis cinerea, and this could explain the low MP% values for the 2009 harvest season. On both of these farms the MP% decreased as the berries ripened, but the MP% of the Shiraz on Morgenster was very low in 2009.
Phenolic maturity is reached when the concentration of grape anthocyanins is at its maximum (Ortega-Regules et al., 2006). In most cases, except for the Cabernet Sauvignon on Morgenster from the 2009 harvest, the total anthocyanin probably reached its peaks at the early ripeness levels, as total anthocyanin decreases with time. According to the postulation of Ortega-Regules et al. (2006), these grapes had reached their phenolic maturity. This also correlates with Glories's extractability, which was below the 40% cut-off point for phenolic ripeness in the 2008 harvest season, but not in the 2009 harvest season.
The effect of tannin extraction by different winemaking processes
Grapes
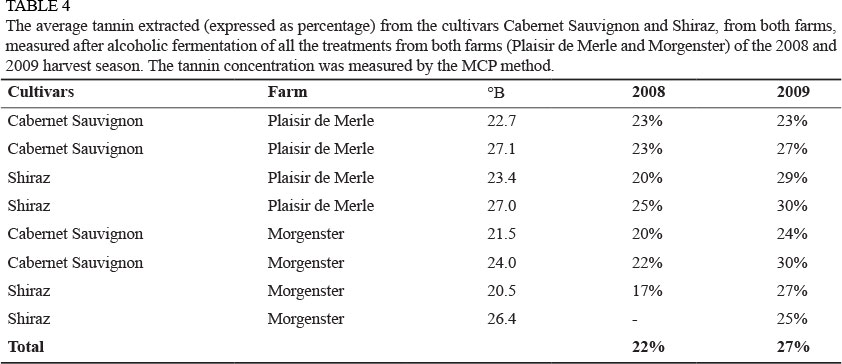
The grapes of the cultivars Cabernet Sauvignon and Shiraz from both farms were analysed for tannin concentration according to the MCP (Sarneckis et al., 2006) method. Grapes were harvested at a low ripeness level (before commercial harvest) and at a late ripeness level (after commercial harvest). The tannin concentration of the grapes was compared to the tannin concentration after alcoholic fermentation (AF). In most cases the percentage of tannin extracted was higher for the fuller ripeness levels than for the early ripeness levels (Table 4). This was expected, as the tannins are more extractable in riper grapes than in greener grapes.
As can be seen in Table 4, the average tannin concentration extracted from the grapes into the wine was 22% in 2008 and 27% in 2009. This is in agreement with Adams and Scholz (2007), who found that the norm for extraction is between 10% and 58%.
Extraction treatments in winemaking
The tannin concentration of the two cultivars from the farm located in the warmer area was similar in both seasons. In general, the grapes of the warmer farm had more tannin concentration than the grapes of the cooler farm for both the Cabernet Sauvignon and Shiraz cultivars. The average difference in tannin concentration of the wines from the two farms was between 15 and 20%. This could be because tannin formation is influenced by an optimal day temperature of 17°C to 26°C (Jackson & Lombard, 1993). The gene for the expression of tannin is expressed at an optimal temperature of 25°C and is inhibited at temperatures lower than 18°C (Mori et al, 2005; Chorti et al, 2010).
The tannin concentration of the control wine, which was made from the low Balling grapes from the 2008 harvest on the warmer farm (Fig. 1 (a)), was significantly lower than any of the other treatments, showing that any one of the different treatments could be used to extract more tannin at an early level of ripeness. There was a slight difference between the cold soaking and post-maceration, but the difference was not significant. The combination treatment (cold and post-maceration) shows a somewhat larger difference, although this also was not significant. Although not significantly higher than the other treatments, the combination treatment produced a wine containing the highest tannin concentration (Fig. 1).
Fig. 1 shows that there were no differences in tannin concentration between the wines made with different treatments in the warmer area at the late ripeness level. This probably indicates that, at a low ripeness level, the tannin structure is not fully developed and that different treatments can extract more tannin from the grape skins and seeds.
On the cooler farm in the 2008 harvest season (Fig. 1a), the treatments showed a negative effect against the control at the early ripeness level. However, at the late ripeness level, the PM and CM+PM treatments showed a negative effect, i.e. a lower tannin concentration than for the control. In contrast, the CM treatment showed similar tannin concentrations than the control. The treatment of CM, at the late ripeness level, showed a slightly higher tannin concentration than the C (not significant) wine, and significantly higher than the treatment of PM. This trend did not appear in the 2009 harvest season.
In contrast, from the 2009 data of the warmer farm (Fig. 1b), the low ripeness level shows that there were no significant differences between the treatments. The only treatment that showed a significant increase in tannin concentration was the E treatment. This trend was the same for both the ripeness levels in the warmer area.
At the late ripeness level, the same trend could be seen as in the 2008 harvest season. The results suggest that the tannin structure of the grapes is more mature at a late ripeness level. The only treatment that had any significant effect on tannin extraction on both the low and high ripeness levels was the enzyme treatment. This can be expected, as the enzymes tend to break the bonds between the tannin and the cell wall compounds, thus releasing more tannin into the wine.
In the 2009 harvest ,season the trend between the low and high ripeness levels essentially was the same, except that the absolute concentrations differed (Fig. 1b). There was no difference between the C wine and the PM and CM+PM treatments, meaning that longer skin contact did not improve tannin extraction (Fig. 1b). The only difference at the low ripeness level was the E treatment, but this treatment did not have any effect at the late ripeness levels (Fig. 1b). On the warmer farm CM, PM and CM+PM treatments had an effect on tannin extraction at low ripeness levels, but not at late ripeness levels (Fig. 1b). Pectolytic enzyme preparations are suggested for increased tannin extraction (Guerin et al., 2009).
The Shiraz on the warmer farm showed a decline in tannin concentration in the PM treatment in the 2008 harvest season (Fig. 1a). The same slight decline in tannin concentration could be seen with the combined CM+PM treatment. However, this trend was very different from what was seen for Cabernet Sauvignon. This could mean that there were a lot of monomers in the wine, or that polymerisation took place and many of the tannins precipitated after PM (data not shown).
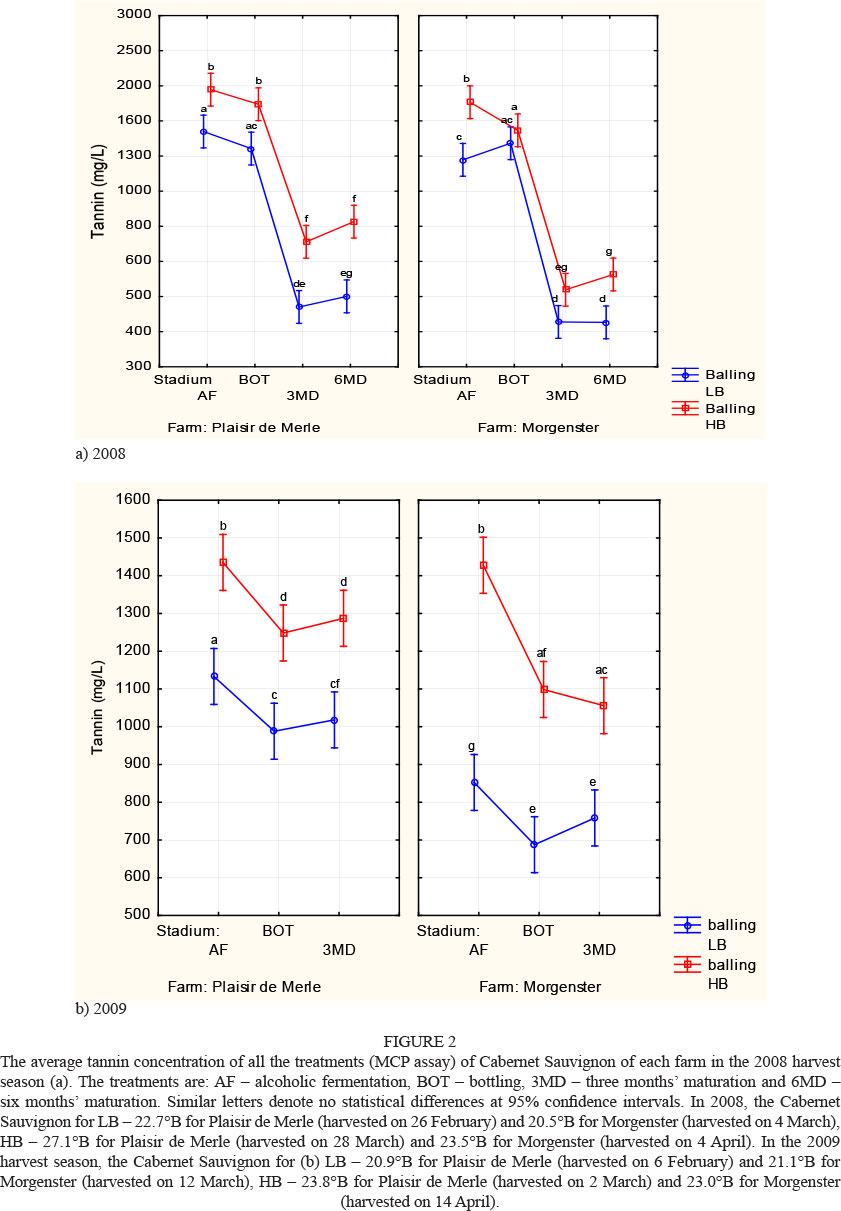
The effect of the different winemaking techniques on the tannin concentration of the wines was followed until three months after bottling. In 2008, there was a sharp drop in tannin concentration from BOT to 3MD for both farms. A more gradual decrease was observed in the 2009 harvest season (Fig. 2). The same trends (for both harvest seasons) were observed for the Shiraz wines (data not shown).
The most tannin is extracted after alcoholic fermentation and with prolonged skin contact after AF (Cheynier et al., 2006). The majority of the tannins extracted at that time would be monomeric pigments consisting of catechin, epicatechin, epigallocatechin and epicatechin-gallate (Schofield et al., 2001; Sarneckis et al., 2006). These four basic flavonoids are used in the formation of the different polymeric pigments. During the extraction time, these monomers form dimers and trimers. As the wine matures, these dimers and trimers form longer chains of tannins and, as the chains become longer, they start to precipitate (Scollary, 2010). Tannins associate with anthocyanins to form polymeric pigments, which in turn change from the blue/purple colour of young wines to the red/brown colour of matured wines (Scollary, 2010). The polymeric pigments are less sensitive to SO2 bleaching and shifts in pH balance (Scollary, 2010). This could explain the decline in tannin concentration from BOT to 3MD. After 3MD, the polymerisation of the tannins starts to stabilise, explaining why there was no significant difference between 3MD and 6MD.
The Cabernet Sauvignon had an overall higher concentration of tannin than Shiraz. This also confirmed previous results that the grapes from warmer areas have a higher tannin concentration than grapes from cooler areas. This trend was the same for 2008 (data not shown) and 2009.
The effect of different winemaking techniques on total anthocyanins
Grapes
Anthocyanins accumulate in the vacuoles of the epidermic cells of a grape berry (Gonzales-Neves et al., 2008). These anthocyanins start to accumulate at véraison and can reach a peak from 40 to 50 days after véraison (Revilla & Gonzalez-San José, 2003). Agro-ecological factors like cultivar, climate, canopy management and irrigation can be the reason for the different times when anthocyanin peaks (Gonzales-Neves et al., 2008).
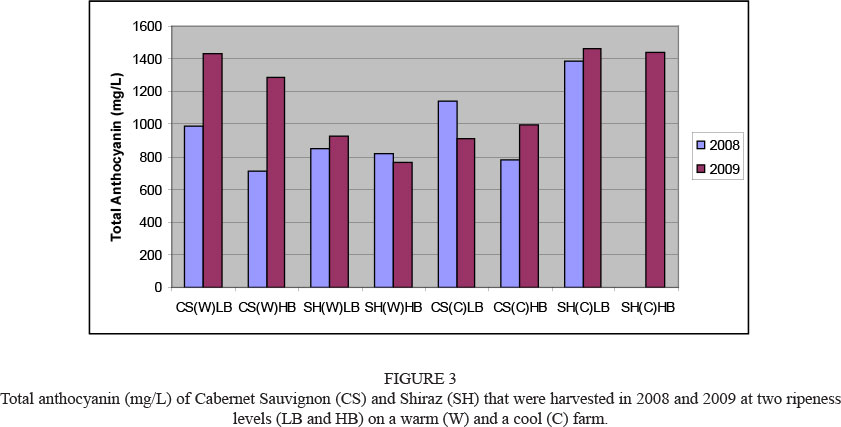
Figure 3 shows that the highest anthocyanin levels was at the early ripeness level, and that the anthocyanin concentration decreased at the late ripeness level. This could mean that the anthocyanins had already reached their maximum and started to decline, depicting phenolic ripeness (Ortega-Regules et al. 2006). The anthocyanin concentration of the Cabernet Sauvignon grapes from the cool farm actually increased in 2009. The cooler farm is subjected to a cool sea breeze from the Atlantic Ocean that makes the growing and ripening of the grape berries take longer than on the warmer farm. Therefore the grapes were still busy with anthocyanin accumulation and were not ready for harvest.
Anthocyanin accumulation is inhibited at warm temperatures above 26°C, but is expressed at low temperatures of 17°C to 26°C, especially at cool night temperatures of 15°C to 20°C (Jackson & Lombard, 1993; Mori et al., 2005; Chorti et al., 2010). The grapes from the cooler farm have a much higher anthocyanin concentration than on the warmer farm.
Extraction treatments in winemaking
Anthocyanin, in contrast to tannin, is water soluble and is extracted during cold soaking. Anthocyanin does not form bonds with cell wall structures and accumulates in the vacuoles of the epidermic cells (Gonzales-Neves et al., 2008). Hence the red colour of grape skins.
In the 2008 harvest season (Fig. 4 (a)), one can see that the PM treatment showed a negative effect on the warmer farm, resulting in a low concentration of total anthocyanin. The CM treatment did not show an effect on total anthocyanin for the low ripeness level. This effect was evident on the cooler farm either at the low or late ripeness levels. This indicates that cold maceration had no effect on total anthocyanin. On both farms and at both ripeness levels, the PM treatment had the lowest amount of anthocyanin concentration.
The 2009 wines from the warmer farm treated with the CM treatment also had no visible effect on total anthocyanin extraction at a low ripeness level and at a high ripeness level (Fig. 4 (b)). The riper the grapes become, the quicker anthocyanin will be released, resulting in an equal amount of anthocyanins, no matter the treatment (Glories, 1984). The E treatment showed no effect at a low ripeness level, but there was a remarkable increase in anthocyanin extraction at a high ripeness level.
In the 2008 harvest season, the cooler farm showed that, at a low ripeness level, none of the treatments had any effect, except for the PM treatment, which showed a negative effect. Most of the anthocyanins were extracted by normal winemaking processes. There was a remarkable decline in anthocyanin concentration by the combined CM+PM treatment, probably due to reaction with tannin or other polymerisation effects. At the late ripeness level on the cooler farm, no treatment showed any effect. This is also probably due to a better release of anthocyanins as the grapes grew riper.
In 2008, there was a decline in anthocyanin (Fig. 5) concentration on the warmer farm as the wine matured. This can be expected, as anthocyanins form polymeric pigments with tannins and also shift the colour spectrum from red to yellow/brown as measured by a spectrophotometer. On the warmer farm the anthocyanin concentration was the same for both the low and high ripeness levels. For the cooler farm, a decline in anthocyanin concentration was also observed, but there was a difference in concentration between the ripeness levels.
In the 2009 harvest season the same trend can be seen (data not shown) on both farms. On both farms the anthocyanin concentration was lower for low ripeness levels and higher for late ripeness levels. The steepest decline was from AF to BOT, as this was when the wine was filtered and bottled and the ingress of oxygen shows a decline in anthocyanin concentration as acetaldehyde is formed (Scollary, 2010). This is also the time when polymerization takes place. From BOT to 3MD the decline is more gradual as the anthocyanins start to become more stable.
The Shiraz was an interesting case in 2008. For the most part it followed a similar trend to Cabernet Sauvignon. There was no difference in the extraction of anthocyanins of the CM and CM+PM treatments at a late ripeness level in the warmer area. This was not the case for the cooler area, where the CM and CM+PM treatments showed an increase in anthocyanin extraction. Again, the PM treatment showed the lowest anthocyanin concentration, on both farms. On the warmer farm the concentration difference for the ripeness levels was quite small, with the low ripeness level showing the lowest concentration. The difference in anthocyanin concentration for the cooler farm was very large. This shows that the concentration for the ripe level is much lower than for the low ripeness level. This could be explained partially by the respective healthiness of the grapes. The Shiraz grapes on the warmer farm were healthy and looked after. On the other hand, the Shiraz grapes on the cooler farm were over-cropped and Botrytis was evident at an early ripeness level and became worse as the grapes ripened. When the grapes were picked at the high ripeness levels, the grapes were rotten to a point where it was impossible to produce good wine. This could be the reason for the low anthocyanin concentration on the cooler farm at the high ripeness level. In 2009, the same trend of the effect of the different treatments on total anthocyanins could be seen (data not shown) as for the 2008 harvest season. The same trend in the anthocyanin concentration could be seen (data not shown) for Cabernet Sauvignon.
The effect of different winemaking techniques on colour density
Extraction treatments in winemaking
Colour density is measured as the sum of the absorbance at 420 nm and 520 nm (in some cases 620 nm is also used). Iland et al. (1993) classified colour density as follows:
0 - 6 = low in colour
6 - 12 = medium colour
> 12 = high in colour
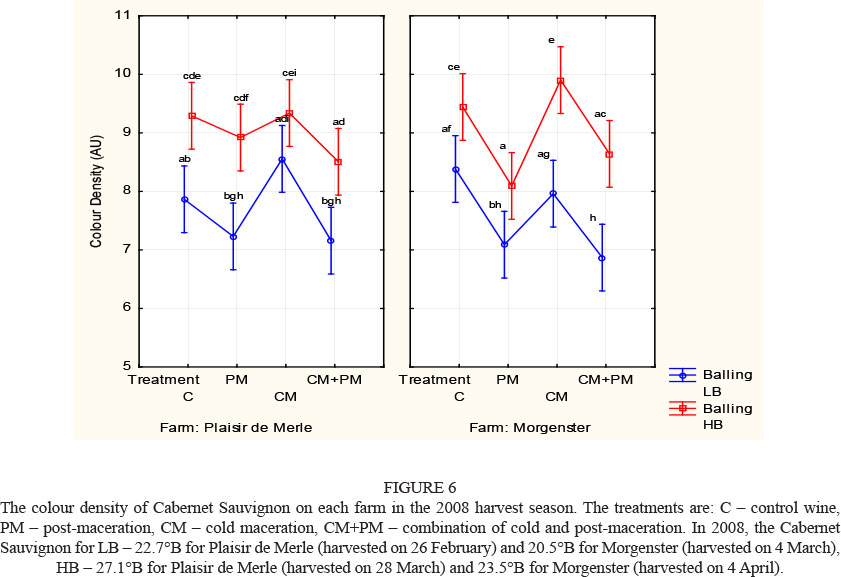
In Fig. 6, the PM treatment as well as the combined CM+PM treatment showed a negative effect on colour density, while the CM treatment showed a slight increase in colour density. This is evident for both the farms. The effect was more significant for the cooler farm. The same trend could be seen with the Shiraz grapes on the two farms (data not shown).
During the 2009 harvest season, none of the treatments showed any effect on colour density from the late ripeness level (data not shown). The tendency for CM treatment to be higher than the PM and CM+PM treatments can be seen for both the total anthocyanins and the colour density. It can also been seen that, although there were differences between the treatments, the colour density fell in the medium colour classification. Therefore, no differences will be seen if one viewed the colour through a wine glass.
During the 2009 harvest, the colour density showed different trends to those observed during the 2008 harvest season. For both cultivars (Cabernet Sauvignon and Shiraz) on the warmer farm, the treatments showed no effect on colour density, with only the E treatment showing a significant increase in colour density. On the cooler farm the treatments of CM and E showed the same increase in colour density for both cultivars. The CM treatment again showed the same tendency to be slightly higher than the PM treatment for both the total anthocyanins and colour density. The E treatment also showed the highest extraction, while in the cooler area the CM+PM treatment had a negative effect on both the total anthocyanins and colour density. On the cooler farm, all the treatments fell in the medium colour classification, with the combination treatment that was on the border, with a value of 6 at the early ripeness level. On the warmer farm, most of the treatments fell in the medium colour classification, except the PM treatment, which was on the border of 6 for the HB, and the CM and CM+PM treatment of the LB with 6 and 5 respectively.
On both farms, for both cultivars and for both the 2008 and 2009 harvest seasons, the colour density was high just after AF. There was a sharp decrease in colour density to BOT, after which it decreased even further. These decreases can be due to the formation of polymeric pigments at the bottling stage (Somers, 1971). The concentration of anthocyanins kept on decreasing, probably indicating polymerisation with tannins (Somers, 1971). This tendency of a loss in colour density as the wine matures can also been seen with total anthocyanins. The same results were obtained for Shiraz (data not shown).
According to Ribéreau-Gayon et al. (2000), colour density has a tendency to increase when the anthocyanins come into contact with air or oxygen. This may explain the increase in colour density for the late ripeness level at three months' maturation on the warmer farm (Ribéreau-Gayon et al., 2000). The colour density of the treatments falls into the medium colour category and therefore, in this study, there was no treatment that could increase the colour of the wine significantly. In most cases the PM and CM+PM treatments showed a more stable colour density with maturation. The E treatment also showed a stabilisation effect on colour density.
The effect of different winemaking techniques on colour intensity/hue
Extraction treatments in winemaking
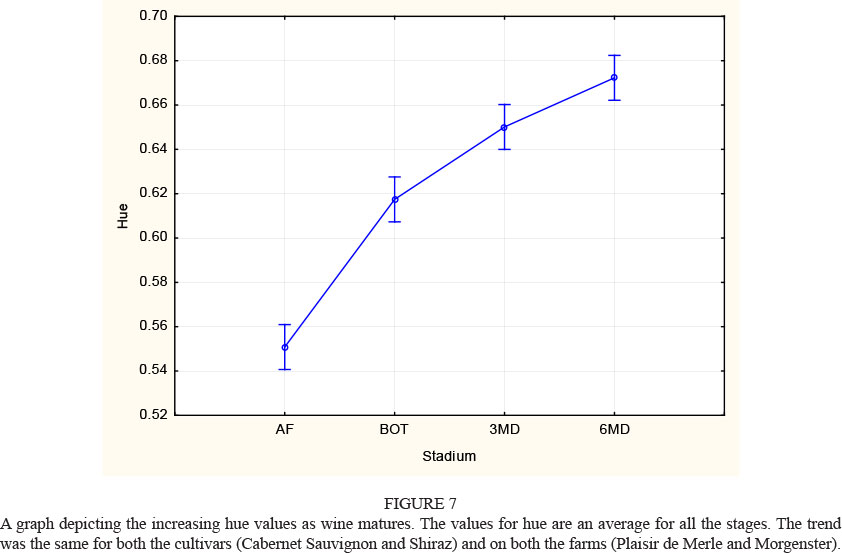
Anthocyanins absorb at 420 nm and 520 nm in the visible spectrum. These wavelengths correlate to the yellow/brown and red spectrum respectively (Margalit, 1997). Colour intensity (or hue) is the ratio between 420 nm and 520 nm. Young red wine have values in the order of 0.5 to 0.7, which increase throughout the maturation period to reach values of 1.2 to 1.3 (Ribéreau-Gayon et al., 2000). Hue therefore can be used to assess whether a wine went through a maturation period (Fig. 7), or if the wine is oxidised.
The average hue for the 2008 harvest season (data not shown) was 0.55 for Cabernet Sauvignon (warmer and cooler farm) and Shiraz (warmer farm). This was also the case for both ripeness levels. This means that the ripeness level had no effect on the evolution of the hue of the wine. What did have an effect on hue was botrytis infection of the Shiraz on the cooler farm. The hue started at 0.65 for the low ripeness level and jumped to 0.80 for the late ripeness level. This means that laccase had an oxidising effect on the colour of the wine, increasing the yellow/brown spectrum and decreasing the red. Laccase transforms the phenolic compounds (caffeic and p-coumaric acids, which are esterified with tartaric acid) to quinones. When these quinones polymerise, they form brown pigments (Ribéreau-Gayon et al., 2000).
The evolution of hue followed the same trends in both the 2008 and 2009 harvest season. The E treatment showed the lowest values for hue, and that the hue would be more stable, for instance, that wine that was made with the PM or CM+PM treatments. The PM (LB) and CM+PM (HB) showed the highest hue values. In the use of these treatments the changes for oxygen uptake were much higher, resulting in higher hue values.
After AF and at bottling (BOT), the hue increased significantly. The hue for the 2008 harvest was slightly higher (0.6 to 0.65) than the hue for the 2009 harvest (0.48 to 0.56). This increase in hue is expected, as there was a notable increase in oxygen uptake during the bottling stage. The increase in hue after bottling was more subtle, ending in a hue for Cabernet Sauvignon and Shiraz of 0.63 to 0.7 (2008) and 0.5 to 0.6 (2009) on the warmer farm, while it was 0.7 to 0.85 (2008) and 0.48 to 0.55 (2009) on the cooler farm. In 2008, the early ripeness level had on average lower values for hue than the late ripeness levels. In 2009 the opposite was true, and the late ripeness levels had lower hue values than the early ripeness levels.
Hue increases with maturation. The PM treatment and the combined CM+PM treatment showed increases in hue values on both farms and for both cultivars (data not shown). This can be expected, as post-maceration involved further skin contact after fermentation was complete. During fermentation, CO2 is given off as a by-product. This CO2 blanket on top of the fermenting skins protects the wine against oxidation. After fermentation, and especially in small-scale winemaking, this protective CO2 blanket quickly disappears and can be replaced by O2, which in time will start to oxidise the wine, resulting in a higher yellow/brown to red ratio, increasing the hue.
In the 2008 harvest season, the late ripeness level again showed a lower hue value on average than for the early ripeness level. In the 2009 harvest season it was the opposite.
The E treatment that was used in the 2009 harvest season showed a decrease in hue values. This could only mean that the pectolytic enzymes had a more stabilising effect on colour and hue, depicted in low hue values (data not shown). The E treatment had a more significant impact on hue values at a late ripeness level on the warmer farm than on the cooler farm. There was no significant difference between the CM and E treatment on the cooler farm. This means that, because of a higher colour density in red wine from the cooler farm, enough of the red spectrum was extracted during the CM treatment as well as in the E treatment. The data show that it is not really necessarily to use an E treatment to influence the hue on cooler farms, but that it would be beneficial on warmer farms.
The effect of different winemaking techniques on MP, SPP and LPP
In 2003, Harbertson et al. combined bisulphite bleaching with the protein precipitation (BSA) assay. They did this to distinguish monomeric anthocyanins (MP) from polymeric pigments (PP). They found that there were two classes of polymeric pigments: small polymeric pigments (SPP) that do not precipitate with protein, and large polymeric pigments (LPP) that do.
Fig. 8 shows a sharp decrease in MP from AF to BOT. This means that there were more monomeric anthocyanins during fermentation and that polymerisation took place after AF, producing polymeric pigments. The decrease from BOT to 3MD was less sharp, as the anthocyanins had started to stabilise. After the 3MD, the treatment with the highest MP was the E treatment and the lowest was the combined CM+PM treatment. This again shows the effect of enzymes in releasing anthocyanins from the cells (Gonzales-Neves et al., 2008). During the combined CM+PM treatment, polymerisation started at an early stage, resulting in less MP. This can be seen for both cultivars and on both the farms (data not shown).
As the MP decreases with BOT to maturation (Fig. 8), SPP and LPP increase from AF to BOT to 3MD maturation. This was expected; as MP polymerises (decreases), more PP (increase) will form. Therefore anthocyanins decrease gradually while SPP and LPP are formed and the anthocyanins are transformed into stable polymeric pigments (Villamor et al., 2009). Harbertson et al. (2003) found that most of the SPP are formed after AF (Fig. 9).
According to Villamor et al. (2009), LPP are formed more favourably in bottled wines than SPP. This could explain the sharper increase in LPP from BOT to 3MD (Fig. 10) than the more even increase of SPP from BOT to 3MD (Fig. 9). Mansfield and Zoecklein (2003) speculate that an increase in LPP indicates changes in phenolic structure similar to that found in aged wines. This may be proven by further studies with HPLC.
The colour of red wine consists of anthocyanins and their acylated forms. These anthocyanins are very unstable and form copigments with other anthocyanins or procyanidins just after fermentation (Boulton, 2001). These monomeric anthocyanidins are very sensitive to sulphite bleaching (Harbertson et al., 2003). So the expectation is that, at AF, the MP concentration will be high and that the concentration will decrease as the wine matures (Fig. 8), and that these MP will form PP. According to Harbertson et al. (2003), there is a high concentration of MP in the grapes and the concentration of MP decreases after AF. In all the samples analysed by Harbertson et al. (2003), the concentration of MP was always higher in the grapes than in the corresponding wines. In our studies we found that there were no big differences in the MP concentrations of the grapes and the corresponding wines (data not shown).
The SPP are dimers, trimers and oligomers, which are small molecular-weight compounds that do not precipitate with a protein. Polymeric pigments can be formed by self-association bonding (Boulton, 2001), tannin-anthocyanin bonding (Remy et al, 2000), and acetaldehyde cross-linking (Saucier et al, 1997). These SPP are resistant to SO2 bleaching, and may also contain compounds like vitisins (Harbertson et al, 2003; Versari et al., 2007). Harbertson et al. (2003) found that the concentration of SPP in the fruit was slightly higher than in the corresponding wine. In our case, the SPP concentration in the grapes was much lower than in the corresponding wines. These concentrations kept increasing up to the 3MD maturation. An explanation could be that more and more dimers etc. were formed during the maturation process. The same was observed for both cultivars on the two farms. A better understanding of this phenomenon can be obtained by HPLC analysis.
The LPP concentration of the fruit was much lower than in the corresponding wines. This finding is the same as that of Harbertson et al. (2003). These LPP increase as the wine matures. Harbertson et al. (2003) confirmed that LPP are formed during fermentation and that LPP concentration will increase with maturation (Harbertson et al., 2009). This is expected, as PP are formed by the polymerisation of monomers.
CONCLUSIONS
In this study a lot of questions were raised about tannin extraction and the extractability index. But the results indicate that there is a lot of potential in the use of the Glories method as a parameter to determine harvest time. However, more studies are needed to investigate the different extractabilities and their correlation to tannin extraction of the different cultivars.
The MCP method for tannin analysis is a much quicker and easier method to use than the BSA method if one is interested in the tannin concentration of the wine. To investigate the MP, SPP and LPP of the wine, the BSA method is the only method to use. As Sacchi et al. (2005) state, a lot of studies have been done on the effect of winemaking techniques, but these studies have not included the effect on polymeric pigments.
The different winemaking treatments had different results in relation to the extraction of tannins and anthocyanins by the two cultivars and at the two ripeness levels. It seems that, in our study, the CM treatment had no effect on total anthocyanin at farm, cultivar and ripeness level. The enzyme treatment showed significantly higher concentrations of tannins and anthocyanins than the other treatments.
LITERATURE CITED
Adams, D.O. & Scholz, R.C., 2007. Tannins - the problem of extraction. In: Blair, R., Williams, P. & Pretorius, S. (eds). Proc. 13th Austr. Wine Ind. Techn. Conf. July Adelaide, South Australia. pp. 160 - 164. [ Links ]
Boulton, R., 2001. The copigmentation of anthocyanins and its role in the color of red wine: A critical review. Am. J. Enol. Vitic. 52(2), 67-87. [ Links ]
Cheynier, V., Duenas-Paton, M., Salas, E., Maury, C., Souquet, J-M., Sarni-Manchado, P. & Fulcrand, H., 2006. Structure and properties of wine pigments and tannins. Am. J. Enol. Vitic. 57(3), 298-305. [ Links ]
Chorti, E., Guidoni, S., Ferrandino, A. & Novello, V., 2010. Effect of different cluster sunlight exposure levels on ripening and anthocyanin accumulation in Nebbiolo grapes. Am. J. Enol. Vitic. 61(1), 23-30. [ Links ]
Corder, R., 2007. The red wine diet. Avery, New York. [ Links ]
Du Plessis, C.S. & Van Rooyen, P.C., 1982. Grape maturity and wine quality. S.Afr. J. Enol. Vitic. 3, 41-45. [ Links ]
Ferre, L., 1958. Traite D'oenologie Bourguignonne. 110. Institut National Appelation d'origin du Vin et Eaux-de-Vie, Paris, France [ Links ]
Gawel, R., 1998. Red wine astringency: A review. Austr. J. Grape Wine Research 4, 74-95. [ Links ]
Glories, Y., 1984a. La couleur des vins rouges 1: les equilibres des anthocyanes et des tanins. Connaissance Vigne Vin 18(3), 195-217. [ Links ]
Glories, Y., 1984b. La couleur des vins rouges 2: mesure origine et interpretation. Connaissance Vigne Vin 18(4), 253-271. [ Links ]
Gómez-Plaza, E., Gil-Munoz, R. López-Roca, J.M. & Martinez, A., 2000. Color and phenolic compounds of a young red wine: influence of wine making techniques, storage temperature and length of storage time. J. Agric. Food Chem. 48, 736-741. [ Links ]
Gómez-Plaza, E., Gil-Munoz, R., López-Roca, J.M., Martinez-Cutillas, A. & Fernandez-Fernandez, J.I., 2001. Phenolic compounds and color stability of red wines: Effect of skin maceration time. Am. J. Enol. Vitic. 52(3), 266270. [ Links ]
Gonzalez-Neves, G., Gil, G. & Barreiro, L., 2008. Influence of grape variety on the extraction of anthocyanins during the fermentation on skins. Eur. Food Res. Techn. 226(6), 1349-1355. [ Links ]
Guerin, L., Sutter, D.H., Demois, A., Chereau, M. & Trandafir, G., 2009. Determination of activity profiles of the main commercial enzyme preparations used in winemaking. Am. J. Enol. Vitic. 60(3), 322-331. [ Links ]
Hagerman, A.E & Butler, L.G., 1978. Protein precipitation method for the quantitative determination of tannins. J. Agric. Food Chem. 26(4), 809-812. [ Links ]
Harbertson, J.F. & Downey, M.O., 2009. Investigating differences in tannin levels determined by methylcellulose and protein precipitation. Am. J. Enol. Vitic. 60(2), 246-249. [ Links ]
Harbertson J.F., Picciotto E.A. & Adams D.O., 2003. Measurement of polymeric pigments in grape berry extracts and wine using a protein precipitation assay combined with bisulfite bleaching. Am. J. Enol. Vitic. 54, 4. [ Links ]
Iland P., Ewart A. & Sitters J., 1993. Techniques for chemical analysis and stability tests of grape juice and wine. Patric Iland Wine Promotions, Australia. [ Links ]
Jackson, D.I. & Lombard, P.B., 1993. Environmental and management practices affecting grape composition and wine quality: a review. Am. J. Enol. Vitic. 44(4), 409-430. [ Links ]
Joscelyne, V. & Ford, C.M., 2008. Consequences of extended maceration for red wine colour and phenolics. Grape and Wine Research & Development Corporation, University of Adelaide, Adelaide. [ Links ]
Lorenzo, C., Pardo, F., Zalacain, A., Alonso, G.L. & Salinas, M.R., 2005. Effect of red grapes co-winemaking in polyphenols and color of wines. J. Agric. Food Chem. 53, 7609-7616. [ Links ]
Mansfield, A.K. & Zoecklein, B.W., 2003. Effect of fermentation, postfermentation, and postbottling heat treatment on Cabernet Sauvignon glycoconjugates. Am. J. Enol. Vitic. 54(2), 99-104. [ Links ]
Margalit, Y., 1997. Chapter III. Phenolic compounds. In: Margalit, Y. (ed.) Concepts in wine chemistry. The Wine Appreciation Guild, San Francisco. pp. 115 - 116. [ Links ]
McMahon, H.M., Zoecklein, B.W. & Jasinski, Y.W., 1999. The effects of prefermentation maceration temperature and percent alcohol (v/v) at press on the concentration of Cabernet Sauvignon grape glycosides and glycoside fractions. Am. J. Enol. Vitic. 50(4), 385-390. [ Links ]
Monagas, M., Bartolomé, B. & Gómez-Cordovés, C., 2005. Updated knowledge about the presence of phenolic compounds in wine. Crit. Revs Food Sci. Nutrit. 45, 85-118. [ Links ]
Mori, K., Sugaya, S. & Gemma, H., 2005. Decreased anthocyanin biosynthesis in grape berries grown under elevated night temperature conditions. Scientia Horticulturae 105, 319-330. [ Links ]
Ortega-Regules, A., Romero-Cesales, I., Ros-Garcia, J.M., Lopez-Roca, J.M. & Gomez-Plaza, E., 2006. A first approach towards the relationship between grape skin cell wall composition and anthocyanin extractability. Analytica Chimica Acta 563, 26-32. [ Links ]
Remy, S., Fulcrand, H., Labarbe, B., Cheynier, V. & Moutounet, M., 2000. First confirmation in red wine products resulting from direct anthocyanin-tannin reactions. J. Sci. Food Agric. 80, 745-751. [ Links ]
Ribéreau-Gayon, P., Dubourdieu, D., Donèche, B. & Lonvaud, A., 2000a. Maceration. In: Ribereau-Gayon, P. et al. (eds). Handbook of Enology vol 1. John Wiley & Sons Ltd. New York. pp. 311 - 323. [ Links ]
Ribéreau-Gayon, P., Dubourdieu, D., Donèche, B. & Lonvaud, A., 2000b. Phenolic compounds. In: Ribereau-Gayon, P. et al. (eds). Handbook of Enology, vol 2. John Wiley & Sons Ltd. New York. pp. 164, 363 - 365. [ Links ]
Revilla, I. & González-San José, M.L., 2003. Addition of pectolytic enzymes: An enological practice which improves the chromaticity and stability of red wines. Intern. J. Food Sci. Techn. 38, 29-36 [ Links ]
Robinson, J., 1999. The Oxford companion to wine. Oxford University Press, Oxford. [ Links ]
Sacchi, K.L., Bisson, L. & Adams, D.O., 2005. A review of the effect of winemaking techniques on phenolic extraction in red wines. Am. J. Enol. Vitic. 56(3), 197-206. [ Links ]
Sarneckis, C.J., Dambergs R.G., Jones P., Mercurio M., Herderich M.J. & Smith P.A., 2006. Quantification of condensed tannins by precipitation with methyl cellulose: Development and validation of an optimized tool for grape and wine analysis. Austr. J. Grape Wine Res. 12, 39-49. [ Links ]
Saucier, C., Little, D. & Glories, Y., 1997. First evidence of acetaldehyde-flavanol condensation products in red wine. Am. J. Enol. Vitic. 48, 370-373. [ Links ]
Schofield, P., Mbugua, D.M. & Pell, A.N., 2001. Analysis of condensed tannins: A review. Animal Feed Science and Technology 91, 21-40. [ Links ]
Scollary, G.R., 2010. Tannin review (final report). Grape and Wine Research and Development Corporation. Australia. [ Links ]
Somers, T.C., 1971. The polymeric nature of wine pigments. Phytochermstry 10, 2175-2186. [ Links ]
Versari, A., Boulton, R.B. & Parpinello, G.P., 2007. Analysis of SO2 resistant polymeric pigments in red wines by High-Performance Liquid Chromatography. Am. J. Enol. Vitic. 58(4), 523-525. [ Links ]
Villamor, R.R., Harbertson, J.F. & Ross, C.F., 2009. Influence of tannin concentration, storage temperature and time on chemical and sensory properties of Cabernet Sauvignon and Merlot wines. Am. J. Enol. Vitic. 60(4): 442-449. [ Links ]
Webster's Encyclopedic Unabridged Dictionary, 1989. Gramercy Books, Avenel, New Jersey. [ Links ]
Winkler, A.J., 1965 (2nd ed). Climate and soils. In: Winkler, A.J. et al. (eds). General viticulture. University of California Press. Los Angeles. [ Links ]
Winter, E., Whiting, J. & Rousseau, J., 2004. Wine grape berry sensory assessment in Australia. Winetitles, Adelaide. [ Links ]
Zimmer, A., Joslin, W.S., Lyon, M.L., Meier, J. & Waterhouse, A.L., 2002. Maceration variables affecting phenolic composition in commercial-scale Cabernet Sauvignon winemaking trails. Am. J. Enol. Vitic. 53(2), 93-98. [ Links ]
Submitted for publication: April 2014
Accepted for publication: May 2014
* Corresponding author: mlambrechts@distell.co.za
E-mail addresses: AntonN@elsenburg.com; pvanrensburg@distell.co.za
