


Services on Demand
Article
 English (pdf)
 Article in xml format
 Article references
Indicators

Related links
-
 Cited by Google
 -
 Similars in Google
Share

 Permalink
South African Journal of Enology and Viticulture
On-line version ISSN 2224-7904
Print version ISSN 0253-939X
S. Afr. J. Enol. Vitic. vol.35 n.2 Stellenbosch 2014
Phenolic characterisation and antioxidant capacity of young wines made from different grape varieties grown in Helanshan Donglu wine zone (China)
T.-T. MaI, #; X.-Y. SunI, II, #; G.-T. GaoI; X.-Y. WangI, *; X.-Y. LiuII; G.-R DuIII; J.-C. ZhanII
ICollege of Food Engineering and Nutritional Science, Shaanxi Normal University, Xi'an 710062, P.R. China
IICollege of Food Science and Nutritional Engineering, China Agricultural University, Beijing, 100083, P.R. China
IIIDepartment of Life Science, Xi'an University of Arts and Science, Xi'an, 710065, P.R. China
ABSTRACT
The Helanshan Donglu wine zone (China) is one of the most successful wine region of China, and the phenolic characterisation and antioxidant capacity of the primarily young, monovarietal wines from there were evaluated. The result showed that Helanshan Donglu wines contained abundant phenolic compounds, especially flavan-3-ols, and possessed high antioxidant capacity. In different grape varieties, the phenolic profiles varied greatly in both red and white wines. For red wines, Cabernet Sauvignon represented the highest total phenols (2 631 mg/L GAE), total flavonoids (1 840.83 mg/L CTE) and antioxidant capacity. Gamay and Cabernet Gernischt possessed the highest total flavan-3-ols (1 108.08 mg/L CTE) and total anthocyanins (258.78 mg/L CGE). Amongst the white wines, Chardonnay and Chenin blanc showed the highest phenolic contents and antioxidant capacity. (+)-Catechin and (-)-epicatechin were dominant phenolic constituents in both the red and white wines. Gallic acid and salicylic acid were the second most abundant in red wines, while gentisic acid was the second most abundant in white wines.
Key words: Helanshan Donglu wine zone, grape variety, phenolic compounds, antioxidant capacity
INTRODUCTION
Phenolic compounds are one of the main characteristics of wine. These compounds are abundant in both red and white wines. A large number of studies have shown that these compounds significantly influence the sensory characteristics of wines, such as mouthfeel, colour, palatability, bitterness and astringency (Hogan et al., 2009; Li et al., 2009; Liang et al., 2012; Meng et al., 2012, 2013). What is more, since the discovery of the 'French Paradox', the health properties of wines have been proved to be related mainly to the antioxidant capacity of the phenolic compounds of wines (Li et al., 2009; Meng et al., 2012). As a result, phenolics in wines have attracted more and more interest from researchers in both food science and medicine.
In recent years, the emerging wine market in China has started attracting attention from all over the world. Chinese wine consumption is ranked fifth in the world and is still growing very fast (OIV, 2012). At the same time, the Chinese wine region has also attracted the attention of the world. China's wine industry history is very short, but it has ample potential. In fact, Chinese wine production was ranked the sixth in the world in 2012 (OIV, 2012). As regions suitable for viticulture in China are vast, huge parts of Chinese are up for grabs. The Helanshan Donglu wine zone, a rising grape and wine region of China which has been called the Chinese Bordeaux, is one of the most successful wine regions in the country. With its excellent climate and geographical features suitable for viticulture, this region had attracted not only Chinese wineries, including Changyu, Dynasty, the Great Wall, etc., but also many foreign vintners, such as Moët Hennessy-Louis Vuitton and Pernod Ricard. It also has the honour of receiving China's product of geographical indication, 'Wine in Helan mountain east region' in 2011.
Monovarietal wines are popular in the new world, and there have been papers reporting on the phenolic characterisation and antioxidant capacity of monovarietal wines in the new world wine region (Li et al., 2011; Fanzone et al., 2012). However, to the best of our knowledge, there has been no report on the phenolic characterisation and antioxidant capacity of monovarietal wines from the Helanshan Donglu wine zone. In this study, we chose the main monovarietal wines, including five red varieties and five white varieties, to investigate the phenolic characterisation and antioxidant properties of Helanshan Donglu wine. Thus, the study was expected to provide some parameters that could facilitate the development of monovarietal wines and provide some references to consumers of and researchers on Helanshan Donglu wine.
MATERIALS AND METHODS
Chemicals and standards
Standards of (+)-catechin, (-)-epicatechin, (-)-epigallocat-echin gallate, (-)-epicatechin gallate, quercetin, rutin, caffeic acid, trans-ferulic acid, chlorogenic acid, p-coumaric acid, vanillic acid, gallic acid, gentisic acid, salicylic acid and trans-resveratrol; folin-Ciocalteu's phenol reagent, 2,2-di-phenyl-1-picrylhydrazyl (DPPH), 2,2'-azino-bis-(3-ethyl-benzothiazoline-6-sulfonic acid) diammonium salt (ABTS), 6-hydroxy-2,5,7,8-tetramethylchroman-2-carboxylic acid (Trolox) and p-dimethyl-aminocinnamaldehyde (DMACA) were obtained from Sigma-Aldrich (St. Louis, MI, USA). Methanol, acetonitrile and glacial acetic acid (HPLC grade) were from Spectrum Chemical Co. (California, USA). De-ionised water was from Wahaha Co. (Hangzhou, China). All other reagents used were analytical grade unless specially noted.
Wines
The Ningxia Helan Zone is located on the alluvial plain at an altitude of about 1 000 m with a cool and semi-arid climate and large temperature differences between daytime and night time; it lies beyond the mountains and has gravelly soils. It has an annual accumulated temperature of 24°C, with abundant sunshine and annual rainfall of 150 to 200 mm. The data were supplied by Qingtongxia weather station.
Ten monovarietal wines, including five red grape variety - Cabernet Sauvignon, Cabernet Gernischt, Gamay, Cinsault and Merlot, and five white grape variety - Semillon, Ugni blanc, Chardonnay, Italian Riesling and Chenin blanc, which were the main grapes planted in this region, were collected. The vintage was 2011, and the vines were eight years old and trained on a Guyot training system. All ten monovarietal wines were made from grapes grown in the designated areas in strict accordance with the local wine production technical rules and proper maturation coefficients. In order to avoid and reduce the potential impact of the brewing technology, all the pre-fermentation treatments and winemaking with different varieties were done using just the same procedure with the red and white wines respectively (Li et al., 2007). Some important physicochemical parameters of the ten varieties of grape wines are described in the Appendix. Fresh wines of about 2 500 mL for each variety were sampled from at least two independent fermentation processes and then pooled together to eliminate the influence of the fermentation conditions and to guarantee that the result only reflected varietal characteristics. Each pooled sample was divided into three parts and then stored at 15°C in bottles in darkness, and each bottle was opened immediately before the analysis.
Determination of total phenols, total flavonoids, total flavan-3-ols and total anthocyanins of the wine samples
The total phenol content was determined according to the Folin-Ciocalteu colorimetric method (Singleton & Rossi, 1965). Absorbance was measured at 765 nm. The results were expressed as mg/L gallic acid equivalents (GAE). Gallic acid standard solutions were prepared at a concentration ranging from 0 to 1 000 mg/L.
The total flavonoid content was determined according to a previously described protocol (Li et al., 2009). Absorbances were measured at 510 nm. Results were expressed as mg/L catechin equivalents (CTE). Catechin standard solutions were prepared at a concentration ranging from 0 to 125 mg/L.
The total flavan-3-ol content was estimated using the slightly modified DMACA method (Meng et al., 2012). Absorbances were measured at 640 nm. Results were expressed as mg/L catechin equivalents (CTE). Catechin standard solutions were prepared at a concentration ranging from 0 to 1 000 mg/L.
The total anthocyanin content was estimated using the pH differential method (Wrolstad, 1976). Absorbances were measured at 510 nm and 700 nm in pH 1.0 and 4.5 buffers and calculated using the equation A = (A510 - A700) pH 1.0 - (A510 - A700) pH 4.5. Each wine was diluted so that the sample in the buffer at pH 1.0 had an absorbance of < 1. The TA content was calculated using the following formula: TA content (mg CGE per litre wine) = (A χ MW χ DF χ 1000)/(ε χ 1), where A is the absorbance, MW is the molecular weight of cyanidin-3-glucoside (449 g/mol), DF is the dilution factor, and ε is the molar extinction coefficient of cyanidin-3-glucoside (29600). The results were expressed in terms of cyanidin-3-glucoside (CGE).
All spectrophotometric measurements were performed on a UV-Vis double beam Hitichi U-3010 spectrometer (Hitichi, Kyoto, Japan).
Phenolic compounds analysis by HPLC
Preparation of sample
For the red wines, a wine sample of 30 mL was extracted thrice with ethyl acetate (with triple volume of wine). The combined ethyl acetate phase was removed by rotary evaporation at 35°C, and the remainder was resolved in methanol (chromatography grade) up to a final volume of 10 mL. White wines were treated in the same way as the red wines, except the wine sample volume and final volume of methanol were 100 mL and 5 mL, respectively. Final samples were filtered by 0.22 μm organic membranes prior to analysis by high performance liquid chromatography (HPLC) (Li et al., 2011; Meng et al., 2012).
A Waters Breeze liquid chromatograph, equipped with a 1525 Bin pump, a 2487 DAD Detector, an Autoscience AT-130 column heater and a Waters XBridgeTM Shield RP18 (4.6 x 250 mm, 3.5 um), was used. The mobile phase comprised (A) 98% (v/v) acetonitrile containing 2% (v/v) glacial acetic acid and (B) 2% (v/v) glacial acetic acid. The elution gradient was from 5% to 15% A for 60 min, 15% A for 5 min, from 15% to 20% for 1 min, 20% A for 7 min, from 20% to 30% for 1 min, 30% A for 6 min, from 30% to 40% for 1 min, 40% A for 12 min, and from 40% to 5% A for 2 min, with a flow rate of 0.8 ml/min. The injection volume was 20 ul and the detection wavelength was 280 nm and 320 nm. The column temperature was 30°C. The data of the HPLC validation method are described in the Appendix.
Determination of antioxidant capacity
Free radical scavenging activity on DPPH
The ability of wines to scavenge DPPH free radicals was determined. Scavenging activity was based on the slightly modified method (Ma et al., 2013). Briefly, 0.1 mL of red wine (diluted at 1:20) or white wine (without being diluted) was added to 3.9 mL of a 6χ10-5 M solution of DPPH in methanol. A control sample containing the same volume of solvent instead of extract was used to measure the maximum DPPH absorbance. After the reaction had been allowed to take place in the dark for 20 min, the absorbance at 515 nm was recorded to determine the concentration of remaining DPPH. The percentage inhibition of the initial concentration of DPPH radical was calculated as: % inhibition = [(ADPPH-Awine)/ADPPH] χ 100. The results were expressed as trolox equivalent antioxidant capacity. Trolox standard solutions were prepared at a concentration ranging from 0 to 1 200 M per litre.
Free radical scavenging activity on ABTS The ABTS assay was based on a slightly modified method (Li et al., 2009). ABTS radical cation (ABTS+) was produced by reacting 7 mM ABTS solution with 2.45 mM potassium persulphate aqueous solution and allowing the mixture to stand in the dark at room temperature for 12 to 16 h before use. The ABTS+ solution was diluted with ethanol to an absorbance of 0.70 ± 0.02 at 732 nm. After the addition of 100 uL of red wine (diluted at 1:100) or white wine (diluted at 1:10) to 3.9 mL of diluted ABTS+ solution, absorbance was measured at exactly 8 min. The percentage inhibition of the initial concentration of ABTS+ radical was calculated as: % inhibition = [(AABTS-Awine)/AABTS] χ 100. Results were expressed as Trolox equivalent antioxidant capacity. Trolox standard solutions were prepared at a concentration ranging from 0 to 1 200 M per litre.
Statistical analysis
Experimental results were means ± SD of three parallel measurements. Statistical analyses were performed by DPS v. 7.05 for Windows. One-way analysis of variance (ANOVA) was applied to all wine samples to verify significant differences at the 5% level. Hierarchical cluster analysis was carried out to ascertain the distinguishing aspects of the variety, And correlation was calculated by linear regression.
RESULTS AND DISCUSSION
Comparison of total phenols, total flavonoids, total flavan-3-ols and total anthocyanins of the wine samples
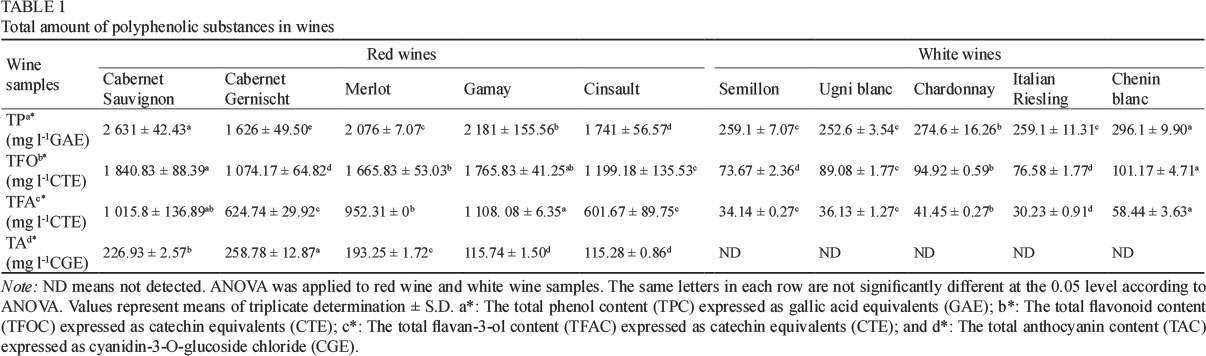
Phenolic compounds, an important group of plant secondary metabolites, are present in large amounts in fruits of different Vitis species, among which V. vinifera is the most representative (Ma et al., 2013; Meng et al., 2013). These compounds are also abundant in one of the end products of grapes, i.e. wine. These constituents can be divided into two groups: flavonoid compounds (anthocyanins, flavan-3-ols and flavonols) and non-flavonoid compounds (hydroxybenzoic and hydroxycinnamic acids and stilbenes) (Li et al., 2009). These compounds are considered major contributors to the sensory characteristics and antioxidant activity of wines (Meng et al., 2012). We examined the correlative phenolic composition (including the total phenols, the total flavonoids, the total flavan-3-ols and the total anthocyanins) of the samples; the detailed results are shown in Table 1. As expected, the red wines had significantly higher amounts of total phenols, total flavonoids and total flavan-3-ols than the white wines. Grape pigments or anthocyanins are present in red grapes only. This is due to the greater contact time between the grape skin and the seed and higher temperature for the fermentation process for red wines (Li et al., 2009).
In Table 1, the total phenol content of red wines is shown to range from 1 626 to 2 631 mg/L GAE, while the total flavonoid content ranged from 1 074.17 to 1 840.83 mg/L CTE. Both the total phenol content and total flavonoid content decreased in the order: Cabernet Sauvignon > Gamay > Merlot > Cinsault > Cabernet Gernischt. The total flavan-3-ol content varied from 601.67 mg/L to 1 108.08 mg/L of CTE. In contrast to total phenols and total flavonoids, Gamay displayed the highest total flavan-3-ols, followed by Cabernet Sauvignon and Merlot, while Cabernet Gernischt and Cinsault represented the lowest content of total flavan-3-ols. With respect to the total anthocyanins, values ranged from 115.28 mg/L to 258.78 mg/L of CGE. The total anthocyanin content of Cabernet Gernischt and Cabernet Sauvignon was more than twice that of Gamay and Cinsault. Interestingly, Cabernet Gernischt showed significantly lower total phenols, total flavonoids and total flavan-3-ols, but represented the most total anthocyanins.
With regard to the white wines, the total phenol content ranged from 252.6 mg/L to 296.1 mg/L GAE, while total flavonoids varied from 73.67 mg/L to 101.17 mg/L CTE, and total flavan-3-ols from 30.23 mg/L to 58.44 mg/L CTE. Chenin blanc had the highest content of total phenols, total flavonoids and total flavan-3-ols, followed by Chardonnay. Moreover, no significant difference was found among the total phenols of Semillon, Ugni blanc and Italian Riesling. Apart from that, Semillon and Italian Riesling represented the lowest content of total flavonoids and total flavan-3-ols respectively.
In previous research, many authors reported that the total phenol content decreased in the orders: Cabernet Sauvignon > Syrah > Malbec > Merlot > Pinot Noir (Granato et al., 2010); Cabernet Sauvignon > Agiorgitiko > Syrah > Barbera (Kallithraka et al., 2006); Cabernet Sauvignon > Merlot > Cabernet Gernischt > Muscat Hamburg (Li et al., 2009). According to the present research, we could observe that the order of phenolic compound contents in the different cultivars which were collected from the different regions was almost unchanged.
Compared with other regions, Helanshan Donglu wines contained highly phenolic compounds. Take Cabernet Sauvi-gnon for example; the total phenols of Cabernet Sauvignon (2 631 mg/L GAE) from the other regions are as follows: 1 260 to 1 893 mg/L GAE in Brazil (Granato et al., 2010), 2 481 mg/L GAE in Greece (Kallithraka et al., 2006); 2 133 mg/L GAE in Chile (Minussi et al., 2003) and 1 635 to 2 927 mg/L GAE in China (Li et al., 2009).
Comparison of phenolic composition
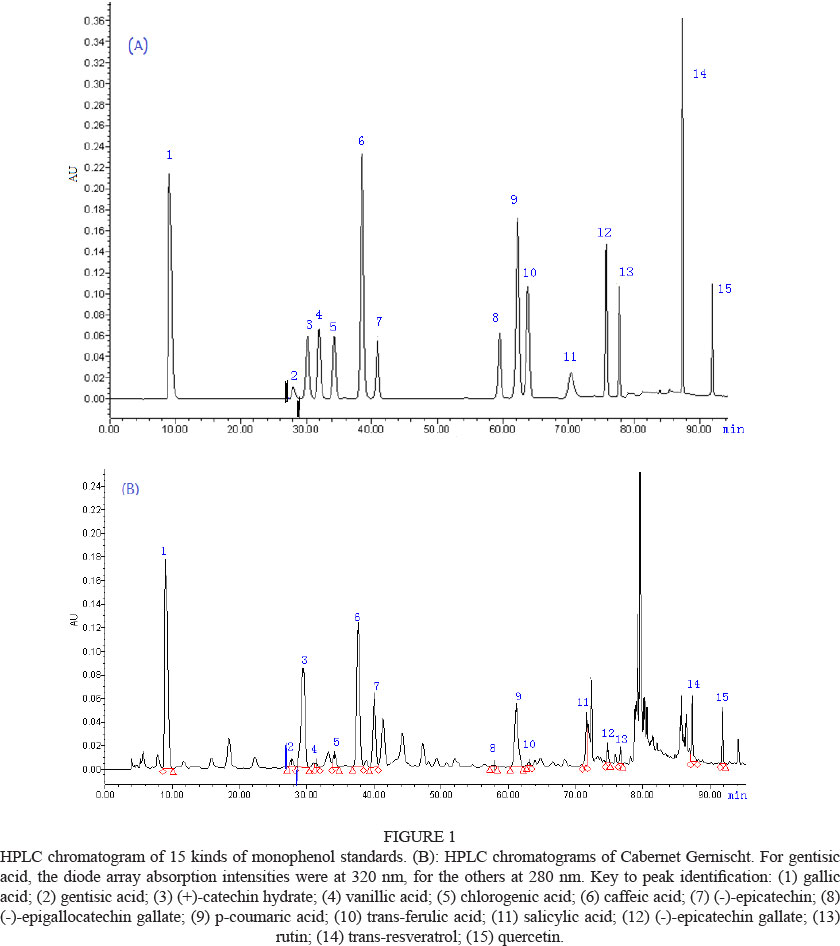
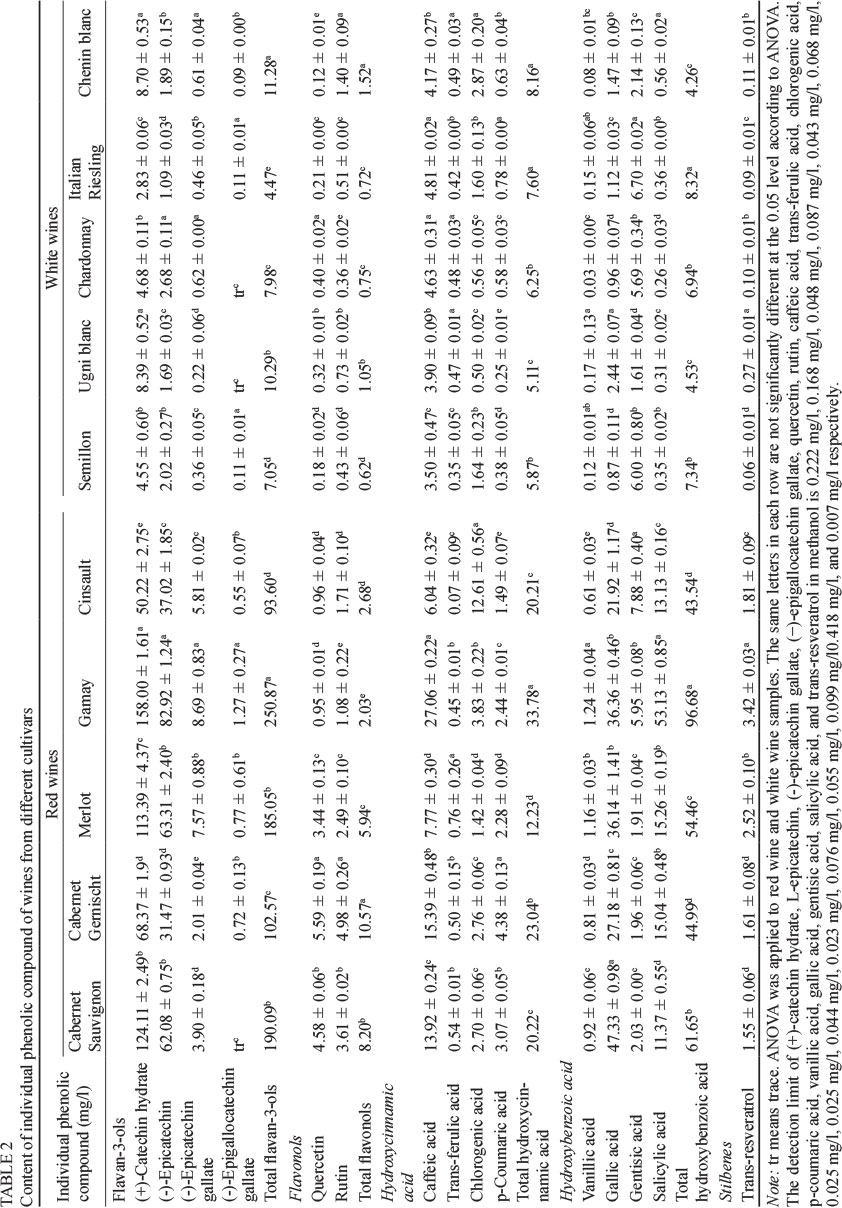
For a better characterisation of the phenolic composition of the ten monovarietal wines, a detailed study was performed using HPLC. Fifteen phenolic compounds, including five classes of individual phenolic compounds, were investigated and analysed, including two flavonols, four flavan-3-ols, four hydroxycinnamic acids, four hydroxybenzoic acids and one stilbene (Fig. 1; Table 2). These compounds are present in numerous varieties of grapes and their content is abundant; furthermore, these compounds have also been shown to have great influence on the sensory characteristics of wine (Hogan et al., 2009; Liang et al., 2012; Meng et al., 2012, 2013). In addition, these compounds have also been shown to be potent antioxidants and have significant biological, medicinal and pharmacological properties (Meng et al., 2012). The phenolic content of various monovarietal wines is listed in Table 2. The differences between the varieties of monovarietal wines are reflected in the detailed individual phenolic profiles. Statistically significant differences were found between the varieties analysed for each compound assayed.
Flavan-3-ols were the major class of phenolic compounds present in this study. They are extracted from grape skins and seeds during winemaking and are found in the solid parts of the berry (seed, skin and stem) in monomeric, oligomeric or polymeric forms; the latter two forms are also called proanthocyanidins or condensed tannins (Meng et al., 2012). They are mainly responsible for the astringency, bitterness and structure of wines, and play an important role in the stabilisation of wine colour during ageing (Fang et al., 2008). In the red wines, the results showed that (+)-catechin and (-)-epicatechin were the major flavonoid constituents. Compared to other flavan-3-ols, the (+)-catechin and (-)-epicatechin levels were significantly higher in all wines (54% and above 32%, respectively). These results are in agreement with those reported by other authors for other varieties (Fanzone et al., 2010; Zhu et al., 2012). Consistent with the spectroscopy method, Gamay contained both the highest individual flavan-3-ols and the highest total flavan-3-ols. The contents of the individual flavan-3-ols and the total flavan-3-ols in Cabernet Gernischt and Cinsault were all lower. The values of the total flavan-3-ols were one-third of Gamay, and half of Cabernet Sauvignon and Merlot. Moreover, the (-)-epigallocatechin gallate was not detected in Cabernet Sauvignon, and it was also very low in the other wine samples. In the white wines, the result also showed that (+)-catechin and (-)-epicatechin were the major flavonoid constituents. The proportion of (+)-catechin in white wine was above 60%. However, the proportion of l-epicatechin in white wine was lower than that in red wine, at above 16%. (-)-Epigallocatechin gallate was not detected in Ugni blanc and Chardonnay. Consistent with the spectroscopy assay, Chenin blanc and Italian Riesling represented the wines with the highest and lowest total flavonoids respectively. The total flavonoids in Chenin blanc was more than three times that of Italian Riesling, mainly attributed to its extremely abundant (+)-catechin. The content of (+)-catechin in Chenin blanc and Ugni blanc was over four times that in Italian Riesling and more than two times that in Chardonnay and Semillon.
Flavonols are another important group of flavonoids. They originate from the berry skins of both white and red grapes and are transferred to the wine during the process of winemaking. They seem to contribute to bitterness and colour (Meng et al., 2012). They vary in colour from white to yellow, closely related in structure to the flavones (Makris et al., 2006). In addition, they also contribute to the colour stabilisation of red wines by reinforcing the pigmentation due to anthocyanins, a phenomenon known as co-pigmentation (Boulton, 2001). The total concentrations of flavonols varied widely among the sample of wines analysed, ranging from 2.03 to 10.57 mg/L in red wines and at about 1 mg/L in white wines. These results are in agreement with those obtained by other authors (Li et al., 2011). For the red wines, Cabernet Gernischt contained the highest quercetin and rutin, and the contents of quercetin and rutin in Gamay and Cinsault were obviously lower than in the other cultivars. In contrast with the results of the spectroscopy assay, Cabernet Sauvignon and Gamay showed higher total flavonoids. The reason for this discrepancy might be that, although quercetin and rutin are important flavonols in wines, their proportion did not account for much more in the total flavonoids. For the white wines, Chenin blanc contained the highest content of rutin, at two to five times that of the other varieties. Chardonnay contained the lowest content of rutin. Chardonnay and Chenin blanc represented the highest and lowest quercetin contents respectively. The result of total flavonoids by HPLC was consistent with spectroscopy assay.
In wine there are two groups of phenolic acids:
hydroxybenzoic acids and hydroxycinnamic acids (Meng et al., 2012). In some of the literature, hydroxycinnamic acids are reported as the dominant phenolic acids in wines (Fanzone et al., 2010, 2012), but in this study, hydroxybenzoic acids were the dominant phenolic acids. Hydroxybenzoic acids are derived from benzoic acid. With regard to red wines, the results showed gallic acid and salicylic acid were the major hydroxybenzoic acid constituents. Compared to other hydroxybenzoic acids, their proportion was significantly higher in all the wines, accounting for 37.5% in Gamay and above 50% in the other varieties. Cabernet Sauvignon contained the highest gallic acid, and Cinsault contained the lowest gallic acid, only half of the content in Cabernet Sauvignon. For salicylic acid, the highest level was observed in Gamay, which had nearly five times that in the other varieties. Moreover, the salicylic acid in Gamay was both higher in proportion and value. Highly salicylic acid content could be helpful to distinguish Cinsault from other red grape varieties. The proportion of vanillic acid and gentisic acid in the hydroxybenzoic acids in red wines was lower. Specifically, Gamay and Cinsault represented the highest and lowest vanillic acid contents respectively. For gentisic acid, the content of it in both Gamay and Cinsault was higher than that in other varieties; its contents in Cabernet Sauvignon, Merlot and Cabernet Gernischt were only one-third of that in Gamay and Cinsault. As seen in Table 2, Gamay had the highest level of total hydroxybenzoic acids, which can be attributed mainly to its extremely abundant salicylic acid. Compared with the wines from the other varieties, Cinsault contained significantly lower gallic acid and salicylic acid contents, thus leading to a relatively lower content of total hydroxybenzoic acids. This is inconsistent with most vinifera wines dominated by gallic acid (Fanzone et al., 2010, 2012; Meng et al., 2012). In contrast to red wines, gentisic acid was the major hydroxybenzoic acid constituent in white wines. Its proportion was significantly higher in all the wines compared to other hydroxybenzoic acids, at above 90%. The contents of gentisic acid in Chardonnay, Semillon and Italian Riesling were over three times more than that in Chenin blanc and Ugni blanc. The secondary hydroxybenzoic acid constituent in white wines was gallic acid. Ugni blanc had the highest content of gallic acid, and the highest content of vanillic acid. For salicylic acid, Chenin blanc and Chardonnay represented the highest and lowest contents respectively.
With regard to hydroxycinnamic acid in the red wines, the result showed that caffeic acid was the major hydroxycinnamic acid constituent. Gamay had the highest content of caffeic acid, almost twice that of Cabernet Sauvignon and Cabernet Gernischt and nearly five times that of Merlot and Cinsault. Merlot and Cinsault represented the highest and lowest trans-ferulic acid contents respectively. With regard to p-coumaric acid, Gamay had the highest levels, almost four times that of Cinsault. Moreover, Cinsault had much higher chlorogenic acid than the other varieties, while the contents of the other compounds were usually lower. The character of high chlorogenic acid and low other phenolic compounds could be helpful to distinguish Cinsault from the other red grape varieties. In the case of the white wines, caffeic acid was the major hydroxycinnamic acid constituent. Italian Riesling and Semillon had the highest and lowest caffeic acid respectively. Chenin blanc and Semillon represented the highest and lowest trans-ferulic acid respectively. Chenin blanc showed the highest chlorogenic acid which was almost five times that in Ugni blanc and Chardonnay. In relation to p-coumaric acid, Italian Riesling possessed the highest content.
Among the non-flavonoids, stilbenes are the important compounds due to their putative protective effects against cardiovascular diseases (Meng et al., 2012). It was suggested that the concentrations of these compounds in wines vary from values of < 1 to 30.0 mg/L (Vitrac et al., 2002), depending on multiple factors, such as grape variety, fungal infections, winemaking procedures and weather conditions. In this study we detected only trans-resveratrol. In the red wines, the highest trans-resveratrol was observed in Gamay (3.42 mg/L) and the lowest in Cabernet Sauvignon (1.55 mg/L). In the white wines, Ugni blanc had the highest (0.27 mg/L), and no significant differences was observed in the other varieties.
Cluster analysis
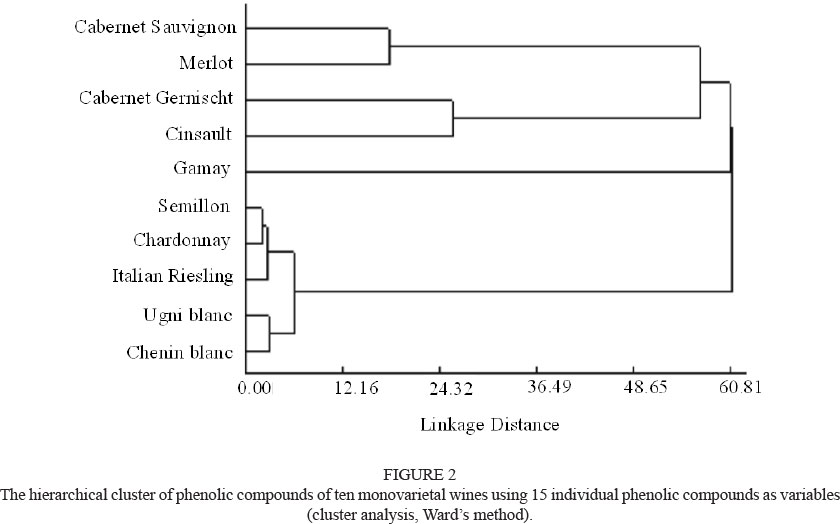
Finally, in order to better understand the similarities and differences in the profiles of the phenolic compounds among these monovarietal wines, cluster analysis was performed using these identified phenolic compounds as variables. As shown in Fig. 2, of the red wines, Cabernet Sauvignon and Merlot could be clustered within a short hierarchical distance, indicating they had similar profiles of phenolic compounds. A similar fingerprint of phenolic compounds was also observed in Cinsault and Cabernet Gernischt. However, Gamay showed great differences from the other grape varieties. It is suggested that the profiles of phenolic compounds in Gamay are significantly different from those in other grape varieties. Interestingly, Cabernet Sauvignon and Cabernet Gernischt were not clustered within a short hierarchical distance, although they seem to belong to the same class from the naming rule.
With regard to the white wines, a similar fingerprint of phenolic compounds was observed in Chardonnay and Semillon, indicating that they had similar phenolic compound profiles. Chenin blanc and Ugni blanc could be clustered within a short hierarchical distance. Moreover, Italian Riesling showed greater differences from Chenin blanc and Ugni blanc than Chardonnay and Semillon, which might mean that the profile of phenolic compounds in Italian Riesling was significantly different from that in Chenin blanc and Ugni blanc. Chenin blanc and Ugni blanc were clustered within a short hierarchical distance, just like their names in terms of the naming rule.
On the whole, significant differences could be observed among different grape varieties in terms of phenolic profiles. Many remarkable features could be observed, such as a high chlorogenic acid content with lower contents of other phenolic compounds in Cinsault, both highly in proportion and value of salicylic acid in Gamay. With these remarkable features, we could distinguish particular wines from other varieties.
With respect to Helanshan Donglu wines, the result showed (+)-catechin and (-)-epicatechin were the dominant phenolic constituents in both the red and white wines. Gallic acid and salicylic acid were the second most abundant in red wines, while gentisic acid was the second most abundant in white wines. Many published HPLC analyses of wines also reported that the main individual phenolic compounds in wines were (+)-catechin and (-)-epicatechin (Kallithraka et al., 2006; Makris et al., 2006; Fang et al., 2008; Li et al.,, 2011). Compared with these reports, individual phenolic compounds classed with flavan-3-ols and flavonols in Helanshan Donglu wines were high, which was in accordance with the results of total flavan-3-ols and total flavonoids mentioned above. This might be related to the 'terroir' of the Helan zone, as previous research showed that light, water deficits, higher temperature differences between daytime and night time, and infertile soil, which could provide more composites and contents of inorganic ions than fertile ones, could up-regulate the gene expression related to flavonoid metabolism and thus significantly increase the contents of flavonoids (Boulton, 2001; Gollop et al., 2002; Reeve et al., 2005; Li et al., 2011). Under the particular 'terroir' of the Helan zone, the gene expression related to flavonoid metabolism was up-regulated and thus significantly increased the contents of flavonoids.
Antioxidant capacity of the wine samples
Antioxidant capacity
The antioxidant capacity detected by different methods (DPPH and ABTS) in the red and white wines showed significant differences. As shown in Fig. 3, the values ranged from 11 927.38 to 19 388.62 M for red wines and 510.13 to 603.15 M for white wines in the DPPH assay, and from 20 172.76 to 34 165.30 M for red wines and 2 250.97 to 2 974.85 M for white wines in the ABTS assay. The magnitude of the difference depends on the method employed. Other authors have also reported this occurrence (Li et al., 2009; Meng et al., 2012; Paixao et al., 2007). Cabernet Sauvignon possessed the highest antioxidant capacity of the five red grape varieties. In contrast, the antioxidant capacity of Cinsault and Cabernet Gernischt was the lowest. Gamay and Merlot yielded similar antioxidant properties. Specifically, the antioxidant capacity values in Cinsault and Cabernet Gernischt were only half that in Cabernet Sauvignon. In the case of the white wines, Chardonnay and Chenin blanc had the highest antioxidant capacity, while the antioxidant capacity of Italian Riesling, Ugni blanc and Semillon showed no significant difference. Compared with wines from other regions of China (Li et al., 2009; Meng et al., 2012; Zhu et al., 2012), the antioxidant capacity of Helan wine was very high.
Correlation
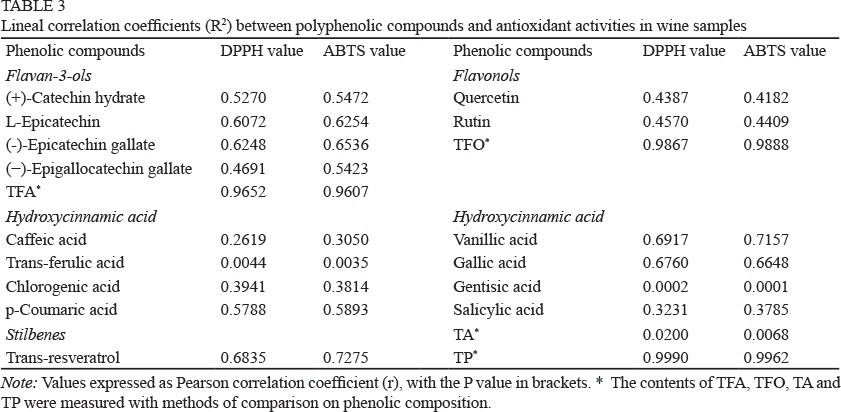
A correlation analysis was made between the total concentrations of each class of compounds and the antioxidant capacity of the wines. The linear correlation coefficients (R2) are shown in Table 3. Total phenols, total flavonoids and total flavan-3-ols of the wines exhibited the strongest correlation with antioxidant properties determined by the DPPH or ABTS method, while total anthocyanins exhibited weaker correlations. This was inconsistent with many other articles in the literature, which also reported a very high degree of correlation between the total phenols, total flavonoids, total flavan-3-ol content and antioxidant properties of wines (Minussi et al., 2003; Li et al., 2009; Porgali & Büyüktuncel, 2012; Meng et al., 2012). But the role of anthocyanins in antioxidant properties is controversial, as some researchers have reported a very high degree of correlation between the total anthocyanins and the antioxidant properties of wines (Meng et al. (2012) nearly 1.0; Paixao et al. (2007) 0.9268). Therefore, more research is needed on the role of the total anthocyanins on antioxidant properties of wines. Overall, it is suggested that polyphenols play the predominant role in antioxidant action.
The correlation between individual phenolic compounds and antioxidant capacity was also investigated. The contribution of different individual phenolic compounds to the antioxidant properties of wines varied greatly. R2 among trans-ferulic acid and gentisic acid with antioxidant capacity determined by the DPPH or ABTS method was almost zero, which means the contribution of trans-ferulic acid and gentisic acid to the antioxidant capacity of wines is very low. A good correlation was obtained between (+)-catechin, (-)-epicatechin, (-)-epigallocatechin gallate, (-)-epicatechin gallate, quercetin, rutin, p-coumaric acid, vanillic acid, gallic acid and trans-resveratrol content and antioxidant capacity measured by DPPH or ABTS. The correlation between caffeic acid, chlorogenic acid, salicylic acid content and antioxidant capacity was slightly lower. Similar results have been reported by other scientists (Prior et al., 2005; Stasko et al., 2006; Paixao et al., 2007).
Thus, the antioxidant efficiency of wines appeared to be largely influenced by total phenols, total flavonoids and total flavan-3-ols, while total anthocyanins played a minor role, and individual phenolic compounds had different effects on the antioxidant capacity of wines.
The phenolic composition of the wines was determined largely by the phenolic composition of the grape berries. Similarly, the phenolic composition of the grape berries depended mainly on the genotypes of the grape cultivar (Mattivi et al., 2006; Tian et al., 2008; Li et al., 2011). Hence, grape variety has a statistically significant effect on the antioxidant properties of the wines. In the present study, Cabernet Sauvignon contained high total phenols, total flavonoids and total flavan-3-ols, and also showed the highest antioxidant properties. Cabernet Gernischt and Cinsault contained lower total phenols, total flavonoids and total flavan-3-ols, and possessed lower antioxidant properties. The same phenomenon was observed in the white wines.
CONCLUSIONS
The phenolic characterisation of young wines made from different grape varieties grown in Helanshan Donglu wine zone, China was evaluated in the present study. Under the particular ‘terroir’ of the Helan zone, Helanshan Donglu wines had a high phenolic content and antioxidant capacity, and were especially abundant in flavan-3-ols and flavonols. Phenolic profiles and antioxidant capacity of the wines were totally different in the different varieties. For red wines, Cabernet Sauvignon represented the highest phenolic contents and antioxidant capacity. Cabernet Sauvignon and Merlot, Cinsault and Cabernet Gernischt were arranged in one group, characterised by contents of individual phenolic compounds, while Gamay was significantly different from the other red grape varieties. Amongst the white wines, Chardonnay and Chenin blanc showed the highest phenolic contents and antioxidant capacity. Chardonnay and Semillon, Chenin blanc and Ugni blanc could be clustered in one group. The phenolic profiles of the different grape varieties also showed large differences. Many of the remarkable features of the phenolic profiles of grape varieties could help us characterise these monovarietal wines. Furthermore, the trends in antioxidant capacity were consistent with the phenolic compounds in wines.
LITERATURE CITED
Boulton, R., 2001. The copigmentation of anthocyanins and its role in the color of red wine: A critical review. Am. J. Enol. Vitic. 52(2), 67-87. [ Links ]
Fang, F., Li, J.M., Zhang, P., Tang, K., Wang, W., Pan, Q.H. & Huang, W.D., 2008. Effects of grape variety, harvest date, fermentation vessel and wine ageing on flavonoid concentration in red wines. Food Res. Int. 41(1), 53-60. [ Links ]
Fanzone, M., Pena-Neira, Á., Jofré, V., Assof, M. & Zamora, F., 2010. Phenolic characterization of Malbec wines from Mendoza Province (Argentina). J. Agr. Food Chem. 58(4), 2388-2397. [ Links ]
Fanzone, M., Zamora, F., Jofré, V., Assof, M., Gómez-Cordovés, C. & Pena-Neira, Á., 2012. Phenolic characterisation of red wines from different grape varieties cultivated in Mendoza Province (Argentina). J. Sci. Food Agr. 92(3), 704-718. [ Links ]
Gollop, R., Even, S., Colova-Tsolova, V. & Perl, A., 2002. Expression of the grape dihydroflavonol reductase gene and analysis of its promoter region. J. Exp. Bot. 53(373), 1397-1409. [ Links ]
Granato, D., Katayama, F.C.U. & Castro, I.A., 2010. Assessing the association between phenolic compounds and the antioxidant activity of Brazilian red wines using chemometrics. LWT-Food Sci. Technol. 43(10), 1542-1549. [ Links ]
Hogan, S., Zhang, L., Li, J., Zoecklein, B. & Zhou, K., 2009. Antioxidant properties and bioactive components of Norton (Vitis aestivalis) and Cabernet Franc (Vitis vinifera) wine grapes. LWT-Food Sci. Technol. 42(7), 1269-1274. [ Links ]
Kallithraka, S., Tsoutsouras, E., Tzourou, E. & Lanaridis, P., 2006. Principal phenolic compounds in Greek red wines. Food Chem. 99(4), 784-793. [ Links ]
Li, H., Wang, H., Yuan, C.L. & Wang, S.S., 2007. Wine technology. Science Press, Beijing. [ Links ]
Li, H., Wang, X.Y., Li, Y., Li, P.H. & Wang, H., 2009. Polyphenolic compounds and antioxidant properties of selected China wines. Food Chem. 112(2), 454-460. [ Links ]
Li, Z., Pan, Q.H., Jin, Z.M., Mu, L. & Duan, C.Q., 2011. Comparison on phenolic compounds in Vitis vinifera cv. Cabernet Sauvignon wines from five wine-growing regions in China. Food Chem. 125(1), 77-83. [ Links ]
Liang, Z.C., Yang, Y.Z., Cheng, L.L. & Zhong, G.Y., 2012. Polyphenolic composition and content in the ripe berries of wild Vitis species. Food Chem. 132(2), 730-738. [ Links ]
Ma, T.T., Tian, C.R., Luo, J.Y., Zhou, R., Sun, X.Y. & Ma, J.J., 2013. Influence of technical processing units on polyphenols and antioxidant capacity of carrot juice. Food Chem. 141(3), 1637-1644. [ Links ]
Makris, D.P., Kallithraka, S. & Kefalas, P., 2006. Flavonols in grapes, grape products and wines: Burden, profile and influential parameters. J. Food Compos. Anal. 19(5), 396-404. [ Links ]
Mattivi, F., Guzzon, R., Vrhovsek, U., Stefanini, M. & Velasco, R., 2006. Metabolite profiling of grape: Flavonols and anthocyanins. J. Agr. Food Chem. 54(20), 7692-7702. [ Links ]
Meng, J.F., Fang, Y.L., Qin, M.Y., Zhuang, X.F. & Zhang, Z.W., 2012. Varietal differences among the phenolic profiles and antioxidant properties of four cultivars of spine grape (Vitis davidii Foex) in Chongyi County (China). Food Chem. 134(4), 2049-2056. [ Links ]
Meng, J.F., Ning, P.F., Xu, T.F. & Zhang, Z.W., 2013. Effect of rain-shelter cultivation of Vitis vinifera cv. Cabernet Gernischt on the phenolic profile of berry skins and the incidence of grape diseases. Molecules 18(1), 381-397. [ Links ]
Minussi, R.C., Rossi, M., Bologna, L., Cordi, L., Rotilio, D., Pastore, G.M. & Duran, N., 2003. Phenolic compounds and total antioxidant potential of commercial wines. Food Chem. 82(3), 409-416. [ Links ]
OIV, 2012. Statistical report on World vitiviniculture 2012. Available: http://www.oiv.int/oiv/files/0%20-%20Actualites/EN/Report.pdf. (accessed June 2012). [ Links ]
Paixao, N., Perestrelo, R., Marques, J.C. & Cámara, J.S., 2007. Relationship between antioxidant capacity and total phenolic content of red, rosé and white wines. Food Chem. 105(1), 204-214. [ Links ]
Porgali, E. & Büyüktuncel, E., 2012. Determination of phenolic composition and antioxidant capacity of native red wines by high performance liquid chromatography and spectrophotometric methods. Food Res. Int. 45(1), 145-154. [ Links ]
Prior, R.L., Wu, X.L. & Schaich, K., 2005. Standardized methods for the determination of antioxidant capacity and phenolics in foods and dietary supplements. J. Agr. Food Chem. 53(10), 4290-4302. [ Links ]
Reeve, J.R., Carpenter-Boggs, L., Reganold, J.P., York, A.L., McGourty, G. & McCloskey, L.P., 2005. Soil and winegrape quality in biodynamically and organically managed vineyards. Am. J. Enol. Vitic. 56(4), 367-376. [ Links ]
Singleton, V.L. & Rossi, J.A., 1965. Colorimetry of total phenolics with phosphomolybdic phosphotungstic acid reagents. Am. J. Enol. Vitic. 16(3), 144-158. [ Links ]
Stasko, A., Polovka, M., Brezová, V., Biskupic, S. & Malik, F., 2006. Tokay wines as scavengers of free radicals (an EPR study). Food Chem. 96(2), 185-196. [ Links ]
Tian, L., Pang, Y. & Dixon, R.A., 2008. Biosynthesis and genetic engineering of proanthocyanidins and (iso)flavonoids. Phytochemistry Rev. 7(3), 445-465. [ Links ]
Vitrac, X., Monti, J.P., Vercauteren, J., Deffieux, G. & Mérillon, J.M., 2002. Direct liquid chromatographic analysis of resveratrol derivatives and flavanonols in wines with absorbance and fluorescence detection. Analytica Chimica Acta 458(1), 103-110. [ Links ]
Wrolstad, R.E., 1976. Color and pigment analyses in fruit products. Bulletin 624. Oregon State University Agriculture Experimental Station, Corvallis, OR. [ Links ]
Zhu, L., Zhang, Y., Deng, J., Li, H. & Lu, J., 2012. Phenolic concentrations and antioxidant properties of wines made from North American grapes grown in China. Molecules 17(3), 3304-3323. [ Links ]
Submitted for publication: April 2014
Accepted for publication: July 2014
Acknowledgements: We express our gratitude to the National Nature Science Foundation Project (31301526), the Scientific Research Project of Shaanxi (2013JQ3016), the Special Fund for Agro-scientific Research in the Public Interest (2012104019-3), and the outstanding doctoral dissertation project of Shaanxi Normal University (X2013YB07). The authors are grateful to Professor Jun-xiang Zhang from Ningxia University, for helping with the vineyard and fermentation conditions in this study.
* Corresponding author: Dr. Xiao-yu Wang, e-mail address: 517841370@qq.com [Tel. & Fax: +86-029-85310517]
# These authors contributed equally to this work
