


Services on Demand
Article
 English (pdf)
 Article in xml format
 Article references
Indicators

Related links
-
 Cited by Google
 -
 Similars in Google
Share

 Permalink
South African Journal of Enology and Viticulture
On-line version ISSN 2224-7904
Print version ISSN 0253-939X
S. Afr. J. Enol. Vitic. vol.35 n.1 Stellenbosch 2014
A mathematical model to evaluate the kinetics of D-glucose and D-fructose fermentations by Saccharomyces bayanus at increasing ethanol concentrations
A. Zinnai; F. Venturi; C. Sanmartin; M.F. Quartacci; G. Andrich
Department of Agriculture, Food and Environment, University of Pisa, Via del Borghetto 80, 56124 Pisa, Italy
ABSTRACT
In the cellar, slow and stuck fermentations occurring during winemaking are often successfully solved by the addition of yeast strains like Saccharomyces bayanus. The kinetic behaviour shown by S. bayanus during alcoholic fermentation was investigated using a mathematical model previously tested for S. cerevisiae, in order to show which of the six functional parameters of the model differed significantly with the yeast population. Although some parameters (hexose fractions converted to ethanol and glycerol) did not change, the kinetic constant related to the inactivation rate of the yeast population showed by S. cerevisiae assumed a value significantly higher (approximately 50-fold) than that observed for S. bayanus, while this latter population was ten times less affected by ethanol than S. cerevisiae. Although no remarkable differences could be found between the ability shown by the two yeast populations to convert hexoses (D-glucose and D-fructose), the tolerance for ethanol accumulation changed strongly. The conversion rate of these two hexoses by S. bayanus was affected less (about ten thousand-fold) by ethanol than that of S. cerevisiae.
Key words: Hexose catabolism, kinetic model, stuck of fermentation, Saccharomyces bayanus, wine, alcoholic fermentation, yeast
INTRODUCTION
Saccharomyces cerevisiae and related yeast species are the most utilised microorganisms to promote the alcoholic fermentation involved in many different production cycles aimed at obtaining alcoholic beverages (wine, beer, etc.) and bioethanol (Schubert, 2006; Inai & Yigitoglu, 2012), despite yeasts being rather sensitive to ethanol accumulation in the reaction medium (Zinnai et al., 2013). In fact, the number of slow or stuck fermentations in winemaking is continuously increasing, in particular in countries characterised by warm climates.
As widely reported in the literature, the lack of micro- and macronutrients necessary for yeasts, unsuitable reaction temperatures, too low pH values, the presence of significant concentrations of inhibitors (ethanol, phenols, etc.) in the reaction medium, the development of dangerous microorganisms, as well as the alteration of the ionic equilibrium, may induce a marked modification in the alcoholic fermentation kinetics (Bauer & Pretorius, 2000; Jones et al., 2005; Sablayrolles, 2009; Tronchoni et al., 2009; Emparan et al., 2012). Moreover, wine producers aim to produce grapes with increased sugar to total acid ratios in order to obtain higher concentrations of phenols and aromatic compounds that can improve wine quality but, as a consequence, they also obtain musts that are very difficult to process due to the unsuitable conditions for yeast reproduction (Loureiro & Malfeito-Ferreira, 2003). Thus, the successful performance of alcoholic fermentation depends on the ability of the yeast strains to cope with a number of stress factors occurring during the whole winemaking process (Van Uden, 1985; Viegas et al., 1989).
As reported in the literature (Gibson et al., 2007), the stress induced by ethanol accumulated in toxic concentrations is the main factor responsible for reduced ethanol production and, possibly, for stuck fermentations. Several authors stated that ethanol affects key features of yeast physiology, such as the membrane transport system (Klis et al., 2002; Gibson et al., 2007), cellular catabolism (Kubota et al., 2004; Hirasawa et al., 2007), cell growth (Carmelo et al., 1997) and cell death (Fernandes et al., 2003). Although ethanol toxicity in yeasts is a complex mechanism, the main target of such stress seems to be the cell membrane, and different mechanisms have been hypothesised (Costa et al., 1993; Rosa & Sa-Correia, 1996; Alexandre et al., 2001; Klis et al.,, 2002; Deutschbauer et al., 2005; Aguilera et al., 2006; Fujita et al., 2006; Nozawa et al., 2006). Some of the biochemical changes induced in yeast by ethanol are similar to those caused by thermal stress (Mira et al., 2009), and a synergistic effect between ethanol and temperature is well documented (Hohmann, 2002).
When a slow or stuck fermentation occurs, unfermented residual sugars can be used by contaminating microorganisms to carry on undesired metabolic pathways (Ribereau-Gayon et al, 2005; Urtubia et al, 2012). Under these conditions, some heterofermentative lactic acid bacteria strains could significantly increase volatile acidity, with a consequent loss of the sensory quality of the alcoholic beverage. Moreover, favourable conditions for the lysis of yeasts and release of intracellular compounds - as often occurs at the end of the alcoholic fermentation when reduced amounts of molecular SO2 are dissolved in the liquid phase - may strongly stimulate the growth of Brettanomyces spp. (Ribereau-Gayon et al., 2005).
The addition of yeast strains like S. bayanus, which effectively endures the stress caused by high ethanol concentrations, often is able to solve slow or stuck fermentation and to favour the conversion of D-fructose in the reaction medium. In fact, S. bayanus is commonly used in champagne production to promote the fermentation of sugars dissolved in the basic wine, and thus is a substrate rich in ethanol. S. bayanus and S. cerevisiae share about 40% of their genomes (Naumov et al, 2000) and can grow in similar environmental conditions, often being found together in many wines and beers (Querol & Bond, 2009). Generally, S. cerevisiae prefers temperatures around 35°C (Querol & Bond, 2009), while S. bayanus can grow and produce ethanol at temperatures ranging from 1 to 30°C (Brown & Oliver, 1982; Pulvirenti et al., 2000; Serra et al., 2005). Moreover, a strain of S. bayanus isolated from wine was able to grow in media containing 15% ethanol (Belloch et al., 2008). The reason why S. cerevisiae preferably metabolises D-glucose rather than D-fructose was investigated by a kinetic model based on six functional parameters having a well-defined chemical-physical meaning (Berthels et al., 2008; Zinnai et al, 2013). When a reduced amount of ethanol was dissolved in the reaction medium, the time evolution of the fermentation rates of these two sugars did not differ significantly, diversifying rather sensibly when the alcoholic concentration increased. The mathematical model accounted for this particular kinetic behaviour. In fact, only the sensitivity to ethanol showed by the enzyme involved in the limiting step of the fermentation process of these two sugars changed significantly, with the enzymatic transformation of D-fructose being more sensitive to ethanol than D-glucose. This difference was able to justify the kinetic behaviours shown by the two sugars when the ethanol concentration in the reaction medium increased.
The kinetic behaviour shown by S. bayanus during alcoholic fermentation was investigated using a mathematical model previously tested for S. cerevisiae (Zinnai et al, 2013) in order to find evidence for the kinetic differences between these two strains, to better understand why and when the addition of S. bayanus might be able to convert the residual fraction of sugars (mainly D-fructose) that S. cerevisiae was not able to ferment.
MATERIALS AND METHODS
The kinetic runs were carried out at 27.0 ± 1.5°C, using a 500 mL batch reactor. To ensure anaerobic and sterilised conditions, the entire experimental apparatus was autoclaved and subjected to three cycles of vacuum, following by replacement with nitrogen sterilised by filtration. Thus, the presence of undesired microorganisms and the aerobic utilisation of sugars by yeasts were ruled out.
The characteristics of this bioreactor, housed at the Department of Agriculture, Food and Environment of the University of Pisa, were reported in a previous paper (Andrich et al., 1988). Briefly, the bioreactor was formed by a three bottle-neck flask with a central neck joined to a bubble cooling column. A lateral neck was joined to a suitable apparatus that allowed the sampling of homogenous reaction medium aliquots under sterile and reduced conditions obtained by overpressures of N2 previously sterilised by filtration. A second lateral neck was used to inoculate S. bayanus. The fermentation temperature was maintained constant by a heat exchanger, whereas the homogeneity of the reaction medium was ensured by a magnetic stirrer. The bioreactor was initially filled with 250 mL of a citrate buffer aqueous solution (pH 3.4) containing D-glucose and/ or D-fructose (at five different concentrations: 100, 150, 200, 250 and 300 g/L), added or not with 77 or 84 mL/L of ethanol respectively, and sterilised by filtration. To the reaction medium containing only buffer and sugars (and ethanol when added), about 1.6 g (6.4 g/L) of a lyophilised yeast commercial strain (S. bayanus Actiflore Bayanus source BO213, Laffort Oenologie) were added directly to ensure a number of colony-forming units (CFU), ranging from 1010 to 1011. As widely reported in the literature, many of the essential nutrients are supplied by the fraction of dead cells present in the lyophilised product added to the medium. This addition represented the initial time of all kinetic determinations.
The time evolution ofboth the CFU and the concentrations of both reagents (D-glucose and/or D-fructose) and their products (glycerol and ethanol) was evaluated by a total plate count (WL agar added with 250 μg/mL of chloramphenicol) and by utilising specific commercial enzymatic kits (Megazyme) respectively (Zinnai et al, 2011).
The identification of the best values to be assigned to the model parameters was carried out by the statistical program BURENL (Buzzi Ferraris & Manca, 1996), which is able to identify in a space of j-dimensions (where j is equal to the number of model parameters) the minimum value of the F function, which is given by the sum of squares of differences occurring among experimental (Yi, exper) and calculated (Yi,calc) data:
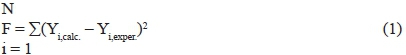
where N represents the total number of experimental determinations. The values assumed by the model parameters at the minimum of the F function represent the best values.
For each experimental run the calculation of the three parameters related to the time evolution of the yeast cells (kY, kinetic constant of yeast population inactivation; [Y]t=0, yeast density at the initial run time; KY.E, constant related to the equilibrium occurring between alcoholic yeasts and ethanol) was carried out using the experimental data deriving from the determination of the microbial density. To evaluate the kinetic constants related to the time evolution of the hexose under investigation ([H]t = 0, concentration of hexose initially added to the reaction medium; kH, specific kinetic activity shown by a single cell; KH . E, constant related to the equilibrium occurring between ethanol and the enzymatic protein (Penz.) involved in the rate-limiting step of sugar fermentation), the experimental data concerning the decrease in hexose (D-glucose) and both ethanol and glycerol accumulations were used.
RESULTS AND DISCUSSION
The kinetics of sugar utilisation by S. bayanus during fermentation is largely driven by sugar transport (Schutz & Gafner, 1995; Diderich et al., 1999; Dumont et al., 2008). According to the literature, the ability shown by the yeast population to metabolise the two sugars depends on the temperature and the composition of the culture media (sugar level, D-glucose to D-fructose ratio, as well as yeast-assimilable nitrogen) (Salmon, 1989). In particular, the synthesis of proteins involved in the transport of sugars into the cell deeply affects their subsequent utilisation (Diderich et al., 1999).
During winemaking, sugars are consumed mainly during the stationary phase, when nitrogen gradually becomes less available. Since nitrogen is an essential nutrient involved in the transport of sugars into the cell via protein synthesis, and this could partially explain why both yeast replication and fermentation activity slowed down (Salmon, 1989; Sablayrolles et al., 1996; Guillaume et al., 2007). Differently from what was previously found for S. cerevisiae (Zinnai et al., 2013), only a small decrease in the active population of the commercial strain of S. bayanus was observed. Only when the increase in alcohol level became significant could a notable reduction of yeast cells be found.
To avoid yeast replication in the various experimental conditions from significantly affecting the rate of sugar consumption, a high concentration of lyophilised yeasts (6.2 g/L compared to the 0.2 g/L suggested by the manufacturer) was initially added to the reaction medium without any preventive rehydration. Thus, the lack of oxygen and, above all, the absence of essential nutrients prevented any possible increase in the microbial population, while the high CFU number ensured a significant conversion of the sugars added. The absence of a sigmoidal evolution of the experimental data related to sugar consumption validates the previous statement. This procedure was adopted to show whether ethanol accumulation would be able to explain the different rates of utilisation of the two sugars.
According to the stoichiometry of alcoholic fermentation, the sum of the analytical data related to the concentrations of unconverted sugars, accumulated glycerol and half of the ethanol formed did not vary significantly with time, assuming values very close to the initial concentration of sugar used. As a consequence, a possible significant accumulation of a different intermediate reaction can be ruled out.
The analytical points describing the decrease in concentrations of the two monosaccharides (D-glucose and D-fructose) as a function of fermentation time when initial concentrations of 200 g/L (1 111 mmol/L) were used are reported in Fig. 1A. Contrary to what was observed for S. cerevisiae (Zinnai et al., 2013), the catabolismi rate of D-fructose was higher than that of D-glucose, and the complete transformation of this sugar was reached long before that of D-glucose.
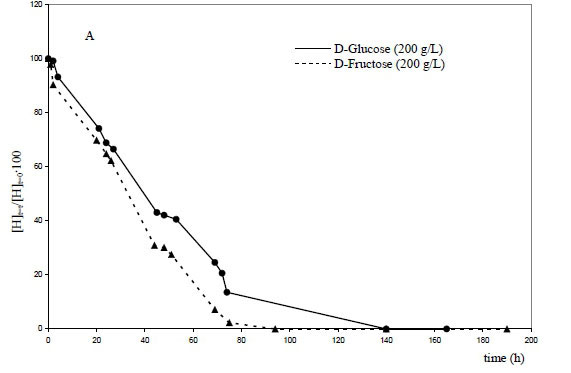
The same evolution can be highlighted when an initial concentration of 300 g/L (1 667 mmol/L) of the two sugars was tested (Fig. 1B). If the catabolismi rate of D-fructose was significantly higher than D-glucose during the initial phase, when the fermentation time increased (t > 350 hours) and the ethanol concentration increased, D-fructose catabolism became slower than that of D-glucose.
When 67 g/L (1 455 mmol/L) of ethanol were initially added to 200 g/L (1 111 mmol/L) of the two sugars (Fig. 2), a completely different situation was obtained. Similarly to what was already found for S. cerevisiae (Zinnai et al., 2013), the D-glucose catabolismi rate was always higher than that observed for D-fructose, and the concentration reached an asymptotic minimum value with about 30% of the initial value remaining unconverted in the reaction medium. When a considerable amount of ethanol (135 g/L) accumulated in the reaction medium, the fermentation rate of D-glucose also decreased strongly to reach an asymptotic minimum value of less than 20% of the initial value.
The same mathematical model developed to investigate S. cerevisiae (Zinnai et al., 2013) was used to characterise the kinetic behaviour of S. bayanus, and to identify which of the six functional parameters involved in the model changed with the yeast population used.
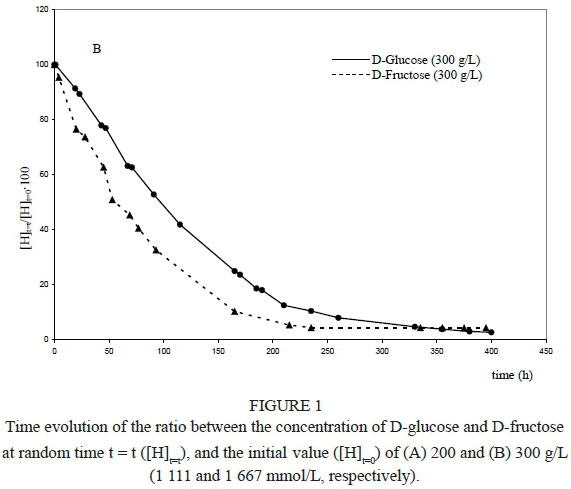
To describe the time evolution of the density of the yeast active fraction ([Y]t=t = CFU/mL), as well as the decrease of hexose concentration and the accumulation of both ethanol and glycerol, the numerical integration of the following system of three kinetic equations (eq. 2, 3 and 4) was carried out:
where [Y*]t=t represents the density of the yeast cells still active in the alcoholic medium, α' E is the fraction of hexose converted to ethanol (selectivity to ethanol), and ([H]t=0 -[H]t=t) is the amount of sugar converted at the reaction time t = t. According to the stoichiometry of this fermentation, two moles of alcohol are produced from every unit of hexose converted, and the amount of ethanol produced can be calculated easily:

To describe the decrease in hexose concentration and the accumulation of both ethanol and glycerol with time, the numerical integration of the mathematical relations introduced was carried out, and the following sequence of equations involved in the iterative calculation was identified:
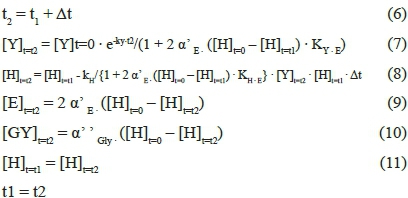
where [Y]t=t is the density of the yeast viable cells able to promote hexose fermentation that are present in a litre of fermentation medium at a random time t = t (CFU/L), [Y]t=0 is the density of the yeast viable cells initially (t = 0) present in a litre of fermentation medium (CFU/L), kY is the kinetic constant related to yeast inactivation (per h), t is the reaction time, α'E is the hexose fraction converted to ethanol, [H]t=0 is the sugar concentration initially (t = 0) present in th in the reaction medium at a random time t = t (mmol/L), KYE is the constant related to the equilibrium occurring between ethanol and the alcoholic yeasts (L-mmol-1), kH is the kinetic constant related to hexose conversion (h-1 L CFU-1), KH-E is the constant related to the equilibrium occurring between ethanol and the enzymatic protein involved in the limiting step of sugar fermentation (L/mmol), and a' ' Gly is the hexose fraction converted to glycerol. Thus, knowing the initial conditions (t l = 0; [Y]M = [Y]M; [H]M = [H]t=o), it is possible to determine the evolution with fermentation time of all the involved components ([Y]t=t, [H]t=t, [E]t=t and [G]t=t).
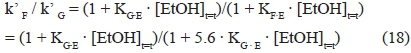
The identification of the best values to assign to the eight functional parameters involved in the proposed kinetic model was carried out using the experimental data describing the time course of the yeast population ([Y]t=t), hexose consumption ([H]t=t) as well as ethanol ([E]t=t) and glycerol ([Gly]t=t) accumulation (Figs 3 and 4). The values of the eight functional parameters calculated by BURENL are reported in Table 1 as a function of the hexose utilised and of its initial concentration.
Although the kinetic constant related to the time evolution of the yeast population (ky) was not affected by a relevant variability, the squares of the correlation coefficients of the microbial evolution (r2 Y) showed a remarkable variation, ranging from 0.01 to 0.97 (Table 1). As described above, the number of yeast cells did not change significantly during the experimental runs, and this is the main reason for the low values sometimes assumed by the squares of correlation coefficients (r2 Y). On the other hand, the high values assumed by the squares of correlation coefficients (r2G, r2F, r2E and r2Gly) related to the time evolution of D-glucose, D-fructose, ethanol and glycerol concentrations (Table 1), confirm the suitability of the kinetic equations and of the model used to describe the kinetic behaviour of S. bayanus.
The kinetic constants representing the time evolution of the yeast population (kY) did not change significantly as a function of the monosaccharide used (Table 1), and showed a similar sensitivity to ethanol (compare the values of the KY.E constant). A very slight decrease in the yeast population was observed in all runs. Also, the kinetic constants related to the fermentation rates of the two sugars (kG and kF) did not vary significantly and assumed very similar values. As predicted, the production of ethanol (α' E) and glycerol (α' 'Gly) did not change with the fermentation substrate. Only the sensitivity to ethanol showed by the enzymatic protein involved in the limiting steps of the two sugars changed significantly, with the enzymatic transformation of D-fructose being more sensitive to ethanol than D-glucose. Thus, the mathematical model was able to justify the different time evolutions shown by the two sugars, as demonstrated by the high degree of overlap between the experimental and calculated values (Fig. 3), and by the high values (Table 1) of the squares of correlation coefficients (r2G, r2F r2E and r2 ) connected to the reagents and products.
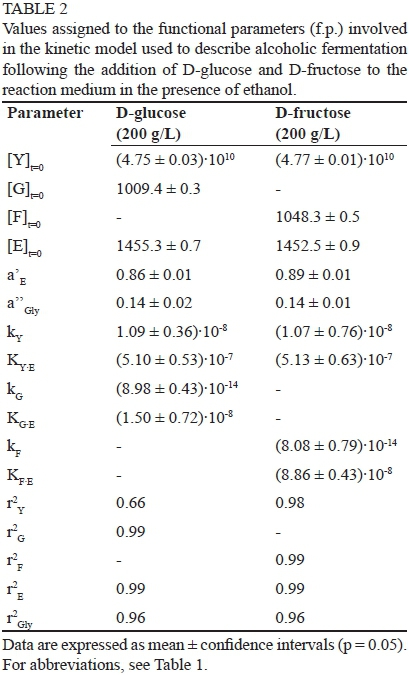
To verify how the presence of ethanol in the reaction medium can justify the dissimilar experimental behaviours shown by the two monosaccharides, ethanol was initially added to the aqueous solution of the two sugars (60.6 and 61.1 mL/L, 1040 and 1050 mmol/L for D-glucose and D-fructose respectively). Table 2 reports the values calculated for the model parameters when yeasts were added toan aqueous solution containing ethanol.
The evolution with fermentation time of the reagents and products are shown in Fig. 4, and the good degree of overlap between the calculated and experimental values gives a measure of the capacity shown by the model to describe the time evolution of reagents and products, also when the alcoholic fermentation waspromoted by S.bayanus dissolved in the ethanol-water solution.
Moreover, the high values of the squares of correlation coefficients confirm the suitability of the mathematical model to describe the time evolution of the species involved in the fermentation process, also when ethanol was initially added to the reaction medium. The parameters related to yeast evolution (kY and KY.E) and those connected to the conversion of the two sugars (kG, KG.E, kF and KF.E) did not vary significantly from the ones shown in Table 1. Ethanol addition was able to modify the kinetics of D-fructose and D-glucose immediately after its addition, when the replication rate of the yeast cells can be disregarded.
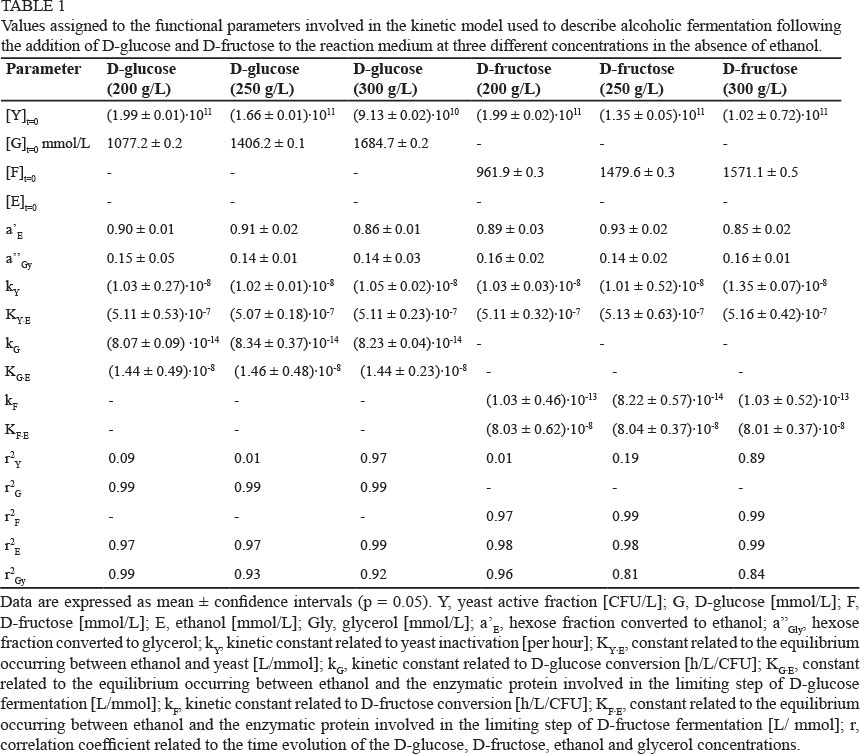
Table 3 reports the mean values of the parameters involved in the kinetic model calculated by the elaboration of the experimental runs described previously. While the values represent the average of eight data for the first four parameters (α' E, α' ' Gly, kY KYE), the last two (KGE, KFE), which are strongly related to the monosaccharide initially added to the reaction medium, are the average of only four values.
Similarly to what was already reported for S. cerevisiae (Zinnai et al., 2013), for S. bayanus the two kinetic constants kG and kF also did not differ significantly as a function of the sugar utilised (Tables 1 and 2). When reduced values of ethanol concentrations were present in the reaction medium, the limiting step of both monosaccharides was essentially the same, being connected to one of the sugar fermentation reactions. Only when the concentration of ethanol in the reaction increased significantly did its effect on the transformation rates of these two sugars became more relevant.
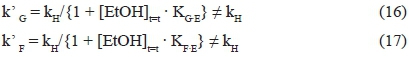
The hypothesised mathematical model accounts for this particular kinetic behaviour. In fact, the kinetic constants related to D-glucose (k' G) and D-fructose (k' F) conversions are equal to the ratio between a constant kH connected to the limiting step common to the two sugars, and the sum of 1 and the concentration of ethanol multiplied by a constant, the value of which varies as a function of the monosaccharide:
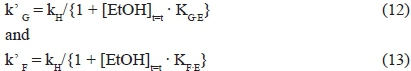
At low ethanol concentrations (1 + [EtOH]t=t · Kg.e ~ 1), the rate-limiting steps of the two sugars coincide, and the following situation occurs:
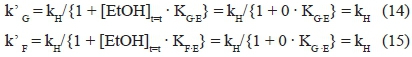
Thus, according to what was found experimentally, k'G = k'F =kH.
In contrast, when ethanol concentration increases, the rate-limiting steps related to the transformations of the two sugars differs to assume dissimilar values:
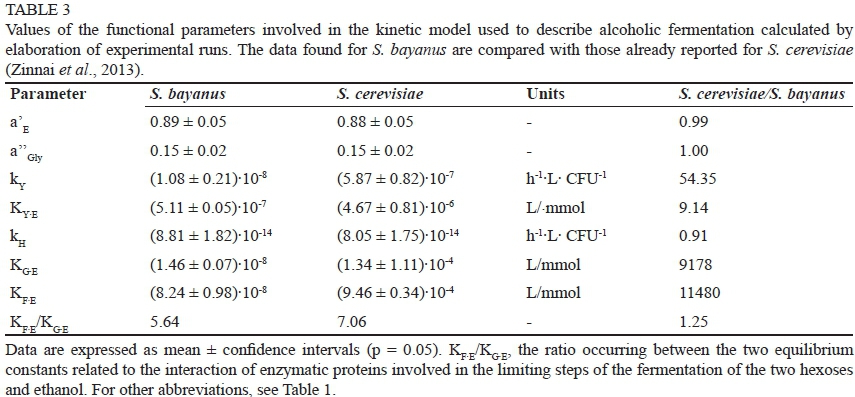
Moreover, as the KF·Econstant is greater than the one related to D-glucose (KFE/KGE = 8.24·10-8/1.46·10-8 ~ 5.6), the ratio between the two kinetic constants
will decrease when the concentration of ethanol increases, and thus with fermentation time.
The mean values of the model parameters (Table 3) were used to calculate the theoretical evolution of the components involved in an experimental run, during which active cells of the commercial strain of S. bayanus were added to i) an aqueous solution containing equivalent amounts of the two sugars (density of active cells ~ 1.5-1011 CFU/L, D-glucose ~ 133 g/L and D-fructose ~ 148 g/L), and ii) an ethanol-water solution (~ 8.1% ethanol v/v) of the two sugars (density of active cells ~ 5.3-1010 CFU/L, D-glucose ~ 94 g/L and D-fructose ~ 86 g/L). The evolution with time of the experimental and calculated points are shown in Figs 5A and 5B respectively. The high degree of overlap and the high values of the squares of the correlation coefficients of the three species involved (r2G = 0.97, r2F = 0.97 and r2E = 0.98 for the first run; r2G = 0.98, r2F = 0.99 and r2E = 0.99 for the second) give a measure of the suitability of the kinetic model, which could be effectively used to describe the time evolution of reagents and products involved in the alcoholic fermentation promoted not only by S. cerevisiae, but also by S. bayanus.
According to Figs 1A and 1B, the time evolution of the concentrations of the two sugars did not vary substantially in the presence of reduced ethanol concentrations (Fig. 5A). In fact, the difference occurring between D-fructose and D-glucose assumed a constant value during the fermentation time, showing nearly parallel trends. But the time conversions of the two sugars were slightly different when a relevant amount of ethanol was initially added to the reaction medium (Fig. 5B), confirming what has already been mentioned (Fig. 2).
To allow a direct comparison between the two yeast populations, the mean values of the model parameter previously found for S. cerevisiae (Zinnai et al., 2013) are reported in Table 3, together with the ratios occurring between the values assumed by the same model parameter but calculated for the two yeast populations tested (S. cerevisiae/S. bayanus). Although some model parameters (α' E and α' ' namely hexose fractions converted to ethanol and glycerol respectively) did not change as a function of the yeast population (Table 3), the kinetic constant kY related to their inactivation assumed for S. cerevisiae a value higher than that found for S. bayanus (KY,S. cerevisiae/KY,S bayanus ~ 54) with the inactivation rate of S. bayanus being about ten times less affected by ethanol accumulation than that of S. cerevisiae (Table 3).
Although no remarkable differences could be found between the ability shown by the two yeast populations to convert hexoses (KH,S.cerevisiae/KH,S.bayanus~ 0.9, Table 3), thetolerance towards ethanol accumulation in the reaction medium varied strongly, with S. bayanus much less affected by ethanol than S. cerevisiae (KG.E,S.cerevisiae/KG.E,S.bayanus ~ KF.E,S.cerevisiae/KF.E,S.bayanus ~Table 3). The sensitivity to ethanol shown by S. cerevisiae was ten thousand times higher than that found for S. bayanus. This largely justifies the addition during winemaking of S. bayanus, a microbial population that is able to solve slow or stuck fermentations, and to promote a significant conversion of D-fructose accumulated in the reaction medium when the fermentation conditions become incompatible with S. cerevisiae.
At low ethanol concentrations, the rates of the two sugar conversions did not differ significantly, but the catabolismi rate of D-glucose became faster than that of D-fructose when alcoholic concentration increased, because the conversion of D-fructose is affected more by ethanol than that of D-glucose. This phenomenon is confirmed by the ratio occurring between the two constants related to the equilibrium between ethanol and the enzymatic protein involved in the limiting step of the conversions of the two sugars (KF·E,Sbayanus/KG.E,Sb ~ 5.6, Table 3), a value not so different from that previously found for S. cerevisiae (KF.E,S cerevisiae /KG.E.S cerevisiae ~ 7.1, Table 3).
The comparison between the values assumed by the kinetic parameters confirms what is reported in the literature (Naumov et al., 2000; Belloch et al., 2008), namely that S. bayanus is significantly less sensitive to ethanol than S. cerevisiae (about ten thousand-fold less), so that the addition of S. bayanus represents a viable procedure to solve slow and stuck fermentations, and to complete the fermentative processes unfinished by S. cerevisiae.
LITERATURE CITED
Aguilera, F., Peinado, R.A., Millan, C., Ortega, J.M. & Mauricio, J.C., 2006. Relationship between ethanol tolerance, H+-ATPase activity and the lipid composition of the plasma membrane in different wine yeast strains. Int. J. Food Microbiol. 110, 34-42. [ Links ]
Alexandre, H., Ansanay-Galeote, V., Dequin, S. & Blondin, B., 2001. Global gene expression during short-term ethanol stress in Saccharomyces cerevisiae. FEBS Lett. 498, 98-103. [ Links ]
Andrich, G., Casella, S., Fiorentini, R. & Spettoli, P., 1988. A tentative model to evaluate the kinetics of malolactic fermentation. Ann. NY Acad. Sci. 542, 356-359. [ Links ]
Bauer, F.F. & Pretorius, I.S., 2000. Yeast stress response and fermentation efficiency: How to survive the making of wine - A review. S. Afr. J. Enol. Vitic. 21, 27-51. [ Links ]
Belloch, C., Orlic, S., Barrio, E. & Querol, A., 2008. Fermentative stress adaptation of hybrids within the Saccharomyces sensu stricto complex, Int. J. Food Microbiol. 122, 188-195. [ Links ]
Berthels, N.J., Cordero Otero, R.R., Bauer, F., Pretorius, I.S. & Thevelein, J.M., 2008. Correlation between glucose/fructose discrepancy and hexokinase kinetic properties in different Saccharomyces cerevisiae wine yeast strains. Appl. Microbiol. Biotech. 77, 1083-1091. [ Links ]
Brown, S.W. & Oliver, S.G., 1982. The effect of temperature on the ethanol tolerance of the yeast Saccharomyces uvarum. Biotechnol. Lett. 4, 269-274. [ Links ]
Buzzi Ferraris, G. & Manca, D., 1996. BURENL. Politecnico, Dipartimento di Ingegneria Chimica 'G. Natta', Milan. [ Links ]
Carmelo, V., Santos, H. & Sa-Correia, I., 1997. Effect of extracellular acidification on the activity of plasma membrane ATPase and on the cytosolic and vacuolar pH of Saccharomyces cerevisiae. Biochim. Biophys. Acta. 1325, 63-70. [ Links ]
Costa, V., Reis, E., Quintanilha, A. & Moradas-Ferreira, P., 1993. Acquisition of ethanol tolerance in Saccharomyces cerevisiae: The key role of the mitochondrial superoxide dismutase. Arch. Biochem. Biophys. 300, 608-614. [ Links ]
Deutschbauer, A.M., Jaramillo, D.F., Proctor, M., Kumm, J., Hillenmeyer, M.E., Davis, R.W., Nislow, C. & Giaever, G., 2005. Mechanisms of haploinsufficiency revealed by genome-wide profiling in yeast. Genetics 169, 1915-1925. [ Links ]
Diderich, J.A., Teusink, B., Valkier, J., Anjos, J., Spencer-Martins, I., Van Dam, K. & Walsh, M.C., 1999. Strategies to determine the extent of control exerted by glucose transport on glycolytic flux in the yeast Saccharomyces bayanus. Microbiology 145, 3447-3454. [ Links ]
Dumont, A., Rayanal, C., Raginel, F. & Ortiz-Julien, A., 2008. La capacite de consommation du fructose par les levures oenologique. La Revue des Oenologues 129, 15-18. [ Links ]
Emparan, M., Simpson, R., Almonacid, S., Teixeira, A. & Urtubia, A., 2012. Early recognition of problematic wine fermentations through multivariate data analyses. Food Control 27, 248-253. [ Links ]
Fernandes, A.R., Durao, P. J., Santos, P.M. & Sa-Correia, I., 2003. Activation and significance of vacuolar H+-ATPase in Saccharomyces cerevisiae adaptation and resistance to the herbicide 2,4-dichlorophenoxyacetic acid. Biochem. Biophys. Res. Commun. 312, 1317-1324. [ Links ]
Fujita, K., Matsuyama, A., Kobayashi, Y. & Iwahashi, H., 2006. The genome-wide screening of yeast deletion mutants to identify the genes required for tolerance to ethanol and other alcohols. FEMS Yeast Res. 6, 744-750. [ Links ]
Gibson, B.R., Lawrence, S.J., Leclaire, J.P., Powell, C.D. & Smart, K.A., 2007. Yeast responses to stresses associated with industrial brewery handling. FEMS Microbiol. Rev. 31, 535-569. [ Links ]
Guillaume, C., Delobel, P., Sablayrolles, J.M. & Blondin, B., 2007. Molecular basis of fructose utilization by the wine yeast Saccharomyces cerevisiae: A mutated HXT3 allele enhances fructose fermentation. Appl. Environ. Microbiol. 73, 2432-2439. [ Links ]
Hirasawa, T., Yoshikawa, K., Nakakura, Y., Nagahisa, K., Furusawa, C., Katakura, Y., Shimizu, H. & Shioya, S., 2007. Identification of target genes conferring ethanol stress tolerance to Saccharomyces cerevisiae based on DNA microarray data analysis. J. Biotechnol. 131, 34-44. [ Links ]
Hohmann, S., 2002. Osmotic stress signaling and osmoadaptation in yeasts. Microbiol. Mol. Biol. Rev. 66, 300-372. [ Links ]
Înal, M. & Yiğitoğlu, M., 2012. Improvement of bioethanol productivity of immobilized Saccharomyces bayanus with using sodium alginate-graft-poly (N-vinyl-2-pyrrolidone) matrix. Appl. Biochem. Biotechnol. 168, 266-278. [ Links ]
Jones, G.V., White, M.A., Cooper, O.R. & Storchmann, K., 2005. Climate change and global wine quality. Climatic Change 73, 319-343. [ Links ]
Klis, F.M., Mol, P., Hellingwerf, K. & Brul, S., 2002. Dynamics of cell wall structure in Saccharomyces cerevisiae. FEMS Microbiol. Rev. 26, 239-256. [ Links ]
Kubota, S., Takeo, I., Kume, K., Kanai, M., Shitamukai, A., Mizunuma, M., Miyakawa, T., Shimoi, H., Iefuji, H. & Hirata, D., 2004. Effect of ethanol on cell growth of budding yeast: Genes that are important for cell growth in the presence of ethanol. Biosci. Biotechnol. Biochem. 68, 968-972. [ Links ]
Loureiro, V. & Malfeito-Ferreira, M., 2003. Spoilage yeasts in the wine industry. Int. J. Food Microbiol. 86, 23-50. [ Links ]
Mira, N.P., Lourenco, A.B., Fernandes, A.R., Becker, J.D. & Sa-Correia, I., 2009. The RIM101 pathway has a role in Saccharomyces cerevisiae adaptive response and resistance to propionic acid and other weak acids. FEMS Yeast Res. 9, 202-216. [ Links ]
Naumov, G.I., Masneuf, I., Naumova, E.S., Aigle, M. & Dubourdieu, D., 2000. Association of Saccharomyces bayanus var. uvarum with some French wines: Genetic analysis of yeast populations. Res. Microbiol. 151, 683-691. [ Links ]
Nozawa, A., Takano, J., Kobayashi, M., Von Wiren, N. & Fujiwara, T., 2006. Roles of BOR1, DUR3, and FPS1 in boron transport and tolerance in Saccharomyces cerevisiae. FEMS Microbiol. Lett. 262, 216-222. [ Links ]
Pulvirenti, A., Nguyen, H., Caggia, C., Giudici, P., Rainieri, S. & Zambonelli, C., 2000. Saccharomyces uvarum, a proper species within Saccharomyces sensu stricto. FEMS Microbiol. Lett. 192, 191-196. [ Links ]
Querol, A. & Bond, U., 2009. The complex and dynamic genomes of industrial yeasts. FEMS Microbiol. Lett. 293, 1-10. [ Links ]
Ribereau-Gayon, P., Dubourdier, D., Doneche, B. & Lonvaud, A., 2005. Handbook of oenology, vol 1. The microbiology of wine and vinifications. John Wiley and Sons, West Sussex. [ Links ]
Rosa, M.F. & Sa-Correia, I., 1996. Intracellular acidification does not account for inhibition of Saccharomyces cerevisiae growth in the presence of ethanol. FEMS Microbiol. Lett. 135, 271- 274. [ Links ]
Sablayrolles, J.M., 2009. Control of alcoholic fermentation in winemaking: Current situation and prospect. Food Res. Int. 42, 418-424. [ Links ]
Sablayrolles, J.M., Dubois, C., Manginot, C., Roustan, J.L. & Barre, P., 1996. Effectiveness of combined ammoniacal nitrogen and oxygen additions for completion of sluggish and stuck wine fermentations. J. Ferment. Bioeng. 82, 377-381. [ Links ]
Salmon, J.M., 1989. Effect of sugar transport inactivation in Saccharomyces cerevisiae on sluggish and stuck oenological fermentations. Appl. Environ. Microbiol. 55, 953-958. [ Links ]
Schubert, C., 2006. Can biofuels finally take center stage? Nat. Biotechnol. 24, 777-784. [ Links ]
Schutz, M. & Gafner, J., 1995. Lower fructose uptake capacity of genetically characterized strains of Saccharomyces bayanus compared to strains of Saccharomyces cerevisiae: A likely cause of reduced alcoholic fermentation activity. Am. J. Enol. Vitic. 46, 175-180. [ Links ]
Serra, A., Strehaiano, P. & Taillandier, P., 2005. Influence of temperature and pH on Saccharomyces bayanus var. uvarum growth; impact of a wine yeast interspecific hybridization on these parameters. Int. J. Food Microbiol. 104, 257-265. [ Links ]
Tronchoni, J., Gamero, A., Arroyo-Lopez, F.N., Barrio, E. & Querol, A., 2009. Differences in the glucose and fructose consumption profiles in diverse Saccharomyces wine species and their hybrids during grape juice fermentation. Int. J. Food Microbiol. 134, 237-243. [ Links ]
Urtubia, A., Hernandez, G. & Roger, J.M., 2012. Detection of abnormal fermentations in wine process by multivariate statistics and pattern recognition techniques. J. Biotechnol. 159, 336-341. [ Links ]
Van Uden, N., 1985. Ethanol toxicity and ethanol tolerance in yeasts. Ann. Rep. Ferment. Process. 8, 11-58. [ Links ]
Viegas, C.A., Rosa, M.F., Sa-Correia, I. & Novais, J.M., 1989. Inhibition of yeast growth by octanoic and decanoic acids produced during ethanolic fermentation. Appl. Environ. Microbiol. 55, 21-28. [ Links ]
Zinnai, A., Venturi, F., Quartacci, M.F. & Andrich, G., 2011. A mathematical model to describe malolactic fermentation. Ital. J. Food Sci. 23, 80-89. [ Links ]
Zinnai, A., Venturi, F., Sanmartin, C., Quartacci, M.F. & Andrich, G., 2013. Kinetics of D-glucose and D-fructose conversion during the alcoholic fermentation promoted by Saccharomyces cerevisiae. J. Biosci. Bioeng. 115, 43-49. [ Links ]
Submitted for publication: September 2013
Accepted for publication: March 2014
* Corresponding author: Gianpaolo Andrich, e-mail address: gianpaolo.andrich@unipi.it [Tel.: +39 050 2216624; fax: +39 050 2216636]
