


Services on Demand
Article
 English (pdf)
 Article in xml format
 Article references
Indicators

Related links
-
 Cited by Google
 -
 Similars in Google
Share

 Permalink
South African Journal of Industrial Engineering
On-line version ISSN 2224-7890
Print version ISSN 1012-277X
S. Afr. J. Ind. Eng. vol.34 n.4 Pretoria Dec. 2024
http://dx.doi.org/10.7166/34-4-2981
GENERAL ARTICLES
Monitoring for cracks in metal L-PBF using gas-borne acoustic emission
K. MooreI, ; D. KouprianoffI; D. LouwII; I. YadroitsavaI; I. YadroitsevI
IDepartment of Mechanical and Mechatronics Engineering, Faculty of Engineering, Central University of Technology, Bloemfontein, South Africa
IINational Laser Centre, Council for Scientific and Industrial Research, Pretoria, South Africa
ABSTRACT
Delaminations and cracks are detrimental phenomena that hinder the quality of the final product in metal additive manufacturing. The effective use of other online monitoring systems that can detect these deformations and delaminations during the manufacturing process is currently being developed and implemented in practice. In this paper, gas-borne acoustic emission is used to show that cracks/delaminations that occur during the metal laser powder bed fusion build process can be detected and distinguished from other machine noise. The peaks in the amplitude of the signal emitted in the time domain could be used to indicate the occurrence of cracks during the build process. The frequency characteristics of the signal could also clearly indicate the occurrence of the macro cracks and differentiate between the signals from the cracks and the machine noise.
OPSOMMING
Delaminasies en krake is nadelige verskynsels wat die kwaliteit van die finale produk in die vervaardiging van metaal byvoeg vervaardiging belemmer. Die doeltreffende gebruik van ander aanlyn moniteringstelsels wat hierdie vervormings en delaminasies tydens die vervaardigingsproses kan opspoor, word tans ontwikkel en in die praktyk geïmplementeer. In hierdie artikel word gasgedraagde akoestiese emissie gebruik om te wys dat krake/delaminasies wat tydens die vervaardigingsproses voorkom, opgespoor en van ander masjiengeraas onderskei kan word. Die pieke in die amplitude van die sein wat in die tyddomein uitgestuur word, kan gebruik word om die voorkoms van krake tydens die bouproses aan te dui. Die frekwensie-eienskappe van die sein kan ook duidelik die voorkoms van die makrokrake aandui en onderskei tussen die seine van die krake en die masjiengeraas.
1. INTRODUCTION
Laser powder bed fusion (L-PBF) is an additive manufacturing method that is commonly used for both the prototyping and the production of polymer and metal parts. Rapid heating and cooling cycles during the L-PBF building process induce residual stresses that result in deformations and cracks in the built parts [1,2]. These defects hinder the quality assurance of the final part, contributing to the need for quality control measures. Various destructive and non-destructive testing (NDT) methods currently exist for the purpose of quality control. Online monitoring is an NDT method that can monitor the build process in detail [3]. Acoustic emission (AE) is an effective real-time monitoring NDT method that is used to monitor the stress waves propagated by a sudden redistribution of the stress in the material [4]. The use of AE monitoring for the in situ detection of cracks, pores, balling, and keyhole phenomena during the metal additive manufacturing process has been investigated by other authors [5,6,7,8]. The promising capabilities of integrating AE with machine learning for the in situ monitoring of laser welding processes was shown in the work of Wasmer et al. [9].
In this study, the time and frequency domain characteristics of the recorded gas-borne AE signal were used to monitor the macro cracks that form during the L-PBF build process of a Ti6Al4V cantilever [10]. The amplitude peaks were used to analyse the signal in the time domain, and the fast Fourier transform (FFT) and the short-time Fourier transform (STFT) were applied to analyse the frequency content of the signal [11]. This paper focuses on detecting cracks using the amplitudes of the gas-borne AE signal during the metal laser powder bed fusion build process and distinguishing them from other machine noise.
2. METHODOLOGY
The experiments were carried out using the EOSINT M280 L-PBF machine with pre-assigned EOS Ti6Al4V extra low interstitial (ELI) powder process parameters and a layer thickness of 30 µm. A model 378B02 ICP microphone with an optimal frequency range of 3.75 - 20 000 Hz (± 2dB) was placed 240 mm above the substrate in the building chamber, directed at the centre of the build plate (Figure 1a). A NI9250 DAQ soundcard and LabVIEW 2022 software were used to record and analyse the gas-borne AE signals during the build process of the cantilevers that were designed to fail in situ [10] (Figure 1b). The cantilevers were built on a reduced grade 5 Ti build plate with dimensions of length and width 50 x 50 mm. A sampling frequency of 102.4 kHz was used to acquire AE data, as this frequency was indicated to be in accordance with the Nyquist criterion [5]. To test the capabilities of the AE equipment to detect cracking during the build process, four cantilevers were placed at the centre of the build plate, as shown in Figure 1c. The expected failure tip (Figure 1b) of the cantilever specimen was placed facing opposite the recoater arm direction to avoid damage to the recoater when the specimen failed with the build plate. The entire construction process was recorded until all four specimens had failed with the construction plate, which was indicated by the dispersion of the powder at the tip of the specimen; this failure height was then noted. The cool-down process of the cantilever specimen was also recorded after the build process had stopped. Only two cracks per cantilever specimen were considered: the crack that had occurred during the construction stages of the cantilever when the laser was scanning and the recirculating fan was operating, and the crack that had occurred when the construction process had been stopped, in the cool-down phase of the cantilevers when the laser was not scanning and the recirculating fan was not operating.
The occurrences of these cracks were then labelled according to the number of specimens and the sequence of the cracks - that is, crack-S1 -C2 denotes the second crack that had occurred to specimen 1. The features of the signal were analysed in both the time and the frequency domains, where a 2 kHz highpass filter was applied to filter out some of the machine noise [5]. Only data from the AE recording of (1) the recoater arm movement, (2) the laser scanning, (3) the laser scanning with the occurrence of crack(s), and (4) the event of the occurrence of crack(s) were analysed.
3. RESULTS AND DISCUSSION
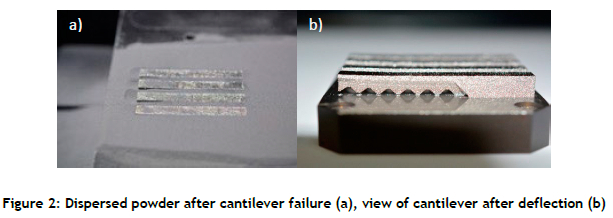
The failure of the cantilever(s) with the build plate was observed by the powder being dispersed owing to the progression of the cracks that were caused by the residual stresses induced during the build process (Figure 2). The cantilevers were seen to fail twice with the build plate: once during the build process, and again when the build had been stopped in the cool-down phase of the cantilevers.
3.1. Time-domain AE features
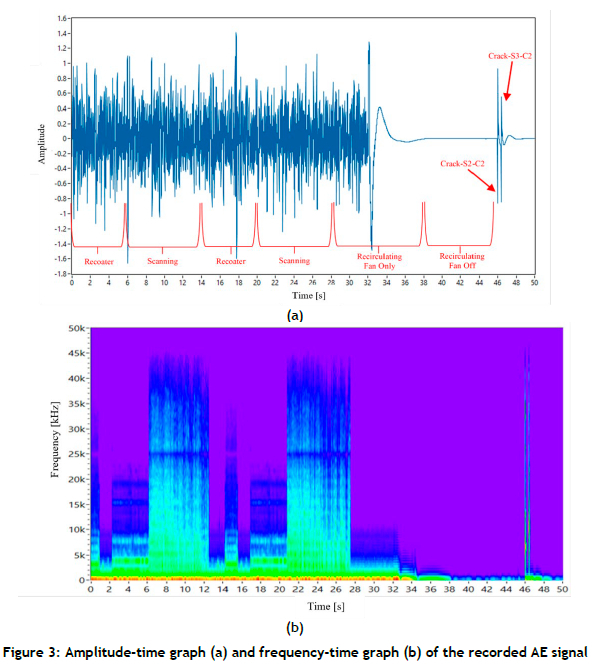
The segment extracted for the last two layers of the AE signal in the time domain is shown in Figure 3a. The corresponding STFT can be seen in Figure 3b. In the signal, the recoater arm movement, the laser scanning, the recirculating fan running, and the two cracks that occurred when the recirculating fan was off because the build process was stopped are shown and labelled. Looking at the amplitudes of the signal in the time domain, the machine-related noise such as the laser scanning, the recoater arm movement, and the recirculating fan running was seen to be difficult to identify and differentiate. The only noticeable AE signals in this domain were those of the recirculating fan turning off and the cantilever cracks of crack-S2-C2 and crack-S3-C2. The aforementioned cracks occurred when the laser was not scanning in the cool-down phase of the cantilevers because of the residual stresses in excess of the yield and the ultimate tensile strength of the cantilever material.
When looking at the STFT of the extracted segment of the AE signals in Figure 3b, the duration and frequency content of the recoater arm movement, the laser scanning, the recirculating fan on/off, and the two cracks can be clearly seen and differentiated from one another in detail. The second last layer can be seen being initiated by the recoater arm movement, with frequencies ranging up to 35 kHz lasting for a period of six seconds, followed by the laser scanning with slightly higher frequencies ranging up to 45kHz, and the process repeated for the last layer. The recirculating fan could be seen to be constant throughout the entire build process until it switched off at about 33 seconds. Toward the end of the extracted segment of the signal at about 46 s, the two cracks could be seen to have frequencies ranging up to 47 kHz.
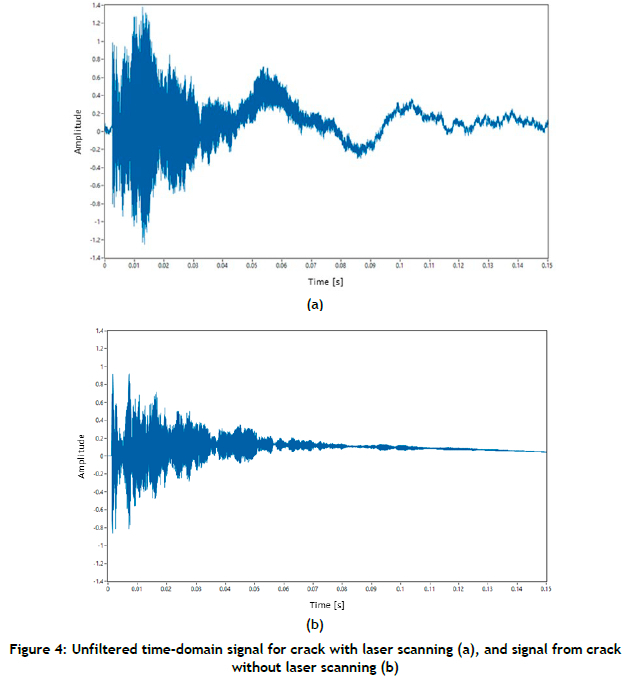
Using the STFT of the AE signal to categorise and differentiate the signals in the time domain, two cracks are shown below where crack-S2-C1 in Figure 4a occurred when the laser was scanning and the recirculating fan was running, and crack-S2-C2 in Figure 4b occurred when the laser was not scanning and the recirculating fan was off. Since the latter crack occurred when the build process had stopped and there was no machine noise, the duration of this crack was used as the sampling window for FFT and STFT. Both AE crack signals in Figure 4 could be seen having similarities in the crack signal profile, containing a burst of the amplitude intensity initially that gradually decreases with time. The only difference could be seen in the gradual decrease of the crack that occurred when the laser was scanning, possibly owing to the presence of the laser and recirculating fan noise. The peak amplitude of the crack in Figure 4a was also seen to be 1.38 (about 1.4), which was 0.5 greater than the amplitude intensity of the crack that occurred when the machine was not scanning. This could be a result of the reduction of residual stresses in the crack that occurred while the laser was not scanning, as it was observed to be the second crack to form on the same cantilever that caused failure with the baseplate. In both of the above cases, the crack signals could be detected and identified by using the time-domain features of the AE signal.
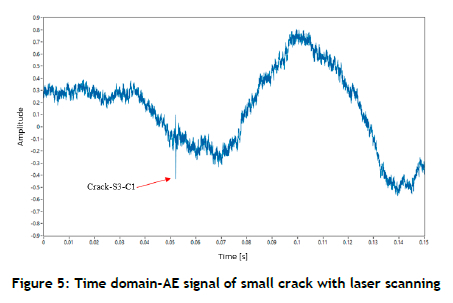
At about 0.052s in the time domain, the AE signal in Figure 5, a small spike in the amplitude could be observed. This spike in amplitude could be attributed to crack-S3-C1, which had occurred in the region while the laser was scanning and the recirculating fan was running. Unlike the crack signal that occurred previously in Figure 4a when the laser was scanning, these type of crack signals were difficult to detect in the time domain and even in the frequency-time domain because of the machine-related noise present in the signal.
During the analysis of the signal in the time domain, it was found that only attempting to use the amplitudes of the recorded AE signal to detect the occurrence of the cracks proved difficult owing to the machine-related noise such as the laser scanning and the recirculating fan running, which overpowered the other signals. It was only after the STFT had helped to locate the occurrence of these cracks that they could be identified in the time domain through their time stamp - although, for small cracks that had peak amplitudes below 0.4 in the time domain, it was very difficult to identify and locate them because of the machine noise present in the signal.
3.2. Frequency-domain AE features
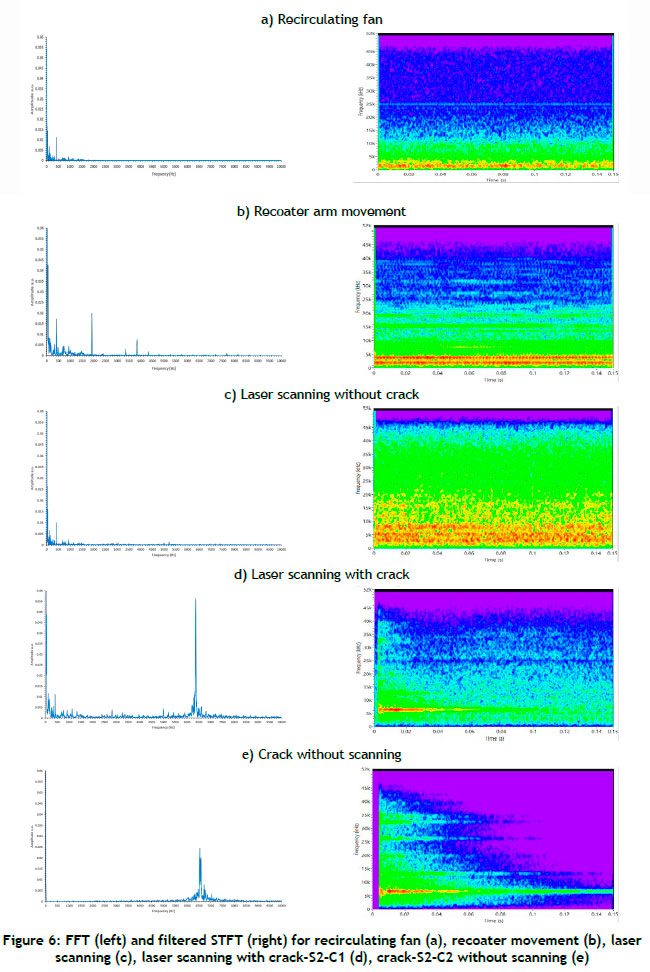
In Figure 6 below, the FFT and STFT of various machine-related AE signals - (a) the recirculating fan, (b) the recoater arm movement, (b) the laser scanning and AE crack signals; (c) crack-S2-C1, which occurred when the laser was scanning and the recirculating fan was running, and (d) crack-S2-C2, which occurred when the laser was not scanning and the recirculating fan was off is shown. Analysing the frequency content of the recorded AE signal provided great insight into the occurrence of different events in the signal. Focusing only on the FFT of the machine-related noise in Figure 6a, Figure 6b, and Figure 6c, the recirculating fan was seen to have a frequency range below around 400 Hz, with the other noise in the signal being very low and not exceeding 2 kHz. The recoater arm movement had a frequency peak of about 1.9 kHz, with its possible harmonic at about 3.8 kHz, while the laser scanning frequencies ranged from 020kHz. In the aforementioned machine-related noise, the respective frequencies observed in the FFT could also be seen to be constant throughout the considered duration of the STFT. The other higher frequencies present in all these signals, namely (a) the recirculating fan, (b) the recoater movement, and (c) the laser scanning, could possibly be related to other machine or external noise that was not categorised in this paper, and that would require further investigation.
The crack signal-S2-C2 (Figure 6e) that occurred when no laser scanning was present can be seen to have a frequency of about 6.5 kHz, with the crack profile of the signal clearly visible on the STFT. When looking at the FFT of the crack signal of crack-S2-C1 in Figure 6d, which occurred while the laser was scanning, this signal can be seen having a similar frequency - of about 6.4kHz - to the crack that occurred when no laser scanning was occurring. The intensity of this crack signal also increased by 0.034, which was almost double that of crack-S2-C2. The crack profiles of both cracks on the STFT were also very similar, although machine-related noise was present in the signal of crack-S2-C1.
4. CONCLUSIONS
Based on the results obtained, the following conclusions can be drawn:
• Attempting to use only the amplitudes of the recorded AE signal in the time domain to detect the cracks proved difficult owing to the machine-related noises, such as the recirculating fan and the laser scanning, which overpowered that of the crack signals.
• Using the STFT of the recorded AE signal proved promising, as the occurrence of macro cracks that were above the amplitude intensity of 0.9 in the time domain could be clearly detected and distinguished from the other machine noise that was categorised in this paper.
• The FFT's of both cracks that occurred when the laser was scanning and the recirculating fan was running, and when the laser was not scanning and the recirculating fan off, was were also seen to have similar frequencies.
• Under the current test conditions, gas-borne AE could be used to detect macro cracks with high amplitudes, whereas for smaller cracks (with peak amplitudes below 0.4) it was found to be difficult to identify and locate them because of the machine noise present in the signal.
• This paper has shown that a combination of frequency and amplitude measurements can be used to identify the occurrence of macro cracks during the building process.
ACKNOWLEDGEMENTS
This research was supported by the Department of Science and Innovation (DSI) under the Collaborative Programme in Additive Manufacturing (CPAM), contract number CSIR-NLC-CPAM-18-MOA-CUT-01. The authors thank the Centre for Rapid Prototyping and Manufacturing (CRPM) for their assistance.
REFERENCES
[1] P. Mercelis, J. Kruth, Residual stresses in selective laser sintering and selective laser melting, Rapid Prototyping Journal, 12(5), pp. 254-265 (2006). https://doi.org/10.1108/13552540610707013 [ Links ]
[2] L. Mugwagwa, I. Yadroitsava, N.W. Makoana, N.W. I. Yadroitsev, Residual stress in laser powder bed fusion, in Fundamentals of laser powder bed fusion of metals, Elsevier, pp. 245-276 (2021). https://doi.org/10.1016/B978-0-12-824090-8.00014-7 [ Links ]
[3] S.K. Everton, M. Hirsch, P.I. Stavroulakis, R.K. Leach, A.T. Clare, Review of in-situ process monitoring and in-situ metrology for metal additive manufacturing, Materials and Design, 95, pp. 431-445 (2016). https://doi.org/10.1016/j.matdes.2016.01.099 [ Links ]
[4] I.M. De Rosa, C. Santulli, F. Sarasini, Acoustic emission for monitoring the mechanical behaviour of natural fibre composites: A literature review, Composites Part A: Applied Science and Manufacturing, 40(9), pp 1456-1469 (2009). https://doi.org/10.1016/j.compositesa.2009.04.030 [ Links ]
[5] D. Kouprianoff, I. Yadroitsava, A. du Plessis, N. Luwes, I. Yadroitsev, Monitoring of laser powder bed fusion by acoustic emission: Investigation of single tracks and layers, Frontiers in Mechanical Engineering, 7, pp 1-17 (2021). doi:10.3389/fmech.2021.678076 [ Links ]
[6] J.R. Tempelman, A.J. Wachtor, E.B. Flynn, P.J. Depond, J.-B. Forien, G.M. Guss, N.P. Calta, M.J. Matthews, Detection of keyhole pore formations in laser powder-bed fusion using acoustic process monitoring measurements, Additive Manufacturing, 55, pp 1-18 (2022). doi: 10.1016/j.addma.2022.102735 [ Links ]
[7] M. Seleznev, T. Gustmann, J.M. Friebel, U.A. Peuker, U. Kühn, J.K. Hufenbach, H. Biermann, A. Weidner, In situ detection of cracks during laser powder bed fusion using acoustic emission monitoring, Additive Manufacturing Letters, 3, 100099 (2022). https://doi.org/10.1016/j.addlet.2022.100099 [ Links ]
[8] L. Chen, X. Yao, C. Tan, W. He, J. Su, F. Weng, S.K Moon, In-situ crack and keyhole pore detection in laser directed energy deposition through acoustic signal and deep learning, Additive Manufacturing, 69, pp 1-18 (2023). doi:10.1016/j.addma.2023.103547 [ Links ]
[9] K. Wasmer, T. Le-Quang, B. Meylan, M.P. Olbinado, A. Rack, S.A. Shevchik, Laser processing quality monitoring by combining acoustic emission and machine learning: A high-speed X-ray imaging approach, Procedia CIRP, 74, pp 654-658 (2018). doi: 10.1016/j.procir.2018.08.054 [ Links ]
[10] K. Moore, D. Louw, D. Kouprianoff, Developing a Ti6AL4V specimen to induce residual stress deformations and cracks for use in metal additive manufacturing online monitoring, in RAPDASA 23rd International Conference, 9-11 November, Somerset West - Cape Town, South Africa (2022). doi: 10.1051/matecconf/202237001004 [ Links ]
[11] V. Pandiyan, R. Drissi-Daoudi, S. Shevchik, G. Masinelli, R. Logé, K. Wasmer, Analysis of time, frequency and time-frequency domain features from acoustic emissions during laser powder-bed fusion process, Procedia CIRP, 94, pp 392-397 (2020). doi: 10.1016/j.procir.2020.09.152 [ Links ]
Available online 14 Dec 2023
* Corresponding author: karabomoore@gmail.com
ORCID® identifiers
K. Moore: https://orcid.org/0009-0007-1556-7201
D. Kouprianoff: https://orcid.org/0000-0001-9409-8472
D. Louw: https://orcid.org/0000-0002-2493-4903
I. Yadroitsava: https://orcid.org/0000-0003-3132-5724
I. Yadroitsev: https://orcid.org/0000-0002-7556-8675

