


Servicios Personalizados
Articulo
 Inglés (pdf)
 Articulo en XML
 Referencias del artículo
Indicadores

Links relacionados
-
 Citado por Google
 -
 Similares en Google
Compartir

 Permalink
South African Journal of Industrial Engineering
versión On-line ISSN 2224-7890
versión impresa ISSN 1012-277X
S. Afr. J. Ind. Eng. vol.34 no.4 Pretoria dic. 2024
http://dx.doi.org/10.7166/34-4-2862
GENERAL ARTICLES
System dynamics modelling and simulation of computer control systems for steel ingot furnaces
G. SomoI; I. DaniyanII, ; J. SwanepoelI; K. MpofuI
IDepartment of Industrial Engineering,Tshwane University of Technology, Pretoria, South Africa
IIDepartment of Mechanical & Mechatronics Engineering, Achievers University, Owo, Nigeria
ABSTRACT
The problem that necessitated this study was that some furnaces that were responsible for the further processing of steel pipes at Company X were not connected to a programmable logic control (PLC)-Internet of Things (loT) system. This slowed down the product flow. To address this problem, PLC-IoT systems were integrated so that the production system could be more effective. This study therefore models and simulates the integrated PLC-IoT control system, using the system dynamics modelling approach to investigate the performance of the automated gas furnaces. The PLC-IoT consists of an internal module that is used to process the data stream. After the implementation of the proposed control system, primary data was acquired by continuously evaluating the performance of the system. The research methodology used involved quantitative analysis and a simulation model using the Anylogic software. The result of the delivery and inventory of ingots from an automated system showed an upward trend with delivery and an inventory of an ingot at about 90 minutes; while a system that was not automated with PLC-IoT showed a downward trend of ingots. This shows that the introduction of the PLC-IoT for control makes the system more effective. The findings of this work could assist the manufacturers in achieving manufacturing or production efficiency, significant time savings, and better monitoring of the manufacturing process.
OPSOMMING
Die probleem wat hierdie studie genoodsaak het, was dat sommige oonde wat verantwoordelik was vir die verdere verwerking van staalpype by Maatskappy X nie aan 'n programmeerbare logiese beheer (PLC)-Internet of Things (IoT) stelsel gekoppel was nie. Dit het die produkvloei vertraag. Om hierdie probleem aan te spreek, is PLC-IoT-stelsels geïntegreer sodat die produksiestelsel meer effektief kon wees. Hierdie studie modelleer en simuleer dus die geïntegreerde PLC-IoT-beheerstelsel, deur die stelseldinamika-modelleringsbenadering te gebruik om die werkverrigting van die outomatiese gasoonde te ondersoek. Die PLC-IoT bestaan uit 'n interne module wat gebruik word om die datastroom te verwerk. Na die implementering van die voorgestelde beheerstelsel is primêre data verkry deur die werkverrigting van die stelsel voortdurend te evalueer. Die navorsingsmetodologie wat gebruik is, het kwantitatiewe analise en 'n simulasiemodel met behulp van die Anylogic-sagteware behels. Die resultaat van die aflewering en voorraad van blokke vanaf 'n outomatiese stelsel het 'n opwaartse neiging getoon met aflewering en 'n voorraad van 'n blokke op ongeveer 90 minute; terwyl 'n stelsel wat nie met PLC-IoT geoutomatiseer is nie, 'n afwaartse neiging van ingots getoon het. Dit wys dat die bekendstelling van die PLC-IoT vir beheer die stelsel meer effektief maak. Die bevindinge van hierdie studie kan die vervaardigers help om vervaardigings- of produksiedoeltreffendheid, aansienlike tydbesparings en beter monitering van die vervaardigingsproses te bereik.
1. INTRODUCTION
Company X is an organisation that produces steel pipes from ingots. The organisation produces steel pipes that are used to drain oil from underground, to grind sugar, and to be used by military services. Company X receives ingots from the supplier to be forged according to the requirements of the customer. The ingot passes through an electrical furnace for heating purposes, and must be heated to a temperature of 1230°C [1]. The ingot is heated for two days so that it is ready to be forged, and so that the forging process can be smooth. The ingot will move from the furnace to the forging press and from the forging press to the gas furnace for further processing; from the gas furnace, the steel pipe will be transported to the mechanical department for the drilling and milling process [2]. The problem is that the furnaces that are responsible for the further processing of steel pipes are not connected to programmable logic controllers (PLC) and Internet-of-Things (IoT) devices, and that slows down the product flow. It is therefore important to automate the furnaces that are responsible for the further processing of steel pipes so that the production system can be effective and productive within a specified time [3].
The fourth industrial revolution (4IR) is a system of technology that enables manufacturers to optimise their production processes. Data for production plans that is stored in various devices can be distributed through 4IR technology [4].
PLCs are a technology that runs through automation to control the production system in an organisation [5]. The technology consists of a computer program that runs the production system. The application of PLCs is productive in any organisation, in that they bring about the desired results for production output [5]. A PLC uses sensors and actuators to deliver alerting messages through media such as e-mail and SMS to personal computers (PCs) and mobile devices [6].
PLCs have become one of the computer control systems used by many organisations to control the production system and to produce quality products through the process of automating the production system. A computer control system is another technology that is used in many industries for effective output. Information systems play an important role in transferring data from one device to another to boost throughput. The application of computer control systems together with information systems in an organisation can lower the production cost and improve the quality of a product in a production system [7]. Sensors, often called 'smart sensors', are able to sense and distinguish certain parameters that must not be reached for safety purposes. Smart sensors are fed special details about the instrument or equipment to be analysed and to determine whether the equipment can continue to be used. The objective of a smart sensor is to improve the operational system so that it is of a high quality and is reliable [8]. The Internet of Things (loT) is a network of physical objects that are connected, using hardware, software, sensors, actuators, and so on, and that enables data collection, data exchange, and information exchange between devices. The IoT is a network that can connect anything to the internet, to enable information and data to move from one instrument to another. The loT system has the following components [9]:
• The collection of data by sensors and transporting data through electrical means
• Processing data through a computer system
• Data processed is received from sensors
• Actuators are responsible to activate the appropriate device for the task to be performed
• A module that is responsible for communication in the loT system
Data acquisition is a process that is used to gather information about the physical properties of an object; that information is transferred to be interpreted by a computer for further processing of information. A data processing module is a computer that performs a task, while a data processing node is where data is gathered, analysed and stored for future reference and for processing of other information that is to be used in the production process [10]. The problem is that furnaces that are responsible for the further processing of steel pipes are not connected to a PLC system, causing the product flow to be slow. This slows down the product flow by about three hours and causes the production rate to drop by around 10 per cent. It is therefore important to automate the furnaces so that the production system can be effective and more productive within a specified time [11]. The production statistics include the following: gas furnace 1 with six steel pipes, running for about eight hours; gas furnace 2 with five steel pipes, running for about seven hours; gas furnace 3 with three steel pipes, running for around five hours; and electrical furnace 4 with four steel pipes, running for about six hours. The automated system could be effective and efficient if it were connected to a PLC-IoT system. Gas furnaces 1, 2, 3, and 4 under an automated system would be expected to run for about six, five, three, and four hours respectively [12]. Thus the aim of this study was to model and simulate the computer control systems (PLC-IoT) for the automation of the gas furnaces, using a system dynamics modelling approach in order to make the production system more efficient.
The essence of this study was to probe the influence of PLC-IoT on a production system for steel pipes and to investigate the process of implementing a PLC-IoT and a PC.
It is envisaged that the findings of this study would bring about the automation of steel furnaces in order to make them more effective and to make the production system more efficient. Other potential benefits would be:
1. Improvement in quality and conformity of the steel product
A production system that was operated through PLC-IoT would enable it to produce a quality product because the system would be automated with PLC-IoT, not manually operated. The frequent opening of the furnace to check the level of the heat leads to poor quality. When the level of the heat is monitored on a computer screen, it allows for quality production.
2. Improvement in efficiency, reliability, and the rate of production, with a reduction in the production cycle time
A manually operated system in a production process cannot be reliable in respect of efficiency and the production cycle time. The operator or supervisor must constantly check the levels of the heat and physically check the levels of the gas that is coming into the furnace.
3. Long-term reduction in the cost of production
The cost of production is reduced when the system is automated. When it is manually operated, other systems can cause delays that lead to a loss of production and so result in more costs being added to the production process.
4. Effective manufacturing time
The manufacturing time of the production system becomes effective. A system that is automated with PLC-IoT can avoid production delays, whereas a system that is manually operated is usually associated with a lot of delays in the production process.
5. Information for making better decisions
A system that is automated with PLC-IoT enables data and information to be passed from one device to another. The system makes it easier to monitor the production process through the information that is driven by IoT.
6. ICT connectivity
The connectivity of an information network of computer technology enables information to be transferred from one device to another. The production supervisor is then able to make proper decisions because of the information that is communicated from the devices.
7. It will also permit production data to be acquired in real time, which is necessary for production improvement
A production system that is automated with PLC-IoT is capable of improved production because the production data is stored on a computer and other devices, and can be retrieved when it is needed. The IoT can also be used to monitor the environmental conditions in a production area; through IoT, the different variables that are happening in the organisation can be monitored [13].
It is vitally important that an organisation's systems are adjusted to using technologies that will enhance product quality. Systems that use IoT are very quick. The technology of IoT is reliable, and it is safe in respect of health and safety measures. The application of IoT is very effective, and can provide vital information to devices [14]. Lu [15] and Mosekilde and Laugesen [16] reported that the system dynamics (SD) model could be used in a brewery, to investigate the nonlinear behavior of the beer production and distribution system and to solve supply chain problems, such as a comparative analysis of the inventory and determining the direction of the supply chain management optimisation-acceleration flow.
The aim of this study was to investigate the performance of a gas furnace with an integrated PLC-IoT system in producing steel ingots, and to compare the results obtained with a manually operated system.
This study contributes both in theory and in practice to the field of the automation of steel furnaces. It demonstrates the process improvements that could be obtained by incorporating PLC-IoT devices into the control system. The novelty of this study lies in the automation of the steel furnace with the integration of the PLC-IoT devices into the control system, as well as the modelling and simulation using an SD approach in the Anylogic environment. The findings of this study could assist manufacturers in achieving manufacturing or production efficiency, significant time-savings, and better monitoring of the manufacturing process.
2. METHODOLOGY
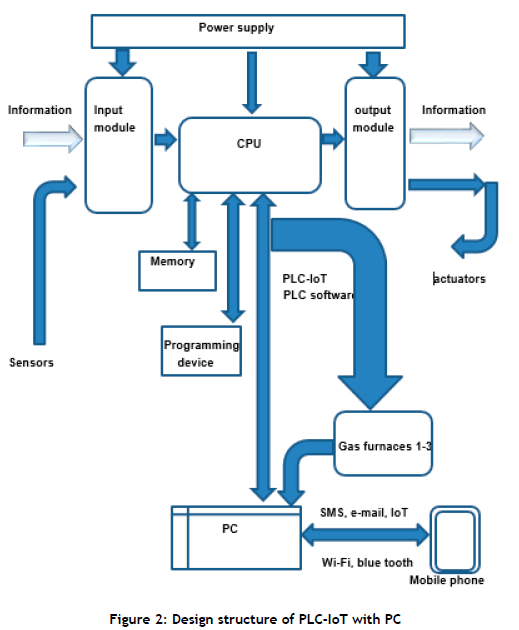
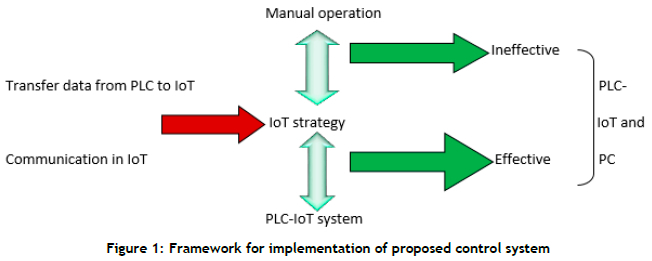
The framework for the design and implementation of the proposed computer control system (PLC-IoT) for the automation of gas furnaces is shown in Figure 1.
In the framework shown in Figure 1, it is quite clear that the automated system is driven by data and communication in IoT, which could make the system more effective when a computer control system is implemented. This would include the implementation of PLC-IoT and personal computers (PCs) [17].
When the production system is manually operated, it becomes ineffective in its speed and product quality. It is therefore important to consider the system that is automated to be effective and more accurate by producing the appropriate specifications and requirements of the product according to the wishes of the customers [18].
The SD model was used to determine the success of a dependent variable - the product of steel pipes - and to investigate the effectiveness of steel production under the influence of PLC-IoT.
In the case of Company X, which produces steel pipes, a simulation model was conducted to investigate whether the operation of PLC-IoT would function properly to cause the production process to go faster and more effectively. The Anylogic software was used for the SD model to probe whether the simulation would run without errors.
The reason for using the Anylogic program was that it is more advanced than the software by Vensim or Stella coupled with its suitability for system's modelling and simulation [19-22]. It can carry out a suitable simulation of simple, large, or complex manufacturing processes, units, or cells [21]. Furthermore, the software supports the design and use of feedback loops such as stock and flow diagrams. Many organisations that use the Anylogic software are familiar with the use of feedback loops. The feedback loop is operational in the use of an SD model. Anylogic can test an individual entity to see how it affects the entire production system [22]. The SD model is an effective method for solving many of the problems that are seen in many organisations. There is a lot of dependency - that is, activities that cause delays in a production system. There is a cause and effect behind every problem in an organisation; there are also reasons for the activities that cause delays in a production system. An SD model is a tool to solve this kind of problem. It uses a process of applying feedback loops to find a solution to the problem. An SD model uses the information to determine the stock and the flow of the process and of the system [23]. Many dependencies are not linear, and require the application of an SD model. SD modelling is more advanced than using just a spreadsheet [23].
The purpose of integrating PLC-IoT is to monitor of the heat levels inside the furnaces and to eliminate manual operation. PLC-IoT is re-programmable, re-usable, and reliable; so it can relate easily to a plant's computer system [24].
The quantitative research approach was used, as it involves the process of collecting data and analysing numerical data in an organisation. The method can be used to find patterns of certain elements in an organisation and to determine the number of steel pipes inside the furnace in an automated system as well as in a system that is not automated with PLC-IoT. The correlation research design was used to investigate the relationship between the dependent variable (steel pipes) before automation and after the automation process takes place. The independent variable (PLC-IoT) was also investigated to observe the behaviour of the system both before and after it had been automated. The results of the correlation research could be either positive or negative [25].
2.1. Data collection
The data that was gathered was considered to be secondary quantitative data; it was gathered through the system that was not automated with PLC-IoT. The purpose of gathering data through observation was to see and distinguish between the behaviour of the system before it was automated and its behaviour after the system was automated.
The data that was gathered included the number of steel pipes with respect to time of what is produced on a regular basis. The software used for the analysis of the results was Microsoft Excel in order to create bar charts, histograms, and recommended charts to see the number of steel pipes and how long they need in the furnaces that do the further processing. The graphs were compared with the system that was automated with PLC-IoT to see the behaviour and the quality of the production system in the organisation [26-27].
The implementation of the computer control system is to improve productivity, to minimise the time taken for production, and to produce quality products. The study compared the existing data with the data that was accumulated after the implementation of PLC-IoT and after the implementation of a simulation model prototype, so that the difference between the previous model and the present model could be evaluated.
2.2. Engineering data analysis
A graphical model was used along with a spreadsheet with the categorical or parametric quantitative data that was analysed. These were used because it was much easier to understand and to interpret the graph, and it was also easy to interpret the spreadsheet.
External desk research was used - that is, research done outside the boundaries of the organisation, such that data was collected through documented information [28].
2.3. PLC-IoT design
PLC-IoT is one of the elements of Industry 4.0. It is a wireless interface that is connected to sensors and actuators. PLC-IoT consists of an internal module that is used to process a data stream. The manager for process information is responsible for the formation of control loops using the sensors and actuator in a production system [29].
The 4IR has a design principle that needs to be taken into consideration when designing PLCs with IoT. The design principles also need to be taken into consideration when designing a system that is automated in a production process.
The design principles include the following:
i. Integration of production process into a value chain, enabling management to manage the entire manufacturing process.
ii. The capability for the components in the system to connect and communicate. The interaction of communication in an organisation can use data models for communication purposes.
iii. Different sub-systems in an organisation can make decisions that aim to achieve its goals.
iv. The performance of an organisation requires that the production system collect, communicate, and consolidate data in a production system to be able to make proper decisions.
v. The individual components that are used by operators can be replaced and can be improved for the functioning of the production system.
The PLC is the building block of a control system in the operation of a production system in any organisation. The PLC is concerned with the implementation of the feedback loop to enable the organisation's systems to have proper information about the production process [30]. The device of a PLC with IoT (PLC-IoT) is designed, and a prototype is made to take PLC to the level of industry 4.0. PLC-IoT has data storage with a wireless interface that is managed independently. PLC-IoT can improve the production system and enable a change in production output in respect of the quality of the product [31].
Figure 2 is a schematic representation of the PLC-IoT design. \
2.4. Work break-down structure (WBS)
WBS LEVEL 1: Programmable logic controllers (PLCs) and IoT
WBS level 1 involves the implementation of programmable logic controllers with the Internet of Things (PLC-IoT). The device of the PLC must be able to connect with the sensors and actuators; data and information can then move from one device to another through the IoT system.
WBS LEVEL 2: The design of software of PLCs with IoT
This involves breaking the operation into the elements of designing the software of the PLC that is connected to IoT system, implementing the software, installing it, testing it, connecting the PLC-IoT to the PC, training on the software, and managing the project.
The software of the PLC must be able to take instructions that come in the form of a program and to execute the instructions step by step. The output must be displayed on a PC through IoT.
• Implementation of the software: The implementation of the PLC software is done by a contractor so that the software can run the production system.
• Installation of the software: The installation of software in the PLC is also done by a contractor.
• Testing the software: The contractor is also responsible to test the software to see whether it is working properly to order to make the production system effective.
• Training on the software: The contractor is responsible for training the production supervisor in the use of the PLC software, and the supervisor will be able to train the operators in how to use the software.
• Project management: It is the responsibility of the project manager to see to it that all of the elements of the work breakdown structure are done according to plan.
This involves breaking down the sub-systems in the installation of the software and the sub-system of training in the software. The sub-system of the software installation involves the PC reading the data from the PLC. The sub-system of the training in the software involves the importance of filing the documents for future reference.
The design of the software for the PLC operating through the loT should be able to pick up corrective maintenance and planned maintenance in due course.
• Implementation of the software: The implementation of the software for the PLC must have a feedback loop to be able to identify the dependent and independent variables.
• Installation of the software: The installation of the software consists of the following: Eupack computer with IoT, software, and personal computer. The Eupack computer with software must have interconnectivity with the IoT to be able to communicate data and information to personal computers and mobile phones.
• Testing the software: The software is tested for interconnectivity with the IoT, the software, and the PC, to see the flow of data and information from one device to another.
• Training in the software: Training in the software comprises the following: training documents and doing the documentation. Proper documentation is created for the training in the software, and the documentation is placed where it can be retrieved for the further training of the organisation's employees.
2.5. Performance evaluation of manual operation of production system
Figure 3 presents a histogram showing the frequency of the continuous steel output. This is data that was acquired from a system that was manually operated, not the system that was automated with PLCs and IoT. It shows the following: gas furnace 1 with six steel pipes, running for about eight hours; gas furnace 2 with five steel pipes, running for about seven hours; gas furnace 3 with three steel pipes, running for about five hours; and electrical furnace 4 with four steel pipes, running for about six hours.
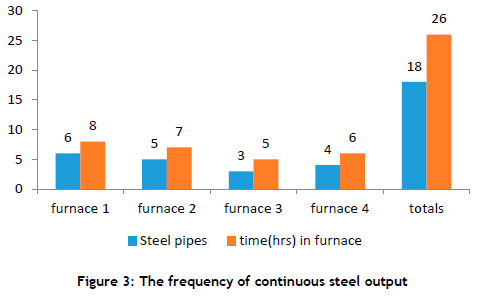
After the implementation of the proposed control system, primary data was acquired by evaluating the performance of the system on a continuous basis. The primary data shows the number of steel pipes that were placed in furnaces 1 to 4, and the number of hours they spent in the furnaces. The primary data is the product of the system that is automated with PLCs operating through the IoT.
2.6. Performance evaluation of the proposed PLC-IoT system using the SD model
The SD model was used to determine the performance of the production system using the proposed PLC-IoT control. The SD model was employed to understand the nonlinear behaviour of the automated gas furnace vis-ä-vis the manual ones over time, using stock, flows internal feedback loops, and delays. The interconnections among the components of the PLC-IoT could significantly influence the system's behaviour; thus there was a need to monitor how the system changed with time by using a model-based approach. The study also sought to examine the differences in the production system and the behaviour of the production process between the system that was automated with PLC-IoT and the system that was not so automated.
The SD model used a process and a feedback loop to determine the system's performance. It used the information from the secondary data to determine the stock and the flow of the process and the system. Many dependencies were not linear, and required the application of an SD simulation model [23].
The secondary data of the SD model showed an order to the factory for 12 ingots a day, the delivery of 10 ingots a day, an inventory of 16 ingots, the sale of four steel pipes a day, and customer demand for 17 steel pipes a day.
The operation of these gas furnaces with steel pipes inside only functioned under a manual production system. The automated system could make the production system effective and efficient through using a PLC-IoT system. The gas furnaces 1, 2, 3, and 4 were anticipated to run for about six, five, three, and four hours respectively under an automated system [12].
The SD model is illustrated in Figure 4. The sales of the steel pipes are linked to customer demand, and any delay in the production system is linked to the delivery and sale of the ingots. The figure also shows that the level of inventory can affect the delivery of the ingots.
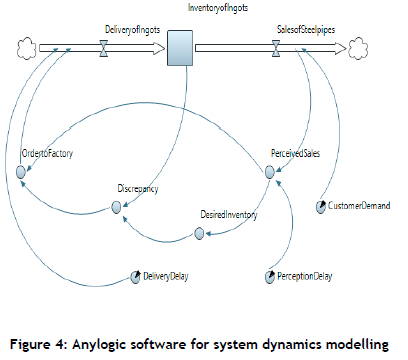
Dynamic variable 1 = Order to factory is 12 ingots
Dynamic variable 2 = Perceived sales are 18 steel pipes
Dynamic variable 3 = There are no discrepancies
Dynamic variable 4 = There is no specific desired inventory
Parameter 1 = Delivery delay is 5 days
Parameter 2 = Perception delay is 4 days
Parameter 3 = Customer demand is for 17 steel pipes
2.7. Material and energy balance
The material balance of the stock and flow represents the changes in the amount of the stock over time owing to the inflows and outflows of materials. This is expressed as Equation 1.

where to is the initial time (s) and (t) is the current time (s)
The inflow is the value of the stock that comes into the system, where the outflow is the value of the stock that leaves the system.
Given that dynamic variable 1 (order to factory is 12 ingots) and outflow is three ingots, and the stock of ingots is 16, from Equation 1 the net stock is 25 ingots.
Equation 2 expresses the rate of change of any stock.

where d(stock)/dt is the inflow of material less the outflow of material in the system, calculated as nine ingots.
Two kinds of radiation heat transfer occur in this study: from furnace to steel and from steel to steel; thus the equation of heat transfer through radiation from the furnace to the steel is given by equation 3.

where Qrad is the heat transfer through radiation (W/m2), σ is the Stefan Boltzmann constant (5.67 x 10⁸ W/m2k4), ε is emissivity (0.1), fv is the factor value of the steel to furnace (0.1), A is the external surface area of the (14 m2), tf is the temperature of the furnace (800 oC), and ts is the temperature of the steel (700 oC).
From equation 3, the heat transfer through radiation is calculated as 793.8 kW/m2). Similarly, equation 4 presents the heat transfer through radiation from steel to steel.

where t1 and t2 are the temperatures of the steels, which are 700 °C and 650 °C respectively. Thus the heat transfer through radiation from steel to steel is computed from equation 4 as = 396.9 kW/m2.
2.8. Validation of the developed SD model
The SD theory consists of stock, flow, and feedbacks. The stock consists of what is accumulated from the supplier. The stock describes the state of the system, and enables the organisation to make decisions and take action. The stock makes the system able to move, and it create delays by accumulating the difference between the inflows and the outflows of materials. The stock that comes in is the source of the production system that is not in equilibrium [32]. An SD model is used to determine whether the system is in equilibrium by determining the stock that is coming in, the inventory, and the outflow of materials. If the production system is running out of stock, the model will show a negative number when the simulation is running. When the stock is running with a positive number while the simulation is running, that is an indication that the stock is up to date. The sales of steel pipes are directly proportional to the inventory of ingots. That means that, as the inventory increases in the number of ingots, there will be an increase in the number of steel pipes that are produced. In turn, the inventory of ingots is also directly proportional to the delivery of ingots, which implies that, as the delivery of ingots increases, the inventory of ingots also increases. It is therefore important to keep the inventory running at a positive number in order to produce the required number of sales to customers. The inventory of an organisation increases by the flow of production and decreases by the flow of shipment [33]. The stock assists the person who is making decisions to know where they are, giving them the necessary information to make proper decisions. An organisation must be able to know the backlog in orders before it can draw up a production schedule. Information about the stock affects decisions relating to management and production. The stock has the information about past events, and can only change when there is the inflow and outflow of material. If the inflow and outflow is not operational, only the accumulation of past information about the existing stock can take place.
The reason for delays in an organisation is the stock: if no stock is coming in, there will be a delay in product output. When there is a change in the inflow of material, the outflow will lag behind for a while, but the speed of production will eventually be adjusted to the appropriate rate. Perceived delays also involve stock, even though the stock is not a material flow. It is important to see what is coming in and what is going out of an organisation so that the results of production can be fast-tracked [34]. The stock depends on the inflow and outflow of material; for the stock to be in equilibrium, the total inflow of material must be equal to the total outflow of material. Different decisions affect the stock's state of equilibrium. As the stock changes, information about the buffers will influence the inflows and outflows of the stock, and the feedback loops will operate to restore the balance of the stock [34].
It is important to know the dynamics of the stock, its inflows and outflows, because it is a function of SD modelling.
SD modelling enables the designer to have a wide range of options to improve a production system. SD techniques can benefit the ways in which the re-heating and heat treatment of the furnaces is done. SD modelling can be used to predict the rate of the heat that must operate in the furnace and to predict the design of the product. Modelling the system enables the product to be assessed and the uniformity of the temperature of the product to be predicted [35]. In the process of heat treatment, the heat that is transferred involves radiation from the furnace to a work-piece, and from the work-piece to the another work-piece. In this regard, it is important to make the following assumptions: 1) the furnace is operating as a heating source and is the place where heat is stored (in other words, the furnace is both the heat source and the heat storage); and 2) the temperature of the furnace and the temperature of the steel pipes may differ, since heat is usually transferred from the furnace to the steel pipes (the work-pieces).
The structure of the SD model has three elements: 1) the stock of the material that is used for the production process, which is often called the inventory; 2) the inflow of material from the supplier; and 3) the outflow, which is the material that used for production purposes. The stock of raw material never makes the production system ineffective. The stock of products to the customer never increases to the point that it blocks the rate of distribution to customers.
3. RESULTS AND DISCUSSION
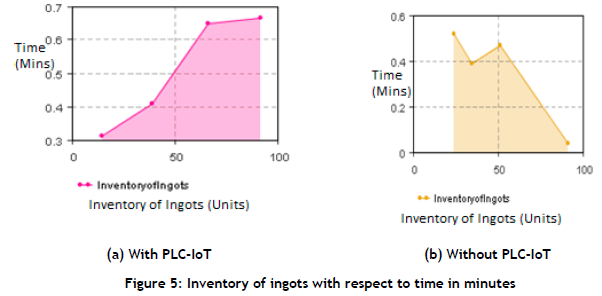
The SD model ran with an increasing inventory (Figure 5), with an increasing delivery of ingots per day (Figure 6), and increased sales of steel pipes per day (Figure 7).
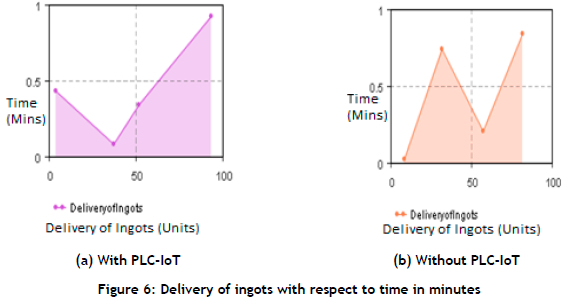
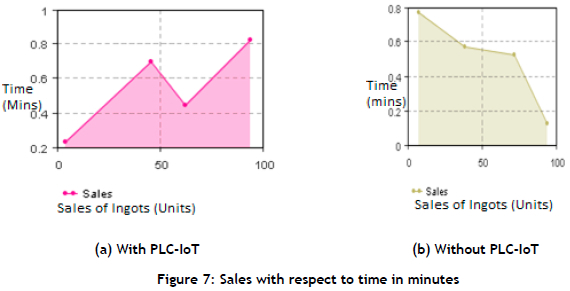
Figure 5 indicates an upward trend, with an inventory of ingots at about 90 minutes for the system with the integrated PLC-IoT, while the system without an automated PLC-IoT shows a downward trend. The system with the integrated PLC-IoT shows an upward trend because of the continuous production system of steel pipes in the system, thanks to the influence of the automated PLC-IoT; while the inventory in a system that is not automated shows a downward trend because of the quality of the product. Because of this, a lower demand for steel pipes is experienced. The upward trend of the inventory of ingots in the system that is automated with PLC-IoT is inversely proportional to the downward trend of the inventory of ingots in the a system that is not automated with PLC-IoT. That means that, as the inventory increases in the automated system, the inventory will decrease in the system that is not automated with PLC-IoT, because quality that is not improved will eventually affect the sales of steel pipes, which in turn will affect the inventory. It is therefore important to improve the quality of the product continuously to be competitive in the global market.
Figure 7 indicates an upward trend in the sale of steel pipes at about 90 minutes for the system with integrated PLC-IoT, while the one without the integrated PLC-IoT shows a downward trend. This is because of the demand for the product of steel pipes; the system automated with PLC-IoT makes it possible to produce a quality product and to increase the demand for the product.
The plot of the sales of steel pipes in a system that is automated with PLC-IoT is inversely proportional to the plot of the sales of steel pipes in a system that is not so automated. This indicates that, as the sales of steel pipes increase in the automated system, the sales of steel pipes decrease in the non-automated system; the poor quality of the product will affect sales and demand, and in turn affect the inventory. As time goes by, they will eventually affect the delivery and order of ingots to the factory.
It is therefore vitally important to consider implementing the PLC-IoT, as the graphs show an upward trend in the delivery of ingots, the inventory of ingots, and the sales of steel pipes. The implementation of PLC-IoT gives rise to an effective production system, monitoring system, and production process.
Table 1 shows the flow of units of ingots for production, while Figure 8 indicates the flow of material from inventory to the production system. Given that the outflow of material is constant at 100 units/month, the inflow of material moves at an average of 100 units/month. The difference in the number of units that did not go into the flow of the production system is 50 units. The inflow is at its maximum at the initial stage. Assuming that the stock starts with an initial value of 500 units, the inflow is at its maximum at 100 units/months. The net flow will fall over the period of three months. The stock in the organisation increases, but slows down. The net flow of material will eventually reach zero and begin to move in a negative direction.
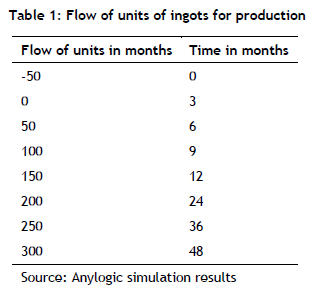
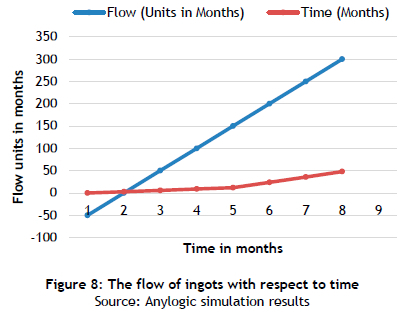
Figure 8 shows the flow of ingots with respect to time.
The net rate of the stock will continue to be zero, because the inflow of material is equal to the outflow. The net rate will fall between the third month and sixth month. The size of the net rate will continue to increase with time, and the stock will increasingly fall. During the sixth month, the net rate will reach its most negative value.
Table 2 presents the stock of ingots in the inventory. The data was obtained through desk research.
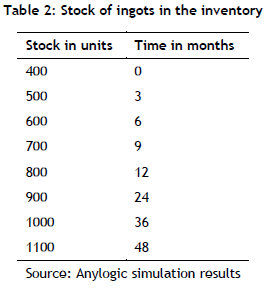
Figure 9 shows the stock of ingots in the inventory.

The simulation model shows that it ran without errors, indicating that the implementation of PLC-IoT for the furnaces that are responsible for the further processing of steel pipes could be successful. The SD model ran with an increasing inventory, an increasing delivery of ingots per day, and increasing sales of steel pipes in the system that was automated with PLC-IoT; whereas, in the non-automated system, the inventory of ingots and the sales of steel pipes moved in a downward trend.
4. CONCLUSION AND RECOMMENDATIONS
4.1. Conclusion
It is crucial to determine and monitor furnace performance in order to visualise the trajectory of important variables such as stock, flow, delivery, sales, and inventory over time. This is necessary when evaluating a system's performance and making informed decisions about the adjustment of certain variables for optimum production. In this study, Anylogic software was used to model and simulate a dependent variable of the products of steel pipes, using an SD model. The SD simulation showed that the system could run without errors, indicating that the system was working.
The secondary data was used to construct a histogram in order to determine the number of steel pipes in the organisation's various furnaces, and to look at how long the steel pipes spent in each of the furnaces. Primary data was also regularly gathered to determine the difference between the manual system and the system automated system with PLC-IoT. The results for the delivery and inventory of ingots in the automated system showed an upward trend, with the delivery and inventory of ingots at about 90 minutes, while the system that was not automated showed a downward trend for the ingots. This showed that the introduction of the PLC-IoT for control would make the system more effective. Thus the results obtained indicate that the integrated PLC-IoT system could enhance the performance of the steel furnaces. The technology would also enable the automation of the production system and increase the speed of production. It is recommended that personal computers be connected to the PLC-IoT system for the easy dislay, analysis and interpretation of the results. Through the inter-connectivity of the IoT, data, graphs, and information could be delivered to mobile phones or through e-mail and SMSes. The findings of this study could assist manufacturers in increasing their manufacturing and production efficiency, significantly saving time, yielding important data and information, and also assist in monitoring the manufacturing process better. Future studies could consider the integration of data analytics software into the integrated PLC-IoT for robust data acquisition and processing in order to make informed decisions in real time.
4.2. Recommendations
PLCs should be connected to a personal computer so that the graphs that enable the interpretation of the heat inside the furnaces could be displayed. The connectivity of the IoT could allow data to be moved from a PC to a mobile phone. It is therefore important that a contractor be hired implement and install the PLC-IoT.
It is recommended that Company X change its normal production practices from a manually operated system to one that is controlled through PLC-IoT. The findings of this study could assist in achieving manufacturing or production efficiency, significant time saving, improved product quality, an improved information system, the improved transfer of data between devices, and an improved information system.
It is therefore recommended that the implementation and installation of PLC-IoT be put in place for the automation of the gas furnaces and the electrical furnace, and that the evaluation of the performance of the automated production system be put in place to determine its effectiveness.
REFERENCES
[1] Southall, R. 2001. Now Iscor wants to turn its share into a re-structure story. Financial Mail, March 9, 2001. [ Links ]
[2] Fan M. & Yang J.X. 2015. High strength reinforced heat treatment production line automatic control system. 6th International Conference in Manufacturing, Beijing, China. [ Links ]
[3] Brier, S.E. O. Struger, 67, a pioneer in automation. The New York Times. [Online] Available at https://www.nytimes.com/1998/12/27/us/o-struger-67-a-pioneer-in-automation.html [ Links ]
[4] [Accessed 24-02-2022]. [ Links ]
[5] Bahrin, M.A.K., Othman, M.F., Azli, N.N. & Talib, M.F. 2016. Industry 4.0: A review of industrial automation and robotics. Jurnal Teknologi, 78(6-13): 137-143. [ Links ]
[6] Li, H., Yu, J., Zu, J., Yu, D. & Wang, J. 2020. Design of aircraft simulator measurement and control system based on PLC. In Proceedings of 2020 International Conference on Aviation Safety and information Technology, 100-103. [ Links ]
[7] Dunn, A. The father of invention: Dick Morley looks back on the 40th anniversary of PLC. Manufacturing Automation. [Online] Available at srayghosh@annexbusinessmedia.com [Accessed on 23-02-2020]. [ Links ]
[8] Gupta, S. & Sharma, S.C. 2005. Selection and application of advanced control system: PLC, DCS and PC-based system. Journal of Scientific and Industrial Research, 64(4): 249-255. [ Links ]
[9] Daniyan, I.A., Mpofu, K., Ale, F. & Oyesola, M.O. 2021. Design and simulation of a dual-arm robot for manufacturing operations in the railcar industry. International Journal of Robotics and Automation, 36(6): 434-447. [ Links ]
[10] Lorandel, J., Khelif, M.A. & Romain, O. 2022. A low-cost hardware attack detection solution for IoT devices. In 2022 IEEE 31st International Symposium on Industrial Electronics (ISIE), 2022, 674-679. [ Links ]
[11] Ramakishnan, R. & Gaur, L. (2019). Internet of Things: Approach and applicability in manufacturing. London: Chapman and Hall. [ Links ]
[12] Daniyan, I.A., Mpofu, K., Daniyan, L. & Adeodu, A. (2021). Development and automation of a multi-feedstock plant for biodiesel production. In 2021 International Conference on Electrical, Computer and Energy Technologies (ICECET), 1-9. [ Links ]
[13] Bolton, W. 2009. Programmable logic controllers, 5th edition. New York: Jonathan Simpson. [ Links ]
[14] Moerth-Teo, O., Eder, M., Holzegger, E. & Ramsauer, C. 2020. IoT-based monitoring of environmental conditions to improve the production performance. Procedia Manufacturing, 45: 283288. [ Links ]
[15] Adeodu, A.O., Daniyan, I.A., Omitola, O.O., Ejimuda, C., Agbor, E. & Akinola, O. 2020. An adaptive industrial Internet of Things (IIOts) based technology for prediction and control of cavitation in centrifugal pumps. Procedia CIRP, 91:927-934. [ Links ]
[16] Lu, C. 2021. Research on bullwhip effect management in supply chain based on system dynamics. Journal of Physics: Conference Series, 1910(1): 012034. [ Links ]
[17] Mosekilde, E. & Laugesen, J.L. Nonlinear dynamic phenomenon in the beer model. System Dynamics Review, 23(2-3): 229-252. [ Links ]
[18] Ashby, M.F. 2011. Material selection in mechanical design, 4th edition. Saint Louis, MO: Elsevier Science and Technology. [ Links ]
[19] Barkeman, H.G. & Gomez-Meija, L.R. 1998. Managerial compensation and firm performance: A general research framework. Academy of Management Journal, 41(2): 135-145. [ Links ]
[20] Monzambe, G.M., Mpofu, K. & Daniyan, I.A. 2021. Optimal location of landfills and transfer stations for municipal solid waste in developing countries using non-linear programming. Sustainable Futures, 3(100046):1-9. [ Links ]
[21] Weimer, C.W., Miller, J.O. & Hill, R.R. 2016. Agent-based modeling: An introduction and primer. In 2016 Winter Simulation Conference (WSC), 65-79. [ Links ]
[22] Daniyan, I.A. Mpofu, K., Ramatsetse, B.I., Zeferino, E., Monzambe, G. & Sekano, E. 2021. Design and simulation of a flexible manufacturing system for manufacturing operations of railcar subassemblies. Procedia Manufacturing, 54: 112-117. [ Links ]
[23] Hamizan, S., Roselina, S., Habibollah, H., Yusliza, Y. & Lizawati, M.Y. 2021. Crowd emergency evacuation simulation time analysis via obstacle optimization strategy. Journal of Physics: Conference Series, 2129(1): 012045. [ Links ]
[24] Kamal, A. & Al-Ghamdi S.G. 2021. Development of decision support tools: Methodological framework of system dynamic energy model. In Energy systems evaluation (Volume 2): Multi-criteria decision analysis, Wiesbaden: Springer, 27-38. [ Links ]
[25] Meng, Z., Wu, Z., Movianto, C. & John, G. 2016. A data-oriented M2M messaging mechanism for industrial IoT applications. IEEE Internet of Things Journal, 4(1): 236-246. [ Links ]
[26] Daniyan, I.A., Daniyan, O.L. & Mpofu, K. 2022. The use of sensor based technology for enhancing maintenance operations. In Advances in Manufacturing Technologies, Sharjah, UAE: Bentham Science Publishers, 89-100. [ Links ]
[27] Heininen, L., Everett, K., Padrtova, B. & Reissell, A. 2020. Arctic policies and strategies - Analysis, synthesis and trends, International Institute for Applied Systems Analysis, 263. [Online] Available at https://pure.iiasa.ac.at/id/eprint/16175/1/ArticReport_WEB_new.pdf [Accessed 23-04-2022]. [ Links ]
[28] Shi, F., Wang, J., Shi, J., Wu, Z., Wang, Q., Zhenyu, T., Kelei, H., Shi, Y. & Shen, D. 2020. Review of artificial intelligence techniques in imaging data acquisition, segmentation, and diagnosis of Covid-19. IEEE Reviews in Biomedical Engineering, 14: 4-15. [ Links ]
[29] Gelman, A., Carlin, J.B., Stern, H.S., Dunson, D.B., Vehtari, A. & Rubin, D.B. 2013. Bayesian data analysis, 3rd edition. London: Chapman and Hall. [ Links ]
[30] Milton, R., Hay, D., Gray, S., Buyuklieva, B. & Hudson-Smith, A. 2018. Smart IoT and soft AI. In Living in the Internet of Things: Cybersecurity of the IoT - 2018, 1 -6. [ Links ]
[31] Bian, C. 2007. PLC application development guide. Beijing: Mechanical Industry Press. [ Links ]
[32] Bouter, C.P., Monireh, S. & Leon, W.R. 2021. Towards a comprehensive methodology for modelling sub-models in the Industry 4.0 asset administration shell. In 2021 IEEE 23rd Conference on Business Informatics (CBI), 2: 10-19. [ Links ]
[33] Freire-Gonzalez, J. & Ho, M.S. 2018. Environmental fiscal reform and the double dividend: Evidence from a dynamic general equilibrium model. Sustainability, 10(2): 501. [ Links ]
[34] Xu, J., Li, C., Li, Y., Lim, C.W. & Zhu, Z. 2018. Stochastic resonance and safe basin of single wall carbon nanotube with strongly non-linear stiffness under random magnetic field. Nanomaterials, 8(5), 298. [ Links ]
[35] Sterman, J. & Sterman, J.D. 2000. Business dynamics: System thinking and modelling for complex world. London, McGraw-Hill Education. [ Links ]
[36] Liu, M.S, Choi, C.K. & Leung, C.W. 2001. Start-up analysis of oil fired furnace - The smoothing Mont Carlo model approach. Heat and Mass Transfer, 37, 449-457. [ Links ]
Submitted by authors 20 Jan 2023
Accepted for publication 8 Aug 2023
Available online 14 Dec 2023
* Corresponding author: afolabiilesanmi@yahoo.com
ORCID® identifiers
G. Somo: https://orcid.org/0009-0004-3944-9662
I . Daniyan: https://orcid.org/0000-0002-7238-9823
J. Swanepoel: https://orcid.org/0000-0001-6861-4437
K. Mpofu: https://orcid.org/0000-0003-3429-7677

