


Services on Demand
Article
 English (pdf)
 Article in xml format
 Article references
Indicators

Related links
-
 Cited by Google
 -
 Similars in Google
Share

 Permalink
South African Journal of Industrial Engineering
On-line version ISSN 2224-7890
Print version ISSN 1012-277X
S. Afr. J. Ind. Eng. vol.34 n.3 Pretoria Nov. 2023
http://dx.doi.org/10.7166/34-3-2946
SPECIAL EDITION
System dynamics modelling of the water-energy nexus in South Africa: a case of the Inkomati-Usuthu Water Management Area
J.G NanfukaI, II; R. OosthuizenII, *
ISchool of Industrial Engineering, University of Valladolid, Valladolid, Spain
IIGraduate School of Engineering and Technology Management, University of Pretoria, Pretoria, South Africa
ABSTRACT
The energy demand in African economies, including South Africa, is expected to double by 2040. The water-energy-food nexus, introduced at the Bonn 2011 conference, illustrates the interdependencies of these resources. In the case of South Africa, with its semi-arid climate and frequent power outages, this study focuses on the water-energy nexus. Water is necessary for electricity generation in coal-powered plants, while energy is required for water supply. Using system dynamics, the study models the current state of the nexus in South Africa and explores future scenarios considering population growth, GDP per capita, and water and energy intensities. The findings serve as a basis for discussing the country's allocation of scarce water and energy resources. Further research could examine South Africa's potential investment in renewable energy resources to solve the increasing energy demand.
OPSOMMING
Die energievraag in Afrika-ekonomieë, insluitend Suid-Afrika, sal na verwagting teen 2040 verdubbel. Die water-energie-voedsel-nexus, wat by die Bonn 2011-konferensie bekendgestel is, illustreer die interafhanklikheid van hierdie hulpbronne. In die geval van Suid-Afrika, met sy semi-droë klimaat en gereelde kragonderbrekings, het hierdie studie gefokus op die water-energie-nexus. Water is nodig vir elektrisiteitsopwekking in steenkoolaangedrewe aanlegte, terwyl energie benodig word vir watervoorsiening. Deur sisteemdinamika te gebruik, het die studie die huidige stand van die nexus in Suid-Afrika gemodelleer, en toekomstige scenario's ondersoek wat bevolkingsgroei, BBP per capita en water- en energie-intensiteite in ag neem. Die bevindinge dien as 'n basis vir die bespreking van die land se toekenning van skaars water- en energiebronne. Verdere navorsing kan Suid-Afrika se potensiële belegging in hernubare energiebronne ondersoek om die toenemende energievraag op te los.
1. INTRODUCTION
The world's population reached a record 8 billion in November 2022 and is estimated to reach 9 billion 15 years later in 2037 [1]. An increase in the global population adds pressure to the existing resources needed to sustain the population.
The case of the African continent is no different. Africa's population, estimated at 1.1 billion by 2008 [2], had risen to 1.36 billion in 2020 - a growth rate of 2.50%. Energy demand in African economies is expected to double by 2040 nearly. The interdependence between the world's most critical resources, water and energy, is garnering more attention in academia and the general public [3]. The publication of the United Nations' Sustainable Development Goals in 2015 highlighted the importance of these resources (Goal 12). Sustainable management and use of these resources requires the public and policymakers alike to understand their underlying interlinkages. These links vary because various forms of energy are produced and consumed in so many ways. Therefore, the complexities of this interaction cannot be simplified nor understood by using a reductionist approach.
It is necessary, therefore, to have some structures and guiding principles for formulating management strategies for such complex resources. The systems approach includes methods for problem definition, modelling, and policy analysis to understand such complexities. One such method is system dynamics, which provides guiding principles for creating computer models to mimic the interactions of such systems in order to understand them and devise management methods [4, 5].
The research in this paper explores a system dynamics modelling of the interconnections in the water-energy nexus in the Inkomati-Usuthu Water Management Area (WMA). The specific questions to be answered to achieve the above research objective are:
• What are the underlying relationships between the population growth in South Africa and its economic indicators?
• What are the resulting implications of the economic and population relationship on water and energy as critical resources?
• What policy implementation is recommended for efficiently allocating water and energy as scarce resources in the Inkomati-Usuthu WMA?
2. THE WATER-ENERGY NEXUS
Water supply and distribution, as well as maintaining its quality, requires energy. Coal-fired power plants and thermal or heat plants use water as a coolant. The connections between water and energy throughout their lifespans are so intricate that it is impossible to determine precisely the extent to which they are intertwined. At the beginning of their life cycle, water dams and reservoirs, for example, involve using energy-intensive materials such as concrete and steel that may not be accounted for when determining the energy consumed in water production and utilisation [6]. As a starting point for analysing these complex and numerous interactions and dependencies of water and energy, scientists have categorised them into physical, monetary, and distributive [6] and function: production, transportation, and consumption [3].
The 'physical' category in the physical, monetary, and distributive categorisation refers to the water intensity for energy use and energy intensity for water use. The 'monetary' category refers to the interactions and feedback between energy and water prices. The 'distributive' category assesses the implications of water allocation to energy and vice versa. The production, transportation, and consumption categorisations are essential and seek to assess the separate sectors based on their functions.
This research borrows from the 'physical' categorisation and uses water and energy intensity to model and simulate the interactions of these resources in the context of South Africa. A literature search on the existing models that have been developed using various techniques for the water-energy nexus yielded several models. However, they are underpinned by three major energy system models from which they have been developed.
2.1. The Integrated MARKAL-EFOM System
The Integrated MARKAL-EFOM System (TIMES) [7, 8] model's development was triggered by the United States' oil crisis of 1973 [9] and was formulated by the Energy Technology System Analysis Program (ETSAP) and launched in 2000. At its core, the TIMES model is an economic model generator for energy systems. It provides a basis for representing energy dynamics over a long time horizon. The user provides estimates of the existing stocks of available energies and future technologies and sources of primary energy and their potential [8]. In this way, it is possible to simulate decision-making scenarios for energy investment and primary energy supply and allocation.
The interaction with water in the TIMES model is included, to a small extent, in the environmental criteria in which water plays a big part. Its advantages lie in being data-driven, and that the quantities and prices of all commodities are in equilibrium [8]. Only energy that is required by the demand is produced and supplied. The TIMES model, therefore, helps simulate possible energy futures based on several scenarios specified by the user, such as implementing a carbon tax, policies on wastewater disposal and management, subsidies for some technology types, and many others. While limited in the water-energy nexus, the TIMES model has formed the foundation for many other models in which water is a major commodity, as seen in the sections that follow.
2.2. National Energy Modeling System - Water
The National Energy Modeling System (NEMS) was created by the Energy Information Administration (EIA) to support the United States' energy policy. Like the TIMES model, the NEMS focuses on the energy system and further divides its modelling into four supply modules: four demand modules, conversion modules, a module to simulate the energy and economy interactions, and an emissions policy module [10]. The NEMS is an improvement on the TIMES module by including the water demand of energy technologies and infrastructure. It also considers cooling water requirements and the energy dissipated in the construction of dams. While it may be helpful to think of water and energy as commodities, modelling their source systems in a market, such as lakes, rivers, and reservoirs, may yield important insight into their efficient abstraction. The next model sought to introduce an integrated approach to doing this.
2.3. Water Evaluation and Planning System
A model created with applicability to municipal and agricultural systems, single sub-basins, and complex river systems is the Water Evaluation and Planning (WEAP) System [11]. It aims to examine alternative water development and management strategies using a GIS-based interface. The user specifies variables, their relationships, and their accompanying assumptions, using mathematical expressions that are linked dynamically to Excel [11]. The system then has the ability to display the results of their interactions graphically using bar and line graphs, along with a bird's eye view, to highlight the significant indicators that drive the system. Just like its predecessors, WEAP places the demand side of the water systems on an equal footing with the supply side so that they are in equilibrium. It is useful for management, forecasting, and policy formulation.
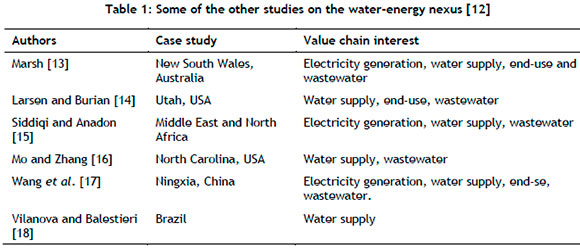
A summary of the global studies conducted on the water-energy dynamics is presented in Table 3 below, along with the classification of the process in the water-for-energy or energy-for- water value chain, namely electricity generation, water supply, end-use, and wastewater.
3. CASE STUDY
3.1. The South African context
South Africa is located at the southern point of Africa, with the Indian Ocean on its south-eastern side and the South Atlantic Ocean to the south-west. South Africa has a narrow coastal zone, and an extensive interior with altitudes ranging from 900m above sea level to about 2000m above sea level. Despite its proximity to the Tropic of Capricorn, most of the inland areas experience a temperate climate, and the seasons are opposite to those of the global northern hemisphere, with the summer extending from October to March and winter from June to August. Perhaps one of the most important nexus issues in South Africa is the absence of arterial rivers and inland lakes. Since the possibilities of hydropower production are limited, the reliance on coal for electricity has come from the presence of rich coal deposits that were discovered in the 1970s and 1980s. Of the electricity produced in South Africa, 85% is from coal power plants, which puts it at the forefront of the need to reduce carbon emissions from these coal plants.
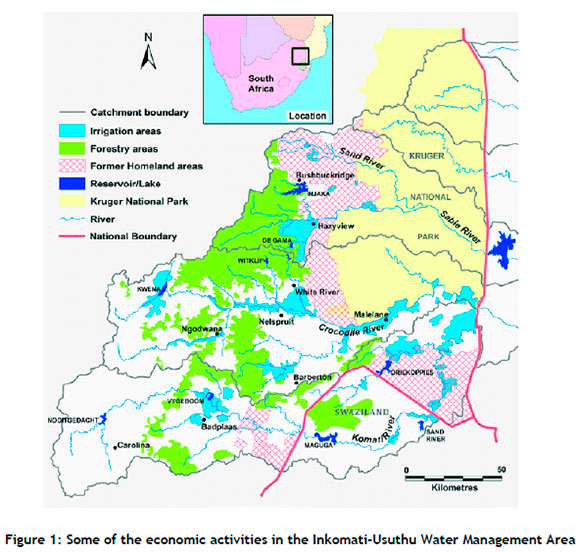
3.2. The Inkomati-Usuthu Water Management Area
The Inkomati-Usuthu WMA forms part of an international basin shared by the Republic of South Africa, Mozambique, and the Kingdom of eSwatini ('Swaziland' in Figure 1 ), and is governed by a treaty between those countries [19]. It comprises three main catchments with rivers that flow into the Inkomati River system: the Sabie-Sand, the Crocodile, and the Komati [20]. The basin covers about 31,230 square kilometres, and 57% of the total available water is used by irrigated agriculture. The main economic drivers in the region are forestry, irrigation-based agriculture, mining, and eco-tourism. Some areas for these activities, such as forestry, are shown on the map in Figure 1. Amid water stress and a growing water deficit resulting from frequent water restrictions, an increase in the number of emerging black farmers, and international treaty obligations [20], the region depends significantly on the water in the catchment. However, it is characterised by inequitable distribution from varying rainfall, quantity and quality water stresses, and inefficient use in some areas.
Some barriers to effective water management and distribution in the region are significant disparities among social groups, lack of access to knowledge about water resources and integrated water resource management (IWRM), and lack of access to productive land and support infrastructure for efficient farming practices. In light of the above, poor municipal waste management that decreases water quality affects eco-tourism, which is highly dependent on the WMA's large biodiversity and free-flowing river systems [19].
Fortunately for the Inkomati-Usuthu WMA, it is situated in Mpumalanga Province, where one of the municipalities, Emalahleni, was declared a Renewable Energy Development Zone (REDZ). Mpumalanga provides up to 76% of the total national electricity supply, which is generated by 11 coal-fired power stations [21]. The demarcation of Emalahleni comes after the Paris Agreement with the South African government to reduce carbon emissions by 34% by 2020. In addition to reducing coal-based power generation, Emalahleni is also strategic for erecting large-scale solar photovoltaic (PV) cells. Execution of these RES strategies may release the pressure of the reliance on the dams in the Inkomati-Usuthu WMA and pave the way for a just energy transition and universal access to electricity for farm irrigation, especially for the growing number of subsistence farmers in the region.
The natural network of water sources in the Inkomati-Usuthu WMA comprises the rivers, including the Inkomati River, that drains part of the Mpumalanga province in South Africa, Mozambique, and Eswatini. The total basin area is 46,800 km2, of which 63% is in South Africa, 5% is in Eswatini, and 32% is in Mozambique [22]. The Joint Inkomati Basin Study (JIBS) quantified the amount of surface and groundwater in the basin. The main water problems in the area include intense water use and competition between various social groups [23]. Water abstraction using dams in the river system started in 1962 with the commissioning of the Nooitgedacht dam in South Africa to supply cooling water to an Eskom thermal power station in the Olifants River catchment area. Eswatini later commissioned the Sand River dam to supply water for irrigated sugarcane production. In the period leading up to 1984, four other dams were constructed: three on the Crocodile and one on the Sabie. Mozambique, which had been lagging, commissioned the biggest dam on the catchment with a capacity of 850Mm3 - Corumana dam on the Sabie River. With the basin's storage capacity, water use also increased sharply.
3.3. Water uses
The major uses of water in the Inkomati basin are irrigation, forest plantation, inter-basin water transfers, domestic, municipal, industrial use, livestock, and game. The largest consumer of surface and groundwater is irrigated agriculture, covering an estimated area of 102,000 hectares with an uptake of 870 Mm3/a [23]. Recent developments in Eswatini, Mozambique, and South Africa are looking to expand these irrigation farms to increase the demand by 780Mm3/a [23]. The dominant irrigated crop in all three countries is sugarcane. Even though afforestation in the basin is mainly rain-fed, forests alter its hydrology because the runoff that would otherwise end up in the river system is reduced. This reduction was last estimated at 518Mm3/a [23]. Consumption by this means is controlled by a permit system in South Africa and Eswatini. Together with irrigated agriculture, water consumption by afforestation comes to 91% [23].
'Water transfers' refers to the water that is exported from the Inkomati-Usuthu basin to neighbouring basins to meet their demand, such as the 132Mm3/a from the upper Inkomati river catchment that is used as cooling water for thermal power plants in the Olifants River catchment area. Eswatini also exports 128 Mm3/a to the Umbeluzi basin for irrigating sugarcane and domestic use in the neighbouring communities. Domestic and municipal water use accounts for only 5% of the total capacity of the basin. However, this percentage is expected to rise with the growing population in the region. The existing industries in the region are concentrated in the urban centres, such as the SAPPI paper mill and the TSB sugar mills in South Africa, the Xinavane and Maragra sugar mills in Mozambique, and the Mhlume sugar mill in Eswatini. The water requirements for these industries are planned alongside the municipal water requirements. The dams built in the basin primarily store water for the abovementioned uses, so hydropower provision is secondary. Studies by JIBS recommended that a certain amount of water be left in the river system to support the riverine ecosystems. However, when this amount conflicted with the principal amounts required for other uses, further studies were encouraged to ascertain the figures.
3.4. Energy production and uses
The South African electricity landscape is dominated by coal-fired power generation stations operated by Eskom [21]. Mpumalanga, the province in which the WMA of interest for this study is located, produces 76% of this electricity from 11 of Eskom's coal-fired power stations, making up around 95% of the total electricity demand in South Africa. The remaining percentage is met through municipalities' distribution, imports, and independent power producers (IPP). The transmission and distribution of electricity in the country are also solely managed by Eskom and by metropolitan and local municipalities.
Therefore, electricity in South Africa is managed using a single-buyer model, in which Eskom is responsible for real-time dispatch and the exclusive right to buy from IPPs and generation to sell to distributors.
However, this model has led to intensive load shedding countrywide since 2008. Given the time required to increase generation capacity, load shedding is estimated to continue until 2024/2025. The Integrated Resource Plan (IRP), a long-term plan to increase the country's electricity generation capacity, includes a firm reliance on renewable energy. Of this added capacity, 42% should be renewable, adding up to 20 400 MW by 2030.
On a national level, the energy demand by sector is released annually by the Department of Mineral Resources and Energy. In its 2021 report, the primary consumers of energy were singled out as industrial, transport, agriculture, residential, commerce, and public services. Unaccounted energy is referred to as 'non-specified'. The industrial sector, which accounted for 51% of the total energy demand in the country, was also a mix of a cluster of industries such as chemical and petrochemical, mining and quarrying, iron and steel, non-metallic metals, food and tobacco, and non-ferrous metals. Most of the energy used by the industry was 'non-specified'. However, the chemical and petrochemical industry consumed the most significant proportion of the accounted-for energy, followed by iron and steel. The agricultural sector was noted as a significant consumer of liquid fuels, amounting to 68% of the energy in the sector. The energy used in this sector was mainly used for transporting agricultural raw materials, feeds, and finished products from farms to various markets. So electricity accounted for only 31% of this total energy [24].
4. CONCEPTUAL BACKGROUND
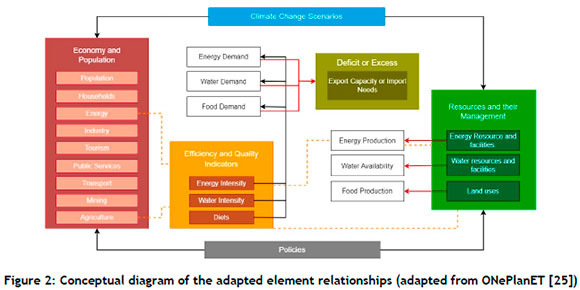
The conceptual diagram in Figure 2 shows an overview of the conceptual architecture of the model. It implies using similar linkages and modelling equations to form a basis for the Inkomati-Usuthu WMA analysis. The primary purpose of the architecture and modelling process is to form the basis for decision-making through in-model policy analysis and scenario assessment. The model's architecture identifies four major sub-models: economy and population, efficiency and quality indicators, deficit or excess, and resources and their management. Variables from the economy and population and the amount of the resource in question can be used to obtain the efficiency indicators, such as water intensity, from which the demand is obtained to assess whether there is a deficit or excess of that resource in the economy. Climate change scenarios and policies may be applied to the economy, population, and resources to make decisions that address the indicators or the deficit or excess seen in the simulation results.
As a starting point for the project, considering an overarching scope, elements from the architecture in the model above have been singled out to address the water deficit problem in South Africa. In an assessment of the eco status of the Komati River [22] and of the balance of the supply and demand side of the WMAs in South Africa, the Komati River has been observed time and time again to have a negative water balance [26]. This comes because of the effect of the climate in the region. Mpumalanga province in South Africa, home to the WMA, has a semi-arid climate, and in addition, the Komati serves three countries in which irrigation agriculture is intense. The ecological reserve, which aims to leave a predetermined amount of water in the river to support its natural ecosystems, is often violated because of the negative water balance.
In addition, the water in the Komati serves the coal-powered plants for cooling. Although this does not form a percentage as significant as that for agriculture, priority may be given to these plants, as running them directly supports the economy. Amid all these complex issues, a model of their interlinkages shows how the different elements affect one another and the implications of implementing policies to address the harmful water balance problem. The methodological process consists of five steps:
• Literature review, similar models - a preliminary literature study on NEXUS studies, especially in Africa. This is coupled with similar models developed for other WMAs, such as the Yangtze River in China [27].
• Data collection - The importance of data availability in the modelling process cannot be overestimated. The availability of data for one specific demographic and economic indicator was obtained from the World Bank database. Data concerning the climate was obtained from the FAO database, and all local data on the consumption and supply of water as a resource in South Africa was obtained from the Statistics of South Africa archives.
• Causal loop diagram analysis - The identified indicators that were represented as variables were analysed using a systems approach and systems thinking to draw relationships from their interactions with and feedback to one another. This diagram serves as an entry into the development of the Forrester diagrams in Vensim, Ventana Software.
• Modelling in Vensim - the model architecture previously presented in the conceptual development of the study was translated into a working model by using appropriate relationships between the different variables to simulate their working behaviour.
• Results analysis - The model produced results that indicate the effect of the model's elements on one another. These were analysed with reference to the objectives of the study previously mentioned.
The methodology employed in this study is based on system dynamics, a conceptual framework developed by Jay Forrester at MIT in the 1950s. System dynamics departs from reductionism, which involves breaking down complex phenomena into smaller components for analysis, by considering the system as a whole [5]. It involves describing the system as a collection of interconnected parts and examining how they function together. In this way, system dynamics emphasises that the structure of a system determines its behaviour and effectiveness rather than attributing issues solely to external factors. Instead, the problems in a system arise from interactions among its subcomponents. System dynamics models strive to incorporate a wide range of interaction aspects to capture the complexity of closed systems.
System dynamics concentrates on the flow of feedback that occurs throughout the components of the system in the form of feedback loops, the dynamic behaviour that occurs when flows accumulate in stocks, and dynamic notions such as delays and nonlinear relations, to describe the system's behaviour. These factors affect the system's past performance and potential future evolution [28].
4.1. Causal loop diagram
The main variables in the conceptual diagram in Figure 2 have been expounded further to represent their interrelationships using a causal loop diagram as the first step in the modelling process. Causal loop diagrams are a tool for articulating and communicating underlying insights into complex systems [29]. The causal loop diagram in this study seeks to understand the behaviour underlying water scarcity amid other nexus issues such as energy and the economy.
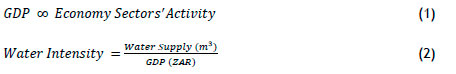
As shown in Figure 3, water demand and intensity (in light blue) are affected by a reinforcing loop from the economic sector's activity, implying that an increase in the economic sector's activities increases the overall GDP and further reduces the water intensity; conversely, it causes an increase the demand for water. This relationship is explained further in equations 1 and 2 below. The underlying assumption that the commodity supplied is precisely what the economic activity and the population demand, is taken from TIMES, NEMS, and WEAP.
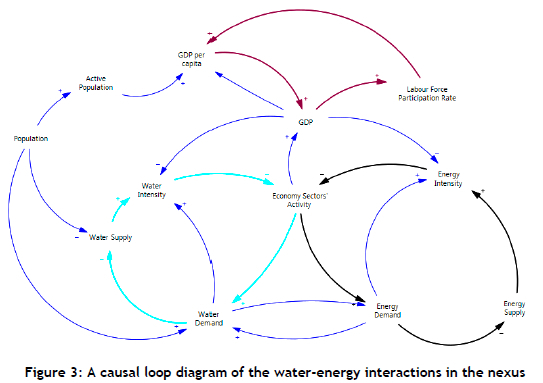

Population and population growth are essential indicators from the causal loop diagram because they stimulate an increase in the GDP per capita, based on the active population, and negatively affect water and energy supply systems. As noted earlier, an increase in the population results in even more pressure on these systems. The labour force participation rate, defined as the percentage of the active population who are willing to work, given the GDP per capita, has a reinforcing relationship with the energy and water feedback systems. This implication emphasises the point that the higher the economic growth of a country, the higher the economic activity (the reverse is also true), and thus the higher the energy and water demand. More variables have been added to the causal loop diagram in developing the Forrester diagram in Vensim to support the model's objectives and the simulation.
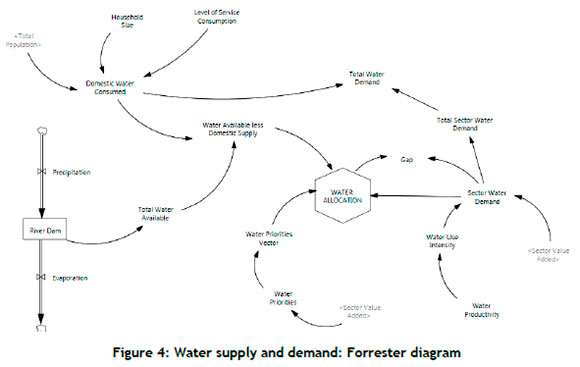
4.2. Water supply and demand
Water supply in the Inkomati-Usuthu WMA area has been assumed to be equal to the amount of water in the reservoir network. An increase in the volume of water in the reservoirs has been assumed to result from precipitation and decreased due to loss through evaporation. The total water available for economic demand is then reduced by the amount needed for the population and households.
The amount of water consumed in these households is based on their size and level of service. Du Plessis et al. [30] and Jacobs et al. [31] explored the level of service classification in detail to form the benchmarks for estimating household water consumption that have been used in this model. The water available after the domestic portion has been deducted is allocated to the economic sectors, based on the value they add to the GDP and their water demand.
4.3. Energy supply and demand
The energy demand and supply systems have been divided into dams for energy generation and supply and the sectors that consume this energy. In the Inkomati-Usuthu WMA, three major sources of energy are present: coal-powered plants, hydropower plants, and the Ngodwana biomass power plant, which is still under construction. These power plants have been modelled on their potential production figures, and their historical output has then been used to project their performance over time. Their stocks are totalled as the potential power production, which is then compared with the demand for this energy using the variable 'gap'. This gap can be used to assess whether there is a surplus or deficit on either side of the energy system.
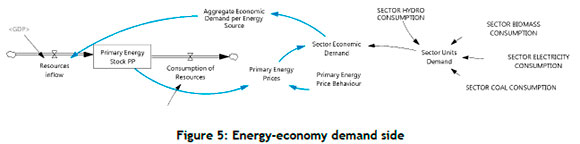
The energy-economy demand side shown in Figure 5 illustrates the relationship between the primary energy stocks such as coal, gas, and hydroelectric power, and the economic demand for these resources. The stocks of these primary energies in an economy determine their prices, which in turn influence their economic demand based on the price behaviour. The common price behaviour that governs this is that when the primary energy stocks are low, their prices on the market increase. This is evident when the prices of petrol or gas go up when the stocks in the country are low. Similarly, the economic demand for these resources governs their inflow into the stocks. An imbalance between what is demanded and what is available requires an economy to seek out imports for some of these resources. The feedback between these relationships is shown using blue arrows in Figure 5.
The driver for energy production and supply, as modelled in the Forrester diagram in Figure 6, is the different energy intensities that are a function of the gross value added and their supply, as discussed earlier. This is used as an input into the market price function in Vensim, which is simply a many-to-many allocation. The allocation ensures that the electricity manufactured by the power plants (PROTRA PP) is the same as that demanded by the sectors ('demand satiation' in the diagram).
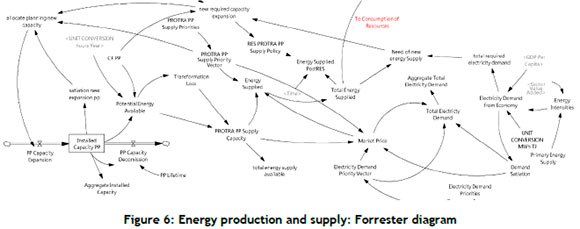
The energy supplied is then aggregated into the total energy supplied, which feeds into the consumption of resources in the energy economy in Figure 5. The demand-supply gap has also been modelled into the diagram as the difference between the total electricity demand and the total energy supplied. Using this value, the capacity expansion of the power plants is determined proportionally.
5. DISCUSSION AND RECOMMENDATIONS
The underlying relationships between water and energy as critical resources have been explored thoroughly, albeit simply, in this study. It forms a starting point for modelling such systems in the country, especially since most water management systems face the problem of negative water balances. Through the advancement of such models and studies, adequate guidance can be developed for implementing policies to sustain the eco status of South Africa's precious river systems.
Using the water-for-energy and energy-for-water analogy, water-for-energy is heavily relied on in coal-powered stations, which form the bulk of the energy supply system. This is stressed further by a growing population and by advancements in agriculture, which are also heavier water consumers. In the face of climate change and freshwater stress in semi-arid regions such as South Africa, prioritising water use through allocation is recommended.
REFERENCES
[1] UNFPA, "World population data portal," UNFPA. https://pdp.unfpa.org/?data_id=dataSource_8-1%3A3%2CdataSource_8-3%3A7%2B8%2CdataSource_2-0%3A4&page=Visualization-Overview (accessed 15/05/2023). [ Links ]
[2] OAU and ECA, "Population and development in Africa," United Nations Population Information Network(POPIN),1994,https://www.unfpa.org/sites/default/files/resource-pdf/POPULATI0N_AND_DEVELOPMENT_IN_AFRICA_OAU_ECA.pdf 1994 (accessed 15/05/2023). [ Links ]
[3] H. Ait Mimoune, S. Amine Boudghene, and F. Samir, "A review of the water-energy nexus," Renewable and Sustainable Energy Reviews, vol. 65, pp. 319-331, 2016. doi: https://doi.org/10.1016/j.rser.2016.07.020 [ Links ]
[4] B. K. Bala, F. M. Arshad, and K. M. Noh, System dynamics: Modelling and simulation, Singapore: Springer, 2017. https://link.springer.com/book/10.1007/978-981-10-2045-2 [ Links ]
[5] J. W. Forrester, "The beginning of system dynamics," http://static.clexchange.org/ftp/documents/system-dynamics/SD1989-07BeginningofSD.pdf 1995. [ Links ]
[6] F. Kahrl and D. Roland-Holst, "China's water-energy nexus," Water Policy, vol. 10, no. S1, pp. 51-65, 2008. doi: 10.2166/wp.2008.052 [ Links ]
[7] S. Allena-Ozolina, I. Pakere, D. Jaunzems, A. Blumberga, and G. Bazbauers, "Integrated MARKAL-EFOM system (TIMES) model for energy sector modelling," in 2020 IEEE 61th International Scientific Conference on Power and Electrical Engineering of Riga Technical University (RTUCON), 2020. IEEE, pp. 1-7. [ Links ]
[8] R. Loulou, G. Goldstein, A. Kanudia, A. Lettila, U. Remme, and K. Noble, "Documentation for the TIMES Model PART I - Concepts and theory," Energy Technology Systems Analysis Programme, http://www.iea-etsap.org/web/Documentation.asp ,2016. [ Links ]
[9] F. A. Plazas-Nino, N. R. Ortiz-Pimiento, and E. G. Montes-Páez, "National energy system optimisation modelling for decarbonisation pathways analysis: A systematic literature review," Renewable and Sustainable Energy Reviews, vol. 162, p. 112406, 2022. doi: https://doi.org/10.1016/j.rser.2022.112406 [ Links ]
[10] The U.S. Energy Information Administration, "The national energy modeling system: An overview," U.S Department of Energy, 2023. [Online]. Available: www.eia.gov (accessed 07/06/2023). [ Links ]
[11] J. Sieber, "WEAP water evaluation and planning system," presented at the 3rdInternational congress on Environmental Modelling and Software, Burlington, VT, July 2006. https://scholarsarchive.byu.edu/cgi/viewcontent.cgi?article=3112&context=iemssconference [ Links ]
[12] H. Gozini, B. Zahraie, and Z. Ravar, "System dynamics modeling of water-energy nexus for resource-saving policy assessment," International Journal of Environmental Research, vol. 15, no. 2, pp. 349367, 2021. doi: 10.1007/s41742-021-00321-5 [ Links ]
[13] D. Marsh, "The water-energy nexus: A comprehensive analysis in the context of New South Wales," Doctor of Philosophy (Engineering), Faculty of Engineering and Information Technology, University of Technology, Sydney, Sydney, Australia, 2008. http://hdl.handle.net/10453/20229 [ Links ]
[14] S. G. Larsen and S. J. Burian, "Energy requirements for water supply in Utah," in The water-energy nexus in the American West, Cheltenham UK / Northampton MA: Edward Elgar Publishing, 2011, pp. 153-164. [ Links ]
[15] A. Siddiqi and L. D. Anadon, "The water-energy nexus in Middle East and North Africa," Energy Policy, vol. 39, no. 8, pp. 4529-4540, 2011. [ Links ]
[16] W. Mo and Q. Zhang, "Modeling the influence of various water stressors on regional water supply infrastructures and their embodied energy," Environmental Research Letters, vol. 11, no. 6, p. 064018, 2016. [ Links ]
[17] J. Wang et al., "China's water-energy nexus: Greenhouse-gas emissions from groundwater use for agriculture," Environmental Research Letters, vol. 7, no. 1, p. 014035, 2012. [ Links ]
[18] M. R. N. Vilanova and J. A. P. Balestieri, "Exploring the water-energy nexus in Brazil: The electricity use for water supply," Energy, vol. 85, pp. 415-432, 2015. [ Links ]
[19] T. Gyedo-Ababio, "Presentation of the annual report and financial performance for the 2018/2019 financial year," Inkomati-Usuthu Catchment Management Agency, 2018. [Online]. Available: https://static.pmg.org.za/200519IUCMA_ANNUAL_REPORT_PRESENTATION_2018-19.pdf. (accessed 15/06/2023). [ Links ]
[20] K. Denby, S. Movik, L. Mehta, and B. van Koppen, "The 'trickle down' of IWRM: A case study of local-level realities in the Inkomati Water Management Area, South Africa," Water Alternatives, vol. 9, no. 3, pp. 473-492, 2016. [ Links ]
[21] C. Nyamadzawo, "Mpumalanga renewable energy and sustainable mobility market intelligence opportunity brief," Mpumalanga Green Cluster Agency, Mbombela, 1200, South Africa, 2021. Available:https://mpumalangagreencluster.co.za/wp-content/uploads/2021/10/MPUMALANGA_2021-ENERGY_MIR_FINAL_DIGITAL.pdf(accessed 22/06/2023). [ Links ]
[22] M. Selepe and F. Roux, "Ecostatus of the Komati River catchment, Inkomati River system," Mpumalanga Tourism and Parks Agency, Mpumalanga, South Africa, 2015. https://www.dws.gov.za/iwqs/rhp/state_of_rivers/Komati_River_Report_2014_Final.pdf [ Links ]
[23] A. C. Vas and P. van der Zaag, "Sharing the Incomati waters: Cooperation and competition in the balance," Water Policy, vol. 5, no. 4, pp. 349-368, 2003. [ Links ]
[24] R. Keneilwe, "The South African energy sector report," Department of Mineral Resources and Energy, Pretoria, South Africa, 2022. https://www.energy.gov.za/files/media/explained/2022-South-African-Energy-Sector-Report.pdf (accessed 22/06/2023). [ Links ]
[25] GEEDS, "OpeN source nExus modelling tools for planning sustainable energy transition in Africa," vol. 2 499 887 50, ed. Spain, France, Netherlands, Cape Verde, Kenya, Sweden, South Africa, Nigeria, Italy: European Union, 2022. [ Links ]
[26] Statistics South Africa, "Natural resource accounts: Updated water accounts for South Africa: 2000," Discussion document - D0405, Statistics South Africa, http://www.statssa.gov.za/publications/D0405/D04052000.pdfhttp://www.statssa.gov.za/publications/D0405/D04052000.pdf, 2000.(accessed 22/06/2023). [ Links ]
[27] H. Jiang, S. P. Simonovic, and Z. Yu, "ANEMI_Yangtze v1. 0: An integrated assessment model of the Yangtze economic belt-model description," Geoscientific Model Development Discussions, vol. 2021, pp. 1-35, 2021. [ Links ]
[28] J. Sterman, System dynamics: Systems thinking and modeling for a complex world, ESD Working Papers; ESD-WP-2003-01.13-ESD Internal Symposium, Cambridge MA: Engineering Systems Division MIT, 2002. https://dspace.mit.edu/handle/172L1/102741 [ Links ]
[29] T. Tip, "Guidelines for drawing causal loop diagrams," Systems Thinker, vol. 22, no. 1, pp. 5-7, 2011. [ Links ]
[30] J. du Plessis, H. Jacobs, A. Ilemobade, and M. Crouch, "Establishing a household water consumption benchmark for South Africa," Water Research Commission, Report no. 2980/1, p. 20, 2020. [ Links ]
[31] H. Jacobs, M. Crouch, A. Ilemobade, and J. du Plessis, "Per capita water consumption for benchmarked South African service levels derived by means of explicit reasoning," Water SA, vol. 48, no. 3, pp. 171-179, 2022. [ Links ]
* Corresponding author: rudolph.oosthuizen@up.ac.za
ORCID® identifiers
J.G Nanfuka: https://orcid.org/0009-0001-4692-5987
R. Oosthuizen: https://orcid.org/0000-0002-2333-6995

