


Serviços Personalizados
Artigo
 Inglês (pdf)
 Artigo em XML
 Referências do artigo
Indicadores

Links relacionados
-
 Citado por Google
 -
 Similares em Google
Compartilhar

 Permalink
South African Journal of Industrial Engineering
versão On-line ISSN 2224-7890
versão impressa ISSN 1012-277X
S. Afr. J. Ind. Eng. vol.34 no.3 Pretoria Nov. 2023
http://dx.doi.org/10.7166/34-3-2951
SPECIAL EDITION
Heterogeneous trading strategy ensembling for intraday trading algorithms
D.J.C Koegelenberg*; J.H. van Vuuren
Stellenbosch Unit for Operations Research in Engineering, Department of Industrial Engineering, Stellenbosch University, South Africa
ABSTRACT
Since the inception of algorithmic trading during the mid-1970s, considerable resources and time have been committed by the financial sector to the development of trading algorithms in the hope of obtaining a competitive advantage over human contenders. A plethora of trading algorithms has been proposed in the literature; each algorithm is unique in its design, but little emphasis has been placed on heterogeneous trading strategy ensembling. In this paper, we propose a trading strategy ensemble method for combining three different domain-specific trading strategies: a deterministic strategy, a probabilistic strategy, and a machine-learning strategy. The objective of the trading strategy ensemble is to find an appropriate trade-off between the levels of return and the risk exposure of a trader. We implement our strategy across different historical forex currency pair data in a bid to validate the trading strategy ensemble, and we analyse the results by invoking appropriate return and risk performance measures.
OPSOMMING
Sedert die ontstaan van algoritmiese handel gedurende die middel-1970s, is aansienlike hulpbronne en tyd deur die finansiële sektor aan die ontwikkeling van handelsalgoritmes toegewy in die hoop om 'n mededingende voordeel bo menslike handelaars te verkry. 'n Oorvloed handelsalgoritmes is in die literatuur voorgestel; elke algoritme is uniek in sy ontwerp, maar min klem is geplaas op die heterogene samestelling van handelstrategieë. In hierdie artikel stel ons 'n handelstrategie ensemble-metode voor om drie verskillende domein-spesifieke handelstrategieë te kombineer: 'n deterministiese strategie, 'n stogastiese strategie en 'n masjienleerstrategie. Die doel van die handelstrategie-ensemble is om 'n toepaslike afruiling tussen die opbrengsvlakke en die risikoblootstelling van 'n handelaar te vind. Ons implementeer die strategie oor verskillende historiese forex-geldeenheidspaar-datastelle in 'n poging om die handelstrategie-ensemble te bekragtig, en ons ontleed die resultate deur toepaslike opbrengs- en risikoprestasiemaatstawwe te gebruik.
1. INTRODUCTION
Since the inception of algorithmic trading during the mid-1970s, traders have expended considerable effort on designing trading algorithms in order to exploit any structure in complex financial markets. A plethora of research on financial markets is available in the literature; and it commonly conforms to one of two overarching research endeavours. The first is concerned with inferring information from historical market data (encapsulating the vast majority of methods used by trading algorithms), while the second is focused on microeconomic asset analyses and traders' sentiments [1].
Nuti et al. [2] claimed that the activity of algorithmic trading may be disaggregated into four constituent phases: pre-trade analysis, trading signal generation, trade execution, and post-trade analysis. The majority of existing research is focused on the pre-trade analysis phase of algorithmic trading in the form of financial market time series forecasting (such as the work conducted by Chen et al. [3] and Ticknor [4]), but little emphasis is usually placed on the trading signal generation phase responsible for the 'money-making' decisions.
In support of this lack-of-research claim, one may consider the domain of ensemble learning. In time series forecasting, ensemble learning is used to combine the efforts of multiple homogeneous or heterogeneous machine-learning techniques to obtain a new combined forecast that achieves superior performance [5]. Applying ensemble learning to financial market time series forecasting has produced promising results, resulting in some researchers even claiming that it is an essential part of algorithmic trading [6, 7, 8, 9]. This raises the question of whether trading strategies could also benefit from ensemble methods for improved profitability and reduced risk. Upon reviewing the literature, however, it is clear that there is a complete lack of ensemble-based trading strategies.
This lack may, of course, only be because of an absence of detailed descriptions of the working of trading strategies that are used by traders (owing to the generally avaricious nature of traders) and their need to maintain a competitive advantage, for it is well known that trading signal generation techniques experience market saturation once a trading methodology is publicly known and implemented [10]. The difficulty in this domain of research, therefore, is to make an impactful contribution to the literature without voiding its relevance and interfering with its subsequent mass adoption. A meaningful contribution related to trading strategies may, therefore, be any methodology that suits a trader's unique trading style but still provides sufficient modularity to accommodate confidential substitution methods that contribute to the longevity of a trader's success.
In the light of these difficulties, an automated trading strategy decision assistance tool (ATSDAT) is proposed in this paper for ensembling/combining the decision-making process of heterogeneous trading strategies, with two primary objectives:
1. Providing a methodology according to which traders can combine profitable publicly known or confidential trading strategies; and
2. Not necessarily endeavouring to increase the profitability of the underlying trading strategies, but rather to reduce the risk associated with executing trades.
The remainder of this paper is organised as follows. First, a brief overview of the literature on trading strategies and the methods required to implement the proposed ATSDAT is provided in Section 2. The proposed methodology is then discussed in detail in Section 3, and validated in a case study for which the results are presented and discussed in Section 4. The paper closes in Section 5 with a recommendation as to appropriate future work.
2. LITERATURE REVIEW
This section contains a brief review of the literature on algorithmic trading, risk management, and multiple-criteria decision-making. First, a brief overview is provided in Section 2.1 of three trading strategy paradigms. Thereafter, the review continues in Section 2.2 with a brief discussion on popular risk performance measures in the domain of algorithmic trading, before concluding in Section 2.3 with an exposition on the technique for order of preference by similarity to ideal solutions (TOPSIS) methodology used in multiple-criteria decision-making.
2.1. Trading strategies
A trading strategy is a set of one or more rules, based on market behaviour, to determine appropriate times to open or close a position. These strategies generate buy, hold, and sell signals that are governed by the strategys' opening and closing criteria [11]. Signal generation during execution of a trading algorithm is performed either manually or by an advanced automated decision-making system, or by a combination of the two. In the latter case, human traders intervene when automated trading strategies are not capable of executing trades. These human traders use their own discretion, as well as current market data and the outputs of the trading strategy, to draw appropriate conclusions and make trading decisions [2].
For the purposes of the research reported here, trading strategies are classified according to three overarching paradigms: deterministic strategies, probabilistic strategies, and machine-learning strategies. Each paradigm (and an example of each) is briefly discussed in the remainder of this section.
2.1.1. Deterministic strategies
Deterministic trading strategies use fixed trading rules that do not adapt to changing market conditions. These trading strategies often rely on predetermined threshold values to trigger buy or sell signals. Most commonly, trading strategies in this class are based on technical trading rules that indicate market trend, momentum, and/or resistance. One example of a momentum-based technical trading strategy is the stochastic oscillator (SO) trading strategy. The SO indicator outputs a value between zero and one hundred, indicating whether market conditions are trending either upwards or downwards. According to the SO trading rule, a buy signal is triggered if the SO indicator crosses the threshold value of 20 from below, while a sell signal is triggered if the SO indicator crosses the threshold value of 80 from above [12].
2.1.2. Probabilistic strategies
Probabilistic trading strategies use statistical estimates and probability distributions to identify trading opportunities. One such trading strategy was proposed by Lui and Xiao [13] in 2009. The strategy uses the Dempster-Shafer combination rule to fuse the trading rules of the relative strength index (RSI) [14], commodity channel index (CCI) [15], and moving average convergence divergence (MACD) [16] technical trading strategies. The authors found that the trading strategy outperformed each individual technical trading strategy when back-tested on an undisclosed asset type over a one-year trading period.
2.1.3. Machine-learning strategies
As the name suggests, machine-learning trading strategies use machine-learning techniques to determine trading opportunities. These types of trading strategy typically involve reinforcement learning [17, 18, 19]; but, for the purposes of this paper, an emphasis is placed on supervised learning. One example of a supervised machine-learning trading strategy may be found in the work of Dash and Dash [20]. The method they proposed uses an ensemble of technical indicators and a computationally efficient and functionally linked artificial neural network to forecast market trend turning points. The direction of the turning point then corresponds to either a buy or a sell trading signal.
2.2. Risk performance measures
It is critical for any trader to assess a trading strategy's performance. The natural choice is to evaluate the cumulative returns of trades executed according to the strategy and to compare these with the returns of benchmarking investment opportunities; but such comparisons lack any consideration of risk. In this section, we review three basic risk-centred performance measures that are commonly implemented in trading.
2.2.1. Return variance
Risk is most commonly expressed as the variance or dispersion of returns relative to the mean return, and may be calculated as

where rt is the return recorded for period i, η is the number of return observations, and f is the mean return. A trader may prefer to analyse the standard deviation of returns, which is the square root of the variance. The drawback of variance as a risk measure, however, is its simplicity. Variance risk measures assume that all returns are sampled from a normal distribution - an assumption that typically does not hold in real-world conditions [21]. It is worthwhile, therefore, also to consider the kurtosis and skewness of the return distribution.
2.2.2. Sharpe ratio
For any risk-averse trader, the returns associated with a specific trade should outweigh the risk of executing the trade. Given the choice between two different trades with identical returns, the trader will generally prefer the trade with the least estimated risk. In order to quantify this risk-return relationship, Sharpe [22] introduced the Sharpe ratio (SR) which represents the relationship between returns in excess of a risk-free rate and the variability of returns, calculated as

where ra is the return of a specific asset, rf is the return of a risk-free asset over the same trading horizon, and σα is the standard deviation of returns.
2.2.3. Drawdown periods
Trading strategies often experience periods of lacklustre performance during which unprofitable trading decisions are made. A trading strategy is required, therefore, to recoup the losses incurred during these unprofitable trading periods before returns can increase. This loss-and-recuperation period creates a trough in cumulative return curves, and is referred to as a drawdown period. Traders aim to minimise the risk of observing such a phenomenon by attempting to minimise the maximum percentage drawdown and/or the lengths of the drawdown period [23].
2.3. Multiple-criteria decision-making
Multiple-criteria decision-making refers to the situation where an individual has to make informed decisions by considering multiple (and often conflicting) criteria. These decisions are often characterised by their range of alternatives [24]. According to Hwang and Yoon [25], multiple-criteria decision-making may be disaggregated into either (1) multiple-attribute decision-making for selection between discrete alternatives or (2) multiple-objective decision-making for continuous or integer alternative selection. A popular method for discrete alternative decision-making is the TOPSIS method introduced by Hwang and Yoon [25]. TOPSIS involves the ranking of alternatives by calculating each alternative's distance from the ideal solutions and the worst solutions. The best alternative is one that minimises the distance to the ideal solutions and maximises the distance to the worse solutions, based on given criteria.
Consider, the example of η criteria and m alternatives captured in a m χ η decision matrix. The matrix values are normalised for the i-th criterion and the j-th alternative as
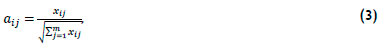
where xij is the value of criterion i for alternative This normalised matrix is combined with user-defined criteria importance weights wi to obtain new normalised weighted matrix values vij- = wiaij.
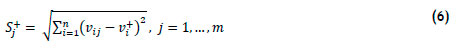
For each criterion, the positive ideal solution A+ and the negative ideal solution A~ are then calculated as

and

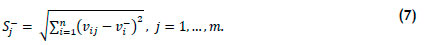
where 0' and 0" represent selected benefit and cost criteria, respectively. The η-dimensional Euclidian distances from the ideal solutions S+ and inadequate solutions S~ for each alternative are then obtained as
and
Thereafter, the closeness of each alternative to the hypothetical best solution is calculated as

These closeness values may be ranked in descending order, corresponding to the preferred selection order (and thus the relative importance) of each alternative [26, 27].
3. METHODOLOGY
The methodology underlying our proposed ATSDAT is based on the assumption that heterogeneous trading strategies are diverse in their generalisation capabilities. The methodology is aimed, therefore, at exploiting three primary considerations of heterogeneous trading strategies:
1. Different trading strategies identify different trading opportunities at different time intervals when applied to the same asset.
2. Two or more trading strategies may agree that a trading opportunity has occurred, but disagree about the desired type of trade (long/short), thereby incurring the risk that decisions according to a profitable trading strategy are overshadowed by those according to an unprofitable trading strategy.
3. A specific trading strategy may experience a drawdown period that may be compensated for by another, until a performance recovery is observed.
The proposed ATSDAT is scalable to η different trading strategies, but for ease of explanation, only three strategies are considered here.
Before any decision-making may begin, historical trading results are required for each trading strategy. For this purpose, each trading strategy is executed in parallel without entering the market. As soon as a trading opportunity is identified by a trading strategy, the trade is simulated until the trading strategy's closing criteria are encountered. A returns series Rj for each trading strategy j is then calculated as the percentage change in the closing price and the opening price for each trade, denoted by rjx for a specific trade x. The returns series after a day of trading may, for example, assume the form
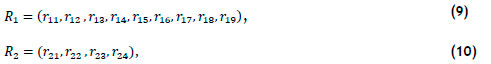
and

for three different trading strategies. In order to compare the returns of the trading strategies, each return rjx is then normalised to a daily return njx, calculated as
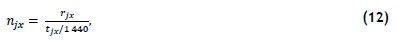
so as to obtain a new normalised return series Nj for trading strategy where tjx is the total duration of trade χ in minutes, and 1 440 represents the length of one day in minutes. The return series Rj and corresponding normalised returns series Nj are then continually updated during real-time trading.
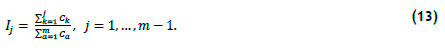
Once a sufficient number of historical trades have been identified for all trading strategies, the informed selection criterion values may be initialised. In order to obtain importance weightings for each trading strategy, the TOPSIS decision-making method is employed. Each trading strategy is labelled as an alternative Aj. Using a lookback period of the last k returns, performance metrics may be calculated that act as the different selection criteria. Along with user-defined criteria importance weightings wi, the closeness Cj of each criterion to the ideal and inadequate solutions is obtained. In addition to the η heterogeneous trading strategies, a risk-free investment is also considered to be available as a selection alternative, representing the decision to withhold all trading decisions.
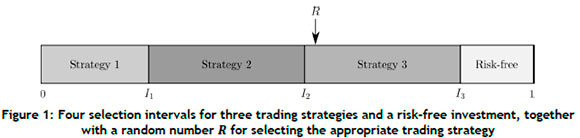
The problem with stochastic financial markets, however, is that recent performance is not necessarily indicative of future performance, and should only be viewed as a performance estimation. Given the stochasticity of financial markets, trading strategies often experience periods of profitability, only to lose all returns during the next trading period. It is unclear, therefore, whether a profitable strategy will remain profitable for the next trade or whether another losing strategy will change to a winning strategy. At any point in time, all alternatives should be considered for selection, but the probability of selection should be proportional to each trading strategy's recent trading success (assuming that there is a higher probability that a profitable trading strategy will remain profitable for the ensuing trade). Using the closeness scores Cj, these selection probabilities may be calculated by constructing proportionate selection intervals delimited by break points I1,...,Im-1, where
Using these selection intervals and a randomly generated number R e [0,1], trading strategies are stochastically selected, with the probability of selection being proportional to the strategy's recent performance, as illustrated graphically in Figure 1. The entire procedure is repeated as soon as any of the trading strategies identifies a new trading opportunity, forcing changes to occur in the series Rj and Nj, and resulting in newly calculated selection intervals. Owing to continual changes in the series Rj it is possible, therefore, that a trading strategy would be selected for which no trades had been identified before re-evaluating the selection process. As a result, the basic trading rule is invoked: that a selected strategy should have contributed a positive normalised return over the last trades in order to be allowed to execute an identified trade.
4. CASE STUDY
The proposed methodology was validated in the form of a practical case study based on the forex market in order to demonstrate the utility of the ATSDAT. During any calendar year, the forex market may be partitioned into three periods of different market volatility. Market volatility is high from January to May, after which market volatility drops during the northern hemisphere summer holidays over the period June, July, and August. Market volatility then increases again from September to December [28]. As intraday trading strategies often rely on market volatility, the ATSDAT was applied in the context of the AUD/CAD, AUD/NZL, EUR/USD, and USD/CHF forex currency pairs over the first volatile trading sessions of 1 January to 31 May in 2021 and 2022. The second volatile periods at the end of these calendar years were then used to perform appropriate parameter tuning for the following years.
A portfolio of three different trading strategies was created, containing the SO deterministic strategy [12], the probabilistic strategy proposed by Lui and Xiao [13], and the machine-learning strategy of Dash and Dash [20]. Trading decisions were performed over 15-minute time windows for each trading strategy, but take-profit and stop-loss conditions were evaluated every minute.
Upon reimplementation of the probabilistic trading strategy, it was found that there was insufficient information on how the MACD technical indicator trading strategy was fused with the remaining two technical indicator strategies. Necessary assumptions were made, but back-testing results indicated that the trading strategy's performance decreased with the inclusion of the MACD strategy, and so this strategy was removed from further consideration. Moreover, the machine-learning trading strategy was altered to incorporate a random forest model for ease of implementation.
A lookback window of k historical normalised returns for each trading strategy was used to generate the TOPSIS selection criteria. These criteria were
1. the mean normalised return (a benefit criterion),
2. the normalised return variance (a cost criterion),
3. the normalised cumulative return range1 (a benefit criterion), and
4. the Sharpe ratio (a benefit criterion).
These criteria were assigned importance weightings of w = (0.2,0.3,0.2,0.3), thereby assigning slightly more importance to risk-centred selection criteria (these weightings are subjective, and will differ from one trader to the next). The lookback window size k e {4,5,6} was selected as the best-performing lookback window duration when back-testing the ATSDAT on November and December market data (prior to real trading the subsequent year).
5. RESULTS
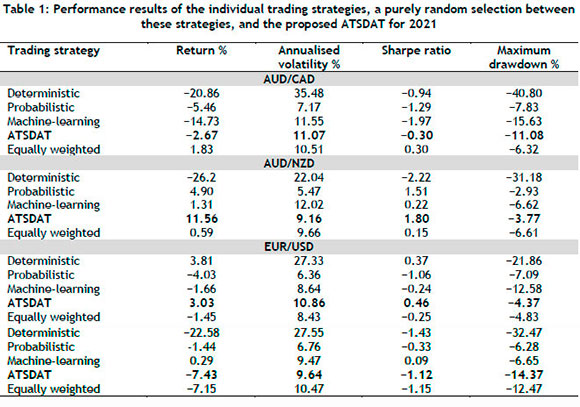
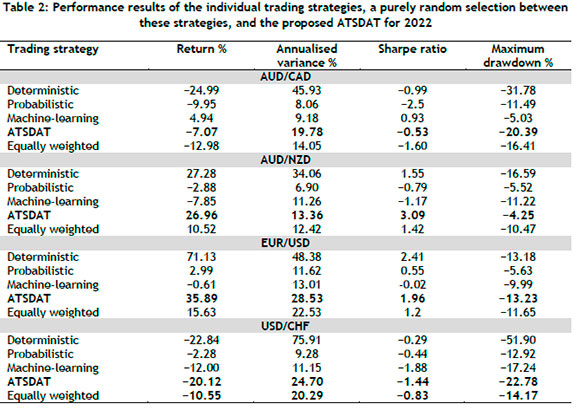
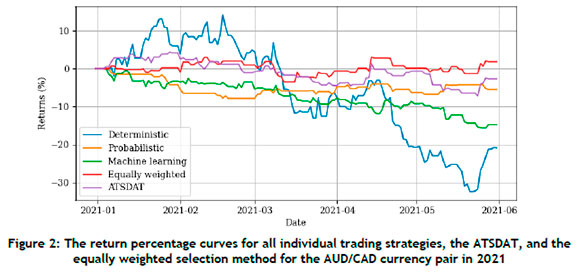
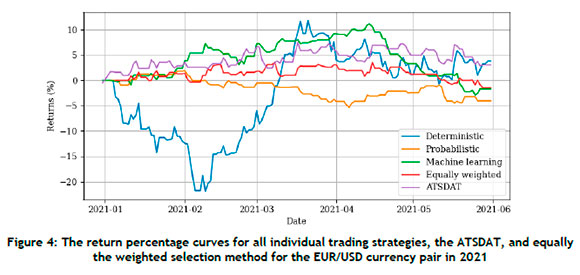
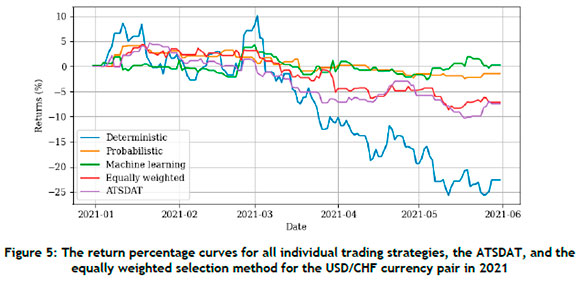
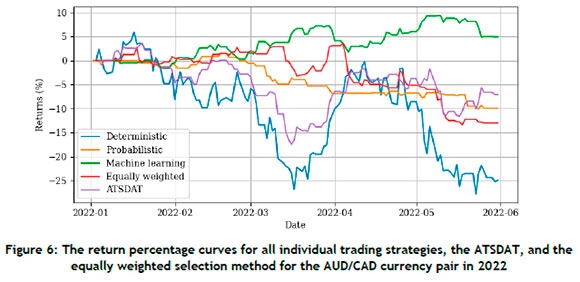
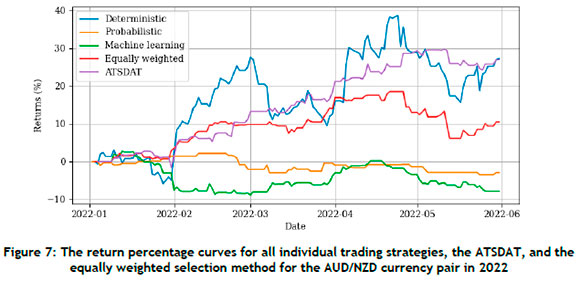
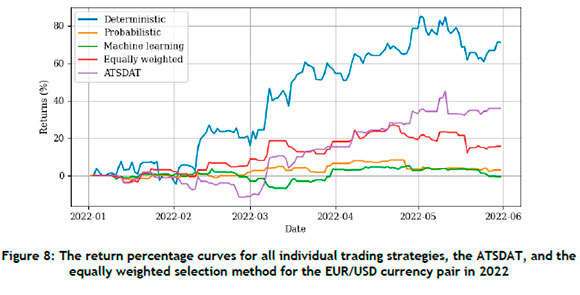
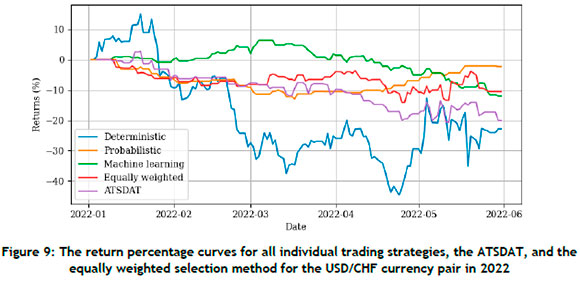
Each trading strategy was executed separately, along with the proposed ATSDAT ensemble of these strategies, over the five months' trading sessions for 2021 and 2022. A trading leverage of 1:100 was employed, a fixed broker commission fee of 0.0003 per trade was used, and a treasury bond was selected as the risk-free investment, which accumulated 0.7% in returns over a three-month period. In addition to the ATSDAT selection intervals calculated for the TOPSIS method, an equally weighted benchmark method (in which each alternative was assigned a 0.25 selection probability, irrespective of previous trading performance) was also simulated in order to gauge the performance of purely random selection, in comparison with the ATSDAT. The results obtained for the 2021 and 2022 trading sessions are provided in Table 1 and Table 2, respectively. The results of each trading session are also illustrated graphically in Figure 2 to Figure 9.

6. DISCUSSION
The performance of each domain-specific trading strategy may be evaluated, based on an in-depth interpretation of the results in Table 1 and Table 2. Starting with the deterministic strategy, high volatile returns may be observed (as a result of large numbers of trades in quick succession), resulting in periods of extreme profitability followed by periods of extreme unprofitability. Generally, periods of unprofitability were more commonly observed, resulting in overall losses. Surprisingly, however, the deterministic strategy seems to have favoured liquid markets such as the EUR/USD currency pair, noticeably generating 71.13% returns during 2022. This strategy may perhaps be viewed as a risk-seeking strategy, generating considerable returns when market conditions are suitable, but also carrying the risk of possibly losing all of those accumulated gains during the next trading period.
The probabilistic strategy may be viewed as a more conservative strategy. This strategy executed significantly fewer trades over each trading period, resulting in an intermittent daily return series. As a result, the strategy's overall return variance was noticeably lower than those of the deterministic and machine-learning strategies, which should be considered when analysing the strategies' annualised volatility percentages and Sharpe ratios. The machine-learning strategy would seem to provide a compromise between the inflated levels of volatility observed for the deterministic strategy and the relative trading inactivity associated with the probabilistic strategy.
Analysing the 2021 trading session (Table 1 ), the ATSDAT returned promising results. Considering first the AUD/nZD and EUR/USD currency pairs, the ATSDAT may be evaluated in the presence of profitable individual trading strategies. The ATSDAT provided good results when implemented on the AUD/NZD currency pair, outperforming all the individual trading strategies in respect of the return percentage and Sharpe ratio performance criteria. The probabilistic strategy, however, outperformed the ATSDAT according to the annualised volatility percentage and maximum drawdown criteria, owing to relatively few trades being executed by the probabilistic strategy. Overall, the ATSDAT was capable of successfully selecting trading strategies that generated significant returns while ignoring strategies that were generating losses.
The results for the EUR/USD currency pair achieved a similar performance. The ATSDAT strategy performed second-best under the return percentage criterion and third-best according to the annualised volatility percentage criterion. In the context of the Sharpe ratio, the ATSDAT outperformed all of the other contenders, indicating that the returns generated by the proposed methodology were more risk-averse. Moreover, the drawdown criterion indicates that the ATSDAT strategy was capable of withholding trades during periods of individual trading strategy drawdown, thereby further reducing the risk associated with executing trades.
Furthermore, the results for the AUD/CAD currency pair also indicate that the ATSDAT strategy was capable of reducing the risk associated with executing trades in the presence of unprofitable trading strategies.
The equally weighted random selection method, however, generated profitable returns (outperforming the ARSDAT), but was not able to replicate these results on reimplementation. The ATSDAT strategy was more reluctant to execute trades owing to the large selection proportion assigned to the risk-free investment. The same reasoning does not apply to the USD/CHF currency pair, for which the ATSDAT performed the second-worst, only improving on the underwhelming performance of the deterministic trading strategy. This lacklustre performance may be attributed to the volatile return series of the deterministic strategy, which contained alternating profitable and unprofitable trading days. As a result, the ATSDAT would use the profitable trading day to assign the majority of trading preference to the deterministic strategy, only to execute a trade on the unprofitable trading day. The results also indicate that the equally weighted random selection method marginally outperformed the ATSDAT.
The results of the 2022 trading session (Table 2) were similar to those of 2021. Starting once again with the profitable currency pairs (AUD/NZD and EUR/USD), the ATSDAT was capable of generating reasonable returns while reducing the risk associated with executing trades. According to the results for the AUD/NZD currency pair, the ATSDAT nearly reached the same return percentage as the deterministic strategy, but comfortably outperformed all individual trading strategies according to the Sharpe ratio and maximum drawdown percentage criteria. This indicates that the same level of profitability was reached while lowering the risk of executing a trade. Once again, the ATSDAT obtained the second-worst annualised volatility percentage, but this result may be misleading because of the relative trading inactivity associated with the probabilistic and machine learning strategies, resulting in low levels of return series volatility.
For the EUR/USD currency pair, the ATSDAT generated significant returns, but these were only slightly more than half the returns generated by the deterministic trading strategy. This reduction in returns is once again attributable to the volatility of the deterministic strategy's return series over alternating profitable and unprofitable days. As a result, the ATSDAT would use the majority of a profitable trading day to overcome the losing trades of the previous day, so as to obtain a positive average return and be allowed to execute a trade (as per the trading rule discussed in §3). This large difference in returns also caused the deterministic strategy's Sharpe ratio to exceed that of the ATSDAT; but, on closer inspection, it may be seen that the same ratio between the return percentages of the ATSDAT and the deterministic strategy does not apply to the Sharpe ratios. This shows that it was less risky to implement the ATSDAT.
The ATSDAT, however, underperformed for the AUD/CAD and USD/CHF currency pairs. For the AUD/CAD currency pair, the ATSDAT ranked second according to the returns and Sharpe ratio criteria, but suffered from high levels of maximum drawdown percentage. Moreover, the machine learning strategy generated noticeably more returns while maintaining relatively low levels of annualised volatility percentage and maximum drawdown percentage. The machine-learning trading strategy would therefore have been the preferred trading strategy for the 2022 trading session.
The same reasoning applies to the USD/CHF currency pair. Although all trading strategies were incapable of generating profitable returns, the losses of the ATSDAT far exceeded those of the probabilistic strategy, the machine-learning strategy, and the equally weighted random selection method. Once again, this suboptimal performance may be attributable to the volatile return series of the deterministic trading strategy, which contained alternating profitable and unprofitable trading days. The ATSDAT would, once again, use a profitable trading day to accumulate selection preference for the deterministic strategy, only to execute trades on the unprofitable trading day.
Analysing all of the results together, a few general comments may be made. First, the ATSDAT depends on the trading frequency of the strategies being ensembled. In this case study, the majority of the trades that were implemented were identified by the deterministic strategy owing to its high trading frequency and return volatility, which often exerted a considerable influence on the final return percentage (as best illustrated in Figure 6). Furthermore, the ATSDAT does not transform unprofitable underlying trading strategies into overall profitable trading strategies. The case study indicated that the ATSDAT performed well when presented with profitable trading strategies (providing up to a 99.4% improvement in the Sharpe ratio when compared with the next-best individual trading strategy), but underperformed more often when all of the underlying trading strategies were unprofitable. These lacklustre results are to be expected, as the ATSDAT aims to select trading strategies (with higher probability) that, at the time, are identifying profitable trades. This selection methodology is not effective, however, when the selected trading strategy's decisions create fluctuating profitable and unprofitable trading days. This phenomenon generally leads to lower returns when selecting a profitable trading strategy, or inflated losses when considering an unprofitable trading strategy. In addition, the results of Table 1 and Table 2 illustrate that the ATSDAT outperformed the equally weighted random selection method when presented with profitable trading strategies (thereby validating the importance of using a weighted importance selection methodology such as the TOPSIS method), but often trailed behind in performance when considering unprofitable trading strategies. The conclusion may be reached, therefore, that the effect of alternating profitable and unprofitable days has a smaller impact on the equally weighted random selection method. Finally, as the ATSDAT uses a random number generator, the results of two simulations over the same trading horizon will differ. The ATSDAT, therefore, increases the prospect of selecting the best trading strategy over a very long trading horizon.
7. CONCLUSION
In this paper, an ATSDAT was proposed for ensembling the decisions of three domain-specific trading strategies. The ATSDAT used the TOPSIS multiple-criteria decision-making methodology to assign importance weights to each heterogeneous trading strategy. The strategies were then selected for trading according to a weighted random selection process. In order to validate the proposed ATSDAT methodology, a case study was conducted in which each individual trading strategy and the ATSDAT were allowed to perform trades on four different currency pairs for the duration of two trading sessions in 2021 and 2022. The results indicated that the ATSDAT was capable of lowering the risk of executing a trade when presented with profitable trading strategies, but occasionally suffered from poor performance when all individual trading strategies were unprofitable.
In future work, the scope of our analysis may be broadened to consider additional selection criteria, as well as different combinations of criteria importance weightings such as, for example, comparing the difference in performance in respect of return-centred weightings or risk-centred weightings. These weightings may further be improved by performing a selection continuity test so as to ensure that the importance weightings are not contradictory. Finally, the ATSDAT may be expanded upon by comparing the TOPSIS methodology with other multiple-criteria decision-making methods.
REFERENCES
[1] K. Zbikowski, "Using volume weighted support vector machines with walk forward testing and feature selection for the purpose of creating stock trading strategy," Expert Systems with Applications, vol. 42, no. 4, pp. 1797-1805, 2015. [ Links ]
[2] G. Nuti, M. Mirghaemi, P. Treleaven, and C. Yinsaeree, "Algorithmic trading," Computer, vol. 44, no. 11, pp. 61-69, 2011. [ Links ]
[3] A. Chen, M. T. Leung, and H. Daouk, "Application of neural networks to an emerging financial market: Forecasting and trading the Taiwan stock index," Computers & Operations Research, vol. 30, no. 6, pp. 901-923, 2003. [ Links ]
[4] J. L. Ticknor, "A Bayesian regularized artificial neural network for stock market forecasting," Expert Systems with Applications, vol. 40, no. 14, pp. 5501-5506, 2013. [ Links ]
[5] B. Krawczyk, L. L. Minku, J. Gama, J. Stefanowski, and M. Wozniak, "Ensemble learning for data stream analysis: A survey," Information Fusion, vol. 37, pp. 132-156, 2017. [ Links ]
[6] L. Yu, S. Wang and K. K. Lai, "A novel nonlinear ensemble forecasting model incorporating GLAR and ANN for foreign exchange rates," Computers and Operations Research, vol. 32, no. 10, pp. 25232541, 2005. [ Links ]
[7] Y. Xu, C. Yang, S. Peng, and Y. Nojima, "A hybrid two-stage financial stock forecasting algorithm based on clustering and ensemble learning," Applied Intelligence, vol. 50, pp. 3852-3867, 2020. [ Links ]
[8] I. K. Nti, A. F. Adekoya, and B. A. Weyori, "A comprehensive evaluation of ensemble learning for stock-market prediction," Journal of Big Data, vol. 7, Manuscript 20, 2020. [ Links ]
[9] B. Weng, L. Lu, X. Wang, F. M. Megahed, and W. Martinez, "Predicting short-term stock prices using ensemble methods and online data sources," Expert Systems with Applications, vol. 112, pp. 258273, 2018. [ Links ]
[10] S. Jansen, Machine learning for algorithmic trading, Birmingham: Packt Publishing, 2020. [ Links ]
[11] A. De Santis, U. Dellepiane, S. Lucidi, and S. Renzi, "A derivative-free optimization approach for the autotuning of a forex trading strategy," Optimization Letters, vol. 15, pp. 1649-1664, 2021. [ Links ]
[12] A. Theophanopoulos, "The stochastic oscillator trading strategy guide," Admiral Markets, 9 May 2023. [Online]. Available: https://admiralmarkets.com/education/articles/forex-indicators/stochastic-oscillator [Accessed 13 May 2023]. [ Links ]
[13] Z. Lui and D. Xiao, "An automated trading system with multi-indicator fusion based on DS evidence theory in forex market," in 6th International Conference on Fuzzy Systems and Knowledge Discovery, Tianjin, pp. 239-243, 2009. [ Links ]
[14] J. W. Wilder, New concepts in technical trading systems, Greensboro (NC): Trend Research, 1978. [ Links ]
[15] D. R. Lambert, "Commodity channel index: Tool for trading cyclic trends," Technical Analysis of Stocks and Commodities, vol. 1, no. 5, pp. 120-122, 1980. [ Links ]
[16] G. Appel, The moving average convergence divergence trading method, Great Neck (NY): Signalert Corp, 1979. [ Links ]
[17] X. Wu, H. Chen, L. Troiano, and V. Loia, "Adaptive stock trading strategies with deep reinforcement learning methods," Information Sciences, vol. 538, pp. 142-158, 2020. [ Links ]
[18] Y. Li, P. Ni, and V. Chang, "Application of deep reinforcement learning in stock trading strategies and stock forecasting," Computing, vol. 102, pp. 1305-1322, 2020. [ Links ]
[19] Y. Li, W. Zheng, and Z. Zheng, "Deep robust reinforcement learning for practical algorithmic trading," IEEE Access, vol. 7, pp. 108014-108022, 2019. [ Links ]
[20] R. Dash and P. K. Dash, "Stock price index movement classification using a CEFLANN with extreme learning machine," in IEEE Power, Communication and Information Technology Conference, Bhubaneswar, 2015. [ Links ]
[21] G. Szegö, "Measures of risk," Journal of Banking & Finance, vol. 26, no. 7, pp. 1253-1272, 2002. [ Links ]
[22] W. Sharpe, "The Sharpe ratio," Journal of Portfolio Management, vol. 21, no. 1, pp. 49-58, 1994. [ Links ]
[23] L. Mendes, P. Godinho, and J. Dias, "A forex trading system based on a genetic algorithm," Journal of Heuristics, vol. 8, pp. 627-656, 2012. [ Links ]
[24] S. H. Zanakis, A. Solomon, and S. Dublish, "Multi-attribute decision making: A simulation comparison of select methods," European Journal of Operational Research, vol. 107, no. 3, pp. 507-529, 1998. [ Links ]
[25] C.-L. Hwang and K. Yoon, Multiple attribute decision making: Methods and application, New York (NY): Springer-Verlag, 1981. [ Links ]
[26] A. Kolios, V. Mytilinou, E. Lozano-Minguez, and K. Salonitis, "A comparative study of multiple- criteria decision-making methods under stochastic inputs," Energies, vol.9, no. 7, Manuscript 566, 2016. [ Links ]
[27] M. Hanine, O. Boutkhoum, A. Tikniouine, and T. Agouti, "Application of an integrated multi-criteria decision making AHP-TOPSIS methodology for ETL software selection," SpringerPlus, vol. 5, Manuscript 263, 2016. [ Links ]
[28] Admirals, "Best days of the week to trade forex," 3 February 2023. [Online]. Available: https://admiralmarkets.com/education/articles/forex-strategy/best-days-of-the-week-to-trade-forex [Accessed 10 May 2023]. [ Links ]
* Corresponding author: koegelenbergcoetzee@gmail.com
ORCID® identifiers
D.J.C. Koegelenberg: https://orcid.org/0000-0002-7531-3226
J.H. van Vuuren: https://orcid.org/0000-0003-4757-5832
1 The cumulative return range is obtained by transforming the lookback return series into normalised cumulative return series and summing the maximum and minimum values in the range, thereby capturing any peaks and troughs caused by return volatility. A higher cumulative return range is more beneficial, and is indicative of less volatile upwards trending return series.

