


Services on Demand
Article
 English (pdf)
 Article in xml format
 Article references
Indicators

Related links
-
 Cited by Google
 -
 Similars in Google
Share

 Permalink
South African Journal of Industrial Engineering
On-line version ISSN 2224-7890
Print version ISSN 1012-277X
S. Afr. J. Ind. Eng. vol.34 n.3 Pretoria Nov. 2023
http://dx.doi.org/10.7166/34-3-2941
SPECIAL EDITION
Diagnosis prediction using knowledge graphs
H. Parshotam*; G.S. Nel
Stellenbosch Unit for Operations Research in Engineering, Department of Industrial Engineering, Stellenbosch University, Stellenbosch, South Africa
ABSTRACT
Consultations between doctors and patients form the basis of the interaction between both parties, and lay the groundwork for administering appropriate treatment. Advances in machine learning, information, and communication technologies have enabled healthcare practitioners to enhance the manner in which data are captured and analysed during these information-rich meetings.
The true potential of clinical data can only be realised if clinical data sources are synthesised in an appropriate data-representation and modelling approach. One such approach is the so-called knowledge graph (KG). The aim in this paper is to model consultation-related data in a KG and thereafter employ graph machine-learning techniques to identify missing links between entities in the graph through link prediction, thereby providing additional decision support to doctors. A case study data set comprising a list of patients, their respective conditions, and their medications forms the basis of the algorithmic analysis that is carried out.
OPSOMMING
Konsultasies tussen dokters en pasiënte vorm die basis van die interaksie tussen beide partye, en lê die grondslag waarop toepaslike behandeling toegedien kan word. Vooruitgang in masjienleer-, inligting- en kommunikasietegnologieë het gesondheidsorgpraktisyns in staat gestel om die wyse waarop data vasgelê en ontleed word tydens hierdie inligtingryke vergaderings te verbeter.
Die ware potensiaal van kliniese data kan slegs verwesenlik word indien kliniese databronne gesintetiseer word in 'n toepaslike data-voorstelling en modelleringsbenadering. Een so 'n benadering is 'n die sogenaamde kennisgrafiek (KG). Die doel in hierdie artikel is om konsultasieverwante data in 'n KG te modelleer en daarna om grafiekmasjienleertegnieke te gebruik om afwesige skakels tussen entiteite in die grafiek te identifiseer deur skakelvoorspelling, en sodoende addisionele besluitsteun aan die dokters te verskaf. 'n Gevallestudiedatastel wat 'n lys van pasiënte, hul onderskeie toestande en hul medikasie bevat, vorm die basis van die algoritmiese analise wat uitgevoer word.
1. INTRODUCTION
Advances in machine learning (ML) and information and communication technologies have enabled healthcare practitioners to reevaluate the manner in which medical consultations and procedures are performed [1]. Patient data captured by healthcare technologies are conventionally consolidated into so-called electronic health records (EHRs), which contain a variety of patient-related information such as diagnoses, medications, allergies, lab results, and radiology images, to name but a few (Sun, et al., 2018). EHRs therefore present potential value for deriving clinical insights through various data-driven
methodologies - the most prominent of which are ML algorithms - as they can contain vast amounts of patient data pertaining to a broad range of medical concepts. In order fully to realise this potential, however, EHRs should be formatted and expressed according to an appropriate data representation that is capable of handling vast amounts of inter-related heterogenous data. One such approach is the so-called KG, which is a graph database in which information is expressed in the form of a graph structure [3].
A graph, denoted by G = (V, ε), can be defined as a representation of a network comprising a set of vertices (or nodes) V = [v1,v2,vn], denoted by V(G), that are inter-connected by a set of edges ε= (e1, e2,en), denoted by £(G). A node may be regarded as a representation of a real-world object that can, in turn, be connected to other real-world object(s) - i.e., nodes are connected via one or more edges, representing real-world relationships [4]. In the context of a clinical setting, nodes may be employed to represent entities such as patients, diseases, or different types of medication. Possible edges may include a 'has' edge, which denotes the relationship between a patient and a disease, or a 'prescribed' edge, denoting the relationship between a patient and a medication. KGs are capable of modelling both explicit and latent relationships between information sources, and can capture linked information, such as entity relationships, that other data models (i.e., tabular relational databases) fail to capture (especially at scale). This property can help healthcare practitioners by revealing an abundance of relevant information from which insightful correlative and causal information can be inferred in respect of a variety of data sources.
Real-world KGs are often regarded as complex data models comprising vast amounts of relational data; for example, the Google Knowledge Graph [5], which constitutes a large part of the analytical foundation of Google's search functions; the Wikidata Knowledge Graph [6]; and IMB's Watson Knowledge Catalog [7]. Furthermore, the task of defining generalised structural priors1 for graphs is rather difficult, as each node has a unique neighbourhood structure [8]. These challenges have led to the establishment of the research domain of geometric deep learning (GDL), which focuses on the application of deep learning techniques to non-Euclidean data [9]. A popular GDL method for graph-structured data is graph representation learning (GRL), which aims to learn low-dimensional continuous vector representations, also referred to as embeddings, from graph-structured data [8]. These embeddings may then be used to perform different graph ML tasks such as node classification [10], link prediction [11], community detection [12], and graph classification [4].
In a clinical setting, link prediction may be employed to uncover new relationships between patients and medical concepts, thus providing healthcare practitioners with decision support while also enriching the medical KG with additional information. In this paper, an end-to-end pipeline for the construction and analysis of a patient-related medical KG is proposed. The analysis of the constructed KG is underpinned by graph-based link prediction methods that, in conjunction with the end-to-end nature of the pipeline, represent a novel contribution. The graph comprises three node types: patient nodes, condition nodes, and medication nodes. The analysis component of the pipeline is underpinned by the application of graph neural networks (GNNs) [13] to the task of predicting new links between patient and condition nodes, and consequently facilitates the task of diagnosis prediction using KGs.
The remainder of this paper is organised as follows. In Section 2, an overview of related work is provided, after which the proposed framework and the methodology adopted in the study are discussed in Section 3. In Section 4, the results obtained from the proposed framework's implementation are discussed, followed by a description of the data set, the adopted algorithmic approaches, and the evaluation metrics employed during implementation. Last, in Section 5, an overview of the work discussed in the article and recommendations for future work are provided.
2. RELATED WORK
In this section, an overview of related work on KGs and graph ML in a clinical setting is provided.
2.1. Medical KG construction
Modelling patient-related data as a KG, as reviewed by Schrodt et al. [14], is a relatively recent field of research which applies to a large variety of use cases in the clinical domain. Clinical data sources contain large amounts of latent information that may be leveraged for the purposes of diagnosis prediction, personalised patient care, improved decision support, and other clinical applications [15].
The generic principle underpinning KG construction involves extracting entities and relations from data sources (structured and/or unstructured) that are subsequently used to generate the respective nodes and edges of the KG. Al-Mosini et al. [16] provide an overview of popular approaches employed to perform entity extraction from unstructured text data, such as named entity recognition (NER) [17], named entity disambiguation [18], and named entity linking [19]. The process of constructing a KG from structured data sources, however, can be performed with greater ease, as the entities and relations are typically represented in a tabular format - i.e., rows and columns - thereby simplifying the extraction process. Chang et al. [20] employed named entity recognition and relation extraction methods to construct a diabetes KG, comprising 22 050 entities and 6 800 relations from a data set derived from 41 diabetes guidelines. Cheng et al. [21] employed standardised medical terminology to develop a relationship classification system for identifying stroke-related medical entities from which a stroke KG was derived. Li et al. [22] proposed a systematic approach to constructing a KG from EHR records that comprised eight steps: data preparation, entity recognition, entity normalisation, relation extraction, property calculation, graph cleaning, related-entity ranking, and graph embedding.
2.2. Graph representation learning
Traditional graph-based analytic methods can falter in certain cases when attempting to process the computational complexity associated with large real-world graphs that are characterised by notable sparsity, high dimensionality, and considerable heterogeneity. Graph embeddings address this issue by converting graph data into a lower dimensional vector space while preserving the structural properties of the graph [23]. Given a graph G = (V,ε) and a predefined dimensionality d, where d « a graph embedding seeks to transform G into a d-dimensional space Rd that preserves the information and properties of G as best possible [11]. The notion of graph embeddings is derived from the popular encoder-decoder framework proposed by Hamilton et al. [9], depicted in Figure 1 in which an encoder maps each node in the graph to a low dimensional vector (i.e., embedding), while a decoder function employs this low-dimensional vector embedding to reconstruct information regarding each node's neighbourhood structure in the original graph [9].
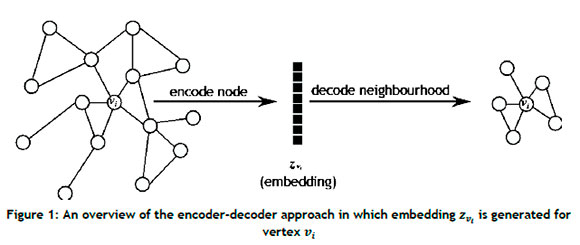
An encoder, denoted as (ENC), can be defined as

which maps nodes vi e V to vector embeddings zv. e Rd, where zvi. denotes the real-valued d-dimensional vector embedding of node The decoder receives the set of node embeddings from the encoder as input, and reconstructs the neighbourhood structure of the nodes using specific graph statistics obtained from the embeddings. A standard pairwise decoder, denoted (DEC), may be defined as

The aim of the encoder-decoder approach is to minimise the reconstruction loss (or error) so that

where SG[vi, Vj] is a matrix denoting a graph-based similarity measure quantifying the relationship between nodes Vi and Vj defined over the graph G, where vi, Vj e V [9].
2.3. Graph neural networks
Graph neural networks (GNNs) are deep-learning models that have been adapted for graph-structured data and are based on the notion of neural message passing, according to which embeddings are propagated between nodes and updated algorithmically [24, 25]. Consider a graph G = (V, ε) with feature matrix X e Rv , which is used to generate node embeddings zv. for all vi e V, where i e 1, ... , n, ... , \V\. In each iteration of message passing k e 1,...K, a hidden embedding hvik is updated for each node vi e V according to information collected from its neighbourhood K(vi), which can be expressed as
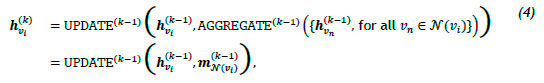
where UPDATEk-1 and AGGREGATEk-1 are arbitrarily differentiate functions - e.g., convolutional neural networks - and mn(vi)k-1 denotes the message that is aggregated from the neighbourhood structure of node vi, and hvikis initialised to the input features of the node, i.e., hvi0 = xvi, where xvi. e Rd for all vi e V. After Κ iterations have elapsed, the node embedding zvi. = hvik, for all vieV is obtained [2]. GNNs have been employed for a variety of clinical tasks such as classification, prediction, segmentation, and reconstruction tasks employing unstructured and/or structured data [26]. Li et al. [27] proposed a GNN framework to determine neurological brain biomarkers associated with disorders, while Anirudh et al. [28] proposed a graph-based approach for autism spectrum disorder classification. Furthermore, Guo et al. [29] developed and proposed a GNN approach called the graph-pair based link prediction (GPLP) model to predict biomedical network links based on the inherent topological interaction information. The model was evaluated using three heterogeneous data sets associated with drug-target interaction networks, compound-protein interaction networks, and compound-virus inhibition networks. Wang et al. [30] applied graph convolutional networks (GCNs) to analysing and predicting a health risk prediction score with respect to patient comorbidities. The graph employed in this study comprised patient and condition nodes, with 750 000 patients and 42 unique conditions.
2.4. Existing frameworks
Santos et al. [31] proposed a detailed framework for the construction of a KG, called the clinical knowledge graph (CKG), for the purpose of analysing clinical proteomics data. CKG comprises approximately 20 million nodes and 220 million relationships that contain information extracted from a combination of experimental data, public databases, and other relevant literature. The CKG framework comprises four main phases. One of the phases facilitates the processing of available proteomics data. Another phase then extracts entities, relations, and properties from the processed data, after which the CKG is constructed, while a different phase is responsible for connecting to the graph database in order to execute user-specific queries. The final phase provides the user with data visualisation and analysis through online reports that facilitate the application of graph ML approaches.
Similarly, Haroune et al. [32] proposed a framework for knowledge extraction from biomedical clinical notes using bidirectional encoder representations from transformers (BERT) [33] and a conditional random field (CRF) [34] layer. The working of their framework involves constructing a biomedical KG for the purpose of question-answering and graph feature analysis, such as identifying the most commonly used medication or identifying the most prominent reason for using a specific medication. A notable paper by Pham et al. [35] proposed a framework for constructing a KG with the purpose of performing multi-label classification to predict multiple diseases based on the observed data. Lu et al. [36] constructed a disease network from a patient-disease graph, and proposed a framework that employs recommender systems for predictive risk modelling of chronic diseases. Current frameworks pertaining to clinical knowledge graphs focus on either construction or analysis. Consequently, a need is identified to develop a unified end-to-end framework for constructing, analysing, and deriving insights from a patient-consultation-based KG by means of link prediction.
3. METHODOLOGY
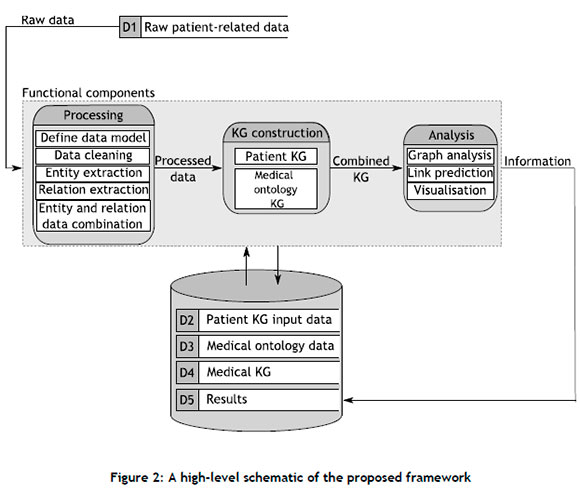
In this section, an end-to-end framework that facilitates the construction and subsequent link prediction analysis of a clinical KG comprising patient-related data is introduced. The framework addresses the need for a generic pipeline concerned with developing insights from a clinical KG by means of graph-based methods, thereby leveraging the benefits inherent to graph-structured data. A high-level schematic of the framework is presented in Figure 2 it comprises three functional components: Processing, KG construction, and Analysis. The combination of these three functional components results in a unified framework that is capable of facilitating the construction of a clinical KG from which new links between the entities of the graph are predicted.
3.1. Processing component
The Processing component comprises five distinct modules: Define data model, Clean data, Entity extraction, Relation extraction, and Entity and relation data combination. The graph data model, defined in the first module, serves as a generic schema for the graph database, illustrating the types of node that constitute the graph database, the different relationships that connect these nodes to one another, and the properties associated with each node and relationship type. In a clinical setting, a data model may describe how different medical concepts such as diseases, patients, medications, and procedures are connected to one another through specific edges. A notable feature of the data model is that its construction is based on the end requirements of the graph database; and therefore decisions regarding node, edge, and property classification should align accordingly.
The raw data are then cleaned in accordance with the methodology outlined by the data preparation phase of the CRISP-DM lifecycle [37]. The raw patient-related data may be obtained from sources such as doctor-patient consultations, EHRs, and other similar medical data sources, which may further comprise information such as symptoms, conditions, diseases, prescribed medications, and procedures or treatments. Thereafter, the entities that serve as the nodes of the graph (defined in the data model) are extracted from the cleaned data. The entity extraction approach depends on the format of the cleaned data. For example, if the data assume the form of an unstructured text document (such as an EHR), NLP techniques ,i.e. NER, may be employed, such as the pipeline proposed by Li et al. [22]. If, however, the data are presented in a structured format, the entity extraction process is simplified, and may be performed by employing more rudimentary rule-based approaches.
The subsequent relation extraction process involves identifying and establishing the relation(s) between entities. The relationship types, along with their respective end-node types and orientations, are defined in the graph. Similar to the entity extraction process, the method employed during the relation extraction process also depends on the format of the cleaned data. In the case of unstructured text data, a number of approaches may be employed: rule-based methods that employ sentence patterns and trigger verbs [38], ML models (random forests [39]), or deep-learning methods based on transformer architectures such as DistilBERT [38, 40]. Last, the entity and relation data are consolidated and represented in a format that is appropriate for constructing the clinical KG.
3.2. KG construction component
The KG construction component comprises two key modules, namely: The Patient KG and Medical ontology KG. The KG construction component constructs a KG that contains both patient-specific information as well as normalised medical information so as to avoid unnecessary complications within the graph representation. For example, numerous patients may exhibit flu symptoms that range in severity, onset times, and other properties. Representing each patient's flu node with different properties would lead to a duplication of information, as the same overarching concept would be expressed repetitively, rendering it more challenging to derive insights from it. By linking each patient-specific flu node to a flu node normalised by some medical ontology database, both patient-specific and general medical information are captured. The extent to which this process is carried out depends on the level of specificity of the input data and the objective of the KG. The construction of the Patient KG is performed by generating the respective nodes and relations, together with their associated features from the combined entity and relation data (i.e., the edge list). While a larger number of node and relation features can help to produce an informative graph database, it will more likely result in increased computational complexity when deriving insights during downstream modules.
The extent to which the Medical ontology KG is constructed depends on the stored input data and the aim of the complete KG. In some cases, the data used to construct the patient KG already contain specific ontological information, such as codes or normalised descriptions. Furthermore, the aim of the complete KG may be to represent a generalised high-level overview of the manner according to which patients and medical concepts interlink, instead of modelling patient-specific data. In such instances, the ontological information already forms part of the inherent data structure, and it is therefore deemed unnecessary to construct a separate Medical ontology KG explicitly. If, however, the ontological information is not present in the input data and the goal of the complete KG is to include patient-specific information, then a separate Medical ontology KG should be constructed. To this end, steps similar to those of the Patient KG construction are carried out (which may also require data pre-processing prior to construction). The graphs are then connected to one another, resulting in a complete KG comprising patient-specific information and normalised medical knowledge.
3.3. Analysis component
The final component of the framework is responsible for deriving clinical insights from the complete KG. The first step of the Analysis component involves understanding the underlying structure of the KG through visualisation and feature analysis, which may include measuring the connectedness of the graph, understanding the degree distribution of the nodes, identifying prominent nodes within the graph, and simplifying the graph structure by removing uninformative community structures, to name but a few. After identifying the specific graph features, a decision regarding the appropriate link prediction approach(es) can be made, which include heuristic-based approaches such as the Adamic-Adar index [41], preferential attachment [42], and the Jaccard coefficient [43]; supervised machine-learning models such as random forest [39] and support vector machines [44]; and, finally, deep geometric learning models such as GNNs [2]. The chosen link prediction approach is then applied and evaluated according to user-specified evaluation metrics. A common evaluation metric employed to assess link prediction tasks is the area under the receiver operating characteristic (AUROC) curve, which has been employed in many studies [45, 46, 47]. Link prediction data sets, however, are often characterised by an imbalanced distribution between existing edges (positive class) and absent edges (negative class), therefore rendering the AUROC metric slightly less effective [48]. Fortunately, Yang et al. [49] recommended the area under the precision-recall curve (AUPR) owing to its suitability for notable class imbalances.
3.4. Framework implementation
In this section, the proposed framework and its constituent components are implemented to showcase its ability to be employed practically. In this paper, synthetically generated EHR data are considered as the input for the proposed framework. Real-world patient data represent markedly sensitive information and, as a result, access to these data sources often presents a variety of challenges relating to privacy, security, and intellectual property. Synthetic data generated using real-world clinical statistics therefore represent a more viable option, given the scope of this study, as synthetic data generation can approximate patient populations while mitigating the privacy challenges associated with sensitive real-world patient data. A number of prominent studies adopt this approach [50, 51, 52, 53]. The input data selected for this study also include medical ontological information in the form of Snomed_CT [54] and RxNORM [55] codes.
3.4.1. Processing component
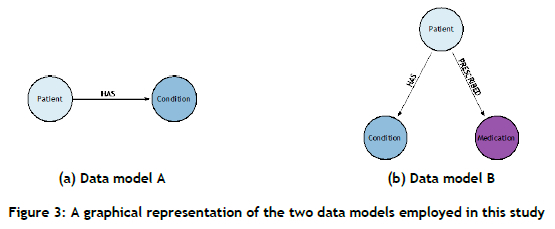
In this paper, raw patient-related data are obtained from Synthea [56], an open-source synthetic EHR generator that is capable of replicating real-world patients and their associated medical histories by employing population statistics. The data generated by Synthea are provided in a tabular format (a .csv file2); each data file contains information relating to the specific medical entity. The aim of the KG constructed for this study is to present a generic high-level overview of the systematic manner in which patient data are interlinked, and to predict (future) links between patient and condition nodes that represent clinical decision support. To this end, the data model constructed includes a patient node, a condition node, and a HAS relationship, as shown in Figure 3(a). Furthermore, a second data model, presented in Figure 3(b), is introduced that contains an additional medication node and a PRESCRIBED relationship, the aim of which is to investigate the effect of supplementing the graph with additional information in order to predict new links between patient and condition nodes. Raw patient-related data are generated, based on two different sizes, i.e. 1 000 patients and 10 000 patients. The generation of two data sets facilitates a more comprehensive evaluation of the performance of the selected link prediction approach with respect to data set size.
3.4.2. KG construction component
A KG graph is constructed for both data sets (i.e., 1 000 patients and 10 000 patients) in respect of both data models (Data model A: patient and condition nodes; Data model B: patient, condition, and medication nodes), resulting in a total of four different KGs, each of which has the properties presented in Table 1
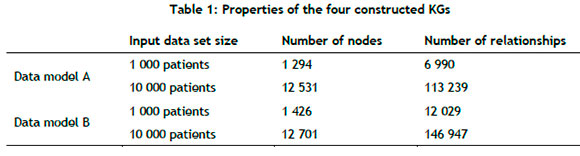
Medical ontology information for both conditions and medications were appended to the input data; therefore a separate medical ontology KG was not necessary. The condition and medication nodes have their descriptions as input features, which are subsequently converted to embeddings during the processing step.
3.4.3. Analysis component
The link prediction algorithmic approach employed in this study relates to GNNs. The clinical KGs constructed in this study contain detailed information (e.g., heterogenous nodes containing embeddings as features), rendering the application of GNNs the preferred choice for deriving clinical insights. To the best of the authors' knowledge, predicting new links between patient and disease nodes within the KG constructed by means of the proposed end-to-end pipeline is novel. Various studies in the literature [2, 7] report that GNNs are suitable for performing operations on information-rich graph-structured data sets; given the nature of the constructed KGs, the application of GNNs is warranted. Four different GNN algorithms are considered during the Analysis component, and are delineated below.
GraphSAGE
GraphSAGE, proposed by Hamilton et al. [9], is a generic inductive approach that employs node feature information efficiently to generate node embeddings in respect of unseen data. GraphSAGE approximates a function that samples and aggregates the features of a node's local neighbourhood so as to generate embeddings, defined as

and

where σ denotes a differentiate nonlinear activation function (e.g., LeakyReLU), Wk is a learned weight matrix, and || represents the concatenation operator. For the sake of simplicity, the iteration counter k is omitted from Wk hereafter.
Graph attention networks
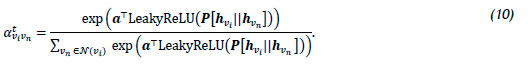
Graph attention networks (GATs) [57] represent a novel GNN architecture that leverages masked self-attention layers to overcome the limitations associated with previous graph convolution-based methods, such as GraphSAGE. The GAT architecture comprises multiple graph attention layers, each containing multiple attention heads, denoted by te 1,2,..., Γ, operating in parallel with one another. At each attention head, the normalised attention coefficient is aviVn, where vn e N(vi) is computed. The attention coefficient indicates the importance of the features of the neighbours vn on node vi, and is computed using the self-attention mechanism, defined as
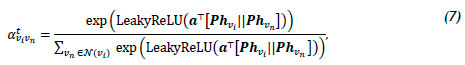
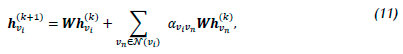
where Ρ is the weight matrix associated with a linear transformation that is applied to each node, a is the weight vector of a multi-layer perceptron containing a single hidden layer, and the embeddings hvi, hVn, and hvn correspond to the previous attention layer (k - 1), which is omitted from (7) for the sake of simplicity. The hidden embedding hvik is defined as
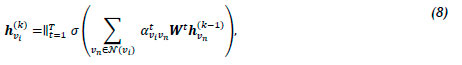
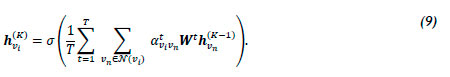
where Wt is the input linear transformation's weight matrix corresponding to atvivn. For the final layer K, concatenation is no longer deemed sensible, and thus averaging is employed [57]. The final embedding hvik is defined by
GATv2
GATv2 was proposed by Brody et al. [58], and addresses a limitation of the original GAT architecture. Brody et al. highlight that the main issue with the standard GAT scoring function in (7) stems from the learned layers Ρ and a being applied consecutively, resulting in their being collapsed into a single linear layer. The resulting computation therefore corresponds to a standard linear transformation. In order to address this limitation, the a layer is employed after the nonlinearity - i.e., LeakyReLU - while the Ρ layer is employed after the concatenation, thereby transforming the scoring function (7) into
Graph transformer operator
The graph transformer model, inspired by the unified message passaging model of Shi [59], applies the basic multi-head attention mechanism of the transformer architecture [60] to the graph learning context while taking into account edge features. The corresponding computation is given by
where the attention coefficients aviVn are computed via the multi-head attention [61].
4. RESULTS
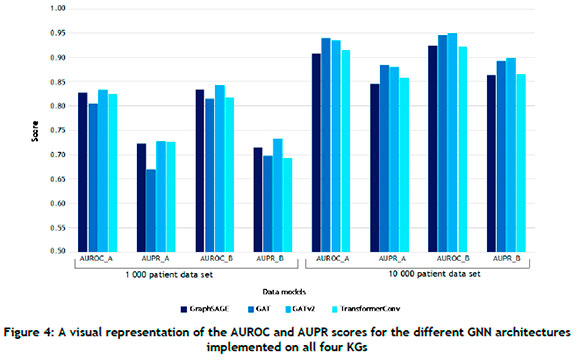
The aforementioned GNN architectures were implemented in PyTorch Geometric (PyG) [61], a Python library for building and training GNNs. All computations were performed using a 2.3GHz quad-core Intel i5 processor with 8GB RAM. For each of the four clinical KGs, an 80:10:10 split was used for the training, validation, and testing sets respectively. During training, 30% of the initial training set's edges were employed as ground-truth labels for supervision during message-passing. Each GNN architecture was implemented with a learning rate of 0.001, and trained over fifty epochs with a total of four layers to enable more complex abstractions to be modelled from the graph data. Two evaluation metrics, AUROC and AUPR, were used, which were calculated for all four GNN architectures on each clinical KG. In order to ensure statistical reliability within the stochastic context (owing to the GNN weights being randomly initialised), the evaluation was performed across 30 separate runs and subsequently averaged to determine the performance of the models on the two different data set sizes, i.e. 1 000 patients and 10 000 patients. The average AUROC and AUPR values, along with their respective standard deviations, are summarised in Tables 2 and 3.
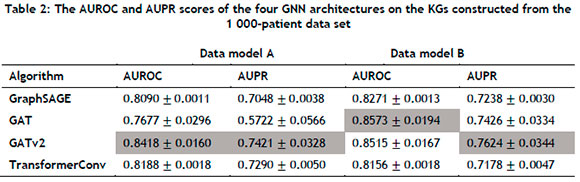
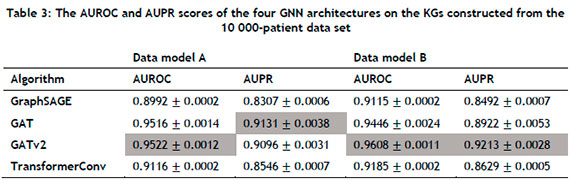
For the 1 000-patient data set, the GATv2 architecture consistently outperformed its counterparts in Data model A, attaining AUROC and AUPR scores of 0.8418 and 0.7421 respectively. The GAT architecture achieved the best AUROC score in Data model B, while the GATv2 architecture performed the best with respect to the AUPR metric. Furthermore, the AUROC and AUPR scores of GraphSAGE, GAT, and GATv2 were higher in Data model B than in Data Model A, indicating that supplementing the graph with additional information could yield improved performance in the case of some GNN architectures. For the 10 000-patient data set, the GATv2 architecture performed the best with respect to the AUROC metric, while the GAT architecture achieved the highest AUPR score. In Data model B, the GATv2 architecture exhibited exemplary performance, achieving an AUROC score of 0.9608 and an AUPR score of 0.9213. Notably, these scores represented the highest observed metrics across all evaluated models. The results summarised in Table 3 were also consistently superior when compared with those of Table 2, suggesting that the GNN architectures could successfully leverage larger KGs for improved performance. A visual representation of the results summarised in Tables 2 and 3 is presented in Figure 4 from which it can be seen that the KG containing the largest extent of information - i.e., the largest number of node types, the largest number of relation types, and the largest input data size - corresponded with the best scores for both evaluation metrics.
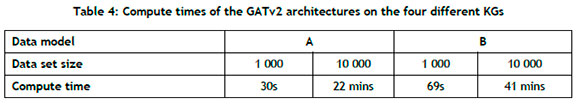
The GraphSAGE algorithm yielded the shortest computational time across all four KGs, but was outperformed by its counterparts in most cases. Table 4 summarises the computational times across the different data models and data set sizes for the GATv2 architecture, from which it can be noted that supplementing the graph with additional information would require a longer compute time.
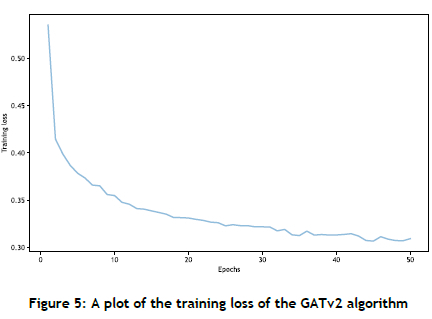
In Figure 5 the training loss of the GATv2 algorithm is plotted against the number of epochs. The training loss decreases with an increase in the number of epochs, indicating improved performance and convergence of the GATv2 algorithm, which signifies that multiple epochs are beneficial for reducing training loss.
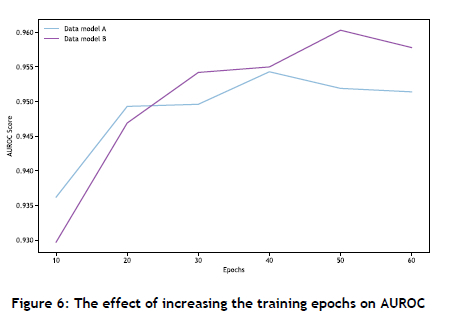
The performance sensitivity of the GNN architectures was analysed with respect to their learning rate, epochs, and number of layers. Employing a smaller learning rate was found to improve performance, while increasing the number of layers resulted in improved scores for the evaluation metrics. Increasing the number of training epochs corresponded with enhanced performance, but eventually reached a saturation point, as shown in Figure 6 Furthermore, the algorithms were only slightly affected by the removal of node features from the KGs, with a decrease in AUROC of about 1%, indicating that the GNNs could derive sufficient information from the graph structure alone. The framework was further verified on a MovieLens [62] data set comprising 100 000 nodes, where it was tasked with predicting new links between movie and user nodes. The framework achieved an AUROC score of 0.9231 (GraphSAGE), which was comparable to the score of 0.9299 achieved by PyG [61].
5. CONCLUSION
In this paper, a novel end-to-end framework for constructing and deriving insights from a patient-related KG is proposed. The framework facilitates the generic construction of a clinical KG for the purpose of predicting new links between certain nodes in the graph. In particular, this study focuses on predicting new links between patient and condition nodes, thereby facilitating the task of diagnosis prediction. The framework is then applied to two synthetically generated EHR data sets of different sizes in an attempt to demonstrate its practical utility. Two distinct data models are generated from the aforementioned data sets in order to assess the effect of supplementing the graph with additional node and edge types. The link prediction analysis is performed using GNNs that yield promising results with respect to the selected evaluation metrics. The results further reveal that a KG induced from a larger input data set (comprising a more extensive data model) yields improved performance in respect of the majority of the selected GNN architectures. This further substantiates the utility of employing KGs and GNN architectures in the context of clinical data - a domain in which a large collection of entities is typically interconnected.
With respect to future work, statistical testing could be conducted in respect of the algorithmic performance data to determine whether a statistically significant difference were present between the different algorithmic approaches. While the current study serves as a proof-of-concept, applying the framework to a real-world patient data set could provide significant insight into ascertaining the true viability of this approach as a real-time clinical decision support system that could assist healthcare practitioners.
REFERENCES
[1] R. Kalakota and T. Davenport, "The potential for artificial intelligence in healthcare," Future Healthcare Journal, vol. 6, no. 2, pp. 94-98, 2019.4 [ Links ]
[2] W. Sun, Z. Cai, Y. Li, F. Liu, S. Fang, and G. Wang, "Data processing and text mining technologies on electronic medical records: A review," Journal of Healthcare Engineering, vol. 2018, pp. 1-9, 2018. [ Links ]
[3] V. K. Chaudhri, C. Baru, N. Chittar, X. L. Dong, M. Genesereth, J. Hendler, A. Kalyanpur, D. B. Lenat, J. Sequeda, D. Vrandecic, and K. Wang, "Knowledge graphs: Introduction, history, and perspectives," AI Magazine, vol. 43, no. 1, pp. 17-29, 2022 [ Links ]
[4] W. L. Hamilton, Graph representation learning, Montreal: Morgan and Claypool Publishers, 2020. [ Links ]
[5] A. Singhal, "Introducing the knowledge graph: Things, not strings," Google, 16 May 2012. [Online]. Available: https://www.blog.google/products/search/introducing-knowledge-graph-things-not/ [Accessed 4 June 2023]. [ Links ]
[6] D. Vrandecic and M. Krötzsch, "Wikidata: A free collaborative knowledgebase," in Proceedings of the 13th International Conference on Semantic Systems, Amsterdam, 2017. [ Links ]
[7] IBM, "Watson knowledge catalog on cloud pak for data as a service," IBM, 14 December 2022. [Online]. Available: https://dataplatform.cloud.ibm.com/docs/content/svc-welcome/wkc.html [Accessed 4 June 2023]. [ Links ]
[8] I. Chami, S. Abu-El-Haija, B. Perozzi, C. Ré, and K. Murphy, "Machine learning on graphs: A model and comprehensive taxonomy," Journal of Machine Learning Research, vol. 23, no. 89, pp. 1-64, 2022. [ Links ]
[9] W. L. Hamilton, R. Ying, and J. Leskovec, "Representation learning on graphs: Methods and applications," IEEE Data Eng. Bull., vol. 40, no. 3, pp. 52-74, 2017. [ Links ]
[10] T. N. Kipf and M. Welling, "Semi-supervised classification with graph convolutional networks," in International Conference on Learning Representations, Toulon, 2017. [ Links ]
[11] R. Ying, R. He, K. Chen, P. Eksombatchai, W. L. Hamilton, and J. Leskovec, "Graph convolutional neural networks for web-scale recommender system," in Proceedings of the 24th ACM SIGKDD International Conference on Knowledge Discovery & Data Mining, New York (NY), 2018. [ Links ]
[12] S. Fortunato, "Community detection in graphs," Physics Reports, vol. 486, no. 3, pp. 75-174, 2010. [ Links ]
[13] F. Scarselli, M. Gori, A. C. Tsoi, M. Hagenbuchner, and G. Monfardini, "The graph neural network model," IEEE Transactions on Neural Networks, vol. 20, no. 1, pp. 61-80, 2009. [ Links ]
[14] J. Schrodt, A. Dudchenko, P. Knaup, and M. Ganzinger, "Graph-representation of patient data: A systematic literature review," Journal of Medical Systems, vol. 44, Manuscript 86, 2020. [ Links ]
[15] B. Abu-Salih, M. AL-Qurish, M. Alweshah, M. AL-Smadi, R. Alfayez, and H. Saadeh, "Healthcare knowledge graph construction: State-of-the-art, open issues, and opportunities," Journal of Big Data, vol. 10, Manuscript 81,2023. [ Links ]
[16] T. Al-Moslmi, M. G. Ocaha, A. L. Opdahl, and C. Veres, "Named entity extraction for knowledge graphs: A literature overview," IEEE Access, vol. 8, pp. 32862-32881, 2020. [ Links ]
[17] R. Grishman, "Message understanding conference-6: A brief history," in Proceedings of the 16th Conference on Computational Linguistics - Volume 1, Copenhagen, 1996. [ Links ]
[18] G. Zhu and C. A. Iglesias, "Exploiting semantic similarity for named entity disambiguation in knowledge graphs," Expert Systems with Applications, vol. 101, pp. 8-24, 2018. [ Links ]
[19] M. Conover, M. Hayes, S. Blackburn, P. Skomoroch, and S. Shah, "Pangloss: Fast entity linking in noisy text environments," in Proceedings of the 24th ACM SIGKDD International Conference on Knowledge Discovery & Data Mining, London, 2018. [ Links ]
[20] D. Chang, M. Chen, C. Liu, L. Liu, D. Li, W. Li, F. Kong, B. Liu, X. Luo, J. Qi, Q. Jin, and B. Xu, "DiaKG: An annotated diabetes dataset for medical knowledge graph construction," in Knowledge graph and semantic computing: Knowledge graph empowers new infrastructure construction, Singapore: Springer Singapore, 2021, pp. 308-314. [ Links ]
[21] B. Cheng, J. Zhang, H. Liu, M. Cai, and Y. Wang, "Research on medical knowledge graph for stroke," Journal of Healthcare Engineering, vol. 3, pp. 1-10, 2021. [ Links ]
[22] L. Li, P. Wang, J. Yan, Y. Wang, S. Li, J. Jiang, Z. Sun, B. Tang, T.-H. Chang, S. Wang, and Y. Liu, "Real-world data medical knowledge graph: Construction and applications," Artificial Intelligence in Medicine, vol. 103, pp. 101817, 2020. [ Links ]
[23] Y. Chen, Y. Wu, S. Ma, and I. King, "A literature review of recent graph embedding techniques for biomedical data," in Neural Information Processing, Cham: Springer International Publishing, 2021, pp. 21-29. [ Links ]
[24] J. Zhou, G. Cui, S. Hu, Z. Zhang, C. Yang, Z. Liu, L. Wang, C. Li, and M. Sun, "Graph neural networks: A review of methods and applications," AI Open, vol. 1, pp. 57-81, 2020. [ Links ]
[25] J. Gilmer, S. S. Schoenholz, P. F. Riley, O. Vinyals, and G. E. Dahl, "Neural message passing for quantum chemistry," in Proceedings of the 34th International Conference on Machine Learning, Sydney, 2017. [ Links ]
[26] D. Ahmedt-Aristizabal, M. A. Armin, S. Denman, C. Fookes, and L. Petersson, "Graph-based deeplearning for medical diagnosis and analysis: Past, present and future," Sensors, vol. 21, Manuscript 14, 2021. [ Links ]
[27] X. Li, Y. Zhou, N. C. Dvornek, M. Zhang, J. Zhuang, P. Ventola, and J. S. Duncan, "Pooling regularized graph neural network for FMRI biomarker analysis," Medical Image Computing and Computer-Assisted Intervention: MICCAI International Conference on Medical Image Computing and Computer-Assisted Intervention, vol. 12267, pp. 625-635, 2020. [ Links ]
[28] R. Anirudh and J. J. Thiagarajan, "Bootstrapping graph convolutional neural networks for autism spectrum disorder classification," in IEEE International Conference on Acoustics, Speech and Signal Processing (ICASSP), Calgary, 2018. [ Links ]
[29] J. Guo, J. Li, D. Leng, and L. Pan, "Heterogeneous graph based deep learning for biomedical network link prediction," Preprint, 2021. [ Links ]
[30] R. Wang, M.-C. Chang, and M. Radigan, "Modeling latent comorbidity for health risk prediction using graph convolutional network," in FLAIR-33, Miami (FL), 2020. [ Links ]
[31] A. Santos, A. Colaço, A. Nielsen, N. Lili, M. Strauss, P. Geyer, F. Coscia, N. Wewer Albrechtsen, F. Mundt, L. Jensen, and M. Mann, "A knowledge graph to interpret clinical proteomics data," Nature Biotechnology, vol. 40, pp. 692-702, 2022. [ Links ]
[32] A. Harnoune, M. Rhanoui, M. Mikram, S. Yousfi, Z. Elkaimbillah, and B. El Asri, "BERT based clinical knowledge extraction for biomedical knowledge graph construction and analysis," Computer Methods and Programs in Biomedicine Update, vol. 1, pp. 100042, 2021. [ Links ]
[33] J. Devlin, M.-W. Chang, K. Lee, and K. Toutanova, "BERT: Pre-training of deep bidirectional transformers for language understanding," in NAACL-HLT, Minneapolis (MN), 2019. [ Links ]
[34] J. D. Lafferty, A. McCallum, and F. C. N. Pereira, "Conditional random fields: Probabilistic models for segmenting and labeling sequence data," in Proceedings of the Eighteenth International Conference on Machine Learning, Williamstown (MA), 2001. [ Links ]
[35] T. Pham, X. Tao, J. Zhang, J. Yong, Y. Li, and H. Xie, "Graph-based multi-label disease prediction model learning from medical data and domain knowledge," Knowledge-based Systems, vol. 235, no. 3, pp. 107662, 2022. [ Links ]
[36] H. Lu and S. Uddin, "A disease network-based recommender system framework for predictive risk modelling of chronic diseases and their comorbidities," Applied Intelligence, vol. 52, pp. 1-11, 2022. [ Links ]
[37] J. D. Kelleher, B. MacNamee, and A. D'Arcy, Fundamentals of machine learning for predictive data analytics: Algorithms, worked examples, and case studies, Cambridge: MIT Press, 2015. [ Links ]
[38] N. Milosevic and W. Thielemann, "Comparison of biomedical relationship extraction methods and models for knowledge graph creation," Journal of Web Semantics, vol. 75, pp. 100756, 2023. [ Links ]
[39] L. Breiman, "Random forests," Machine Learning, vol. 45, pp. 5-32, 2001. [ Links ]
[40] V. Sanh, L. Debut, J. Chaumond, and T. Wolf, "DistilBERT, a distilled version of BERT: Smaller, faster, cheaper and lighter," Preprint, 2019. [ Links ]
[41] L. A. Adamic and E. Adar, "Friends and neighbors on the web," Social Networks, vol. 25, no. 3, pp. 211-230, 2003. [ Links ]
[42] A.-L. Barabasi and R. Albert, "Emergence of scaling in random networks," Science, vol. 286, no. 5439, pp. 509-512, 1999. [ Links ]
[43] G. Salton and M. J. McGill, Introduction to modern information retrieval, New York (NY): McGraw-Hill, 1986. [ Links ]
[44] T. Joachims, "Text categorization with support vector machines," in Machine Learning: ECML-98, Berlin, 1998. [ Links ]
[45] J. Hanley and B. McNeil, "The meaning and use of the area under a receiver operating characteristic (ROC) curve," Radiology, vol. 143, pp. 29-36, 1982. [ Links ]
[46] K. Abbas, A. Abbasi, S. Dong, L. Niu, L. Yu, B. Chen, S.-M. Cai, and Q. Hasan, "Application of network link prediction in drug discovery," BMC Bioinformatics, vol. 22, Manuscript 187, 2021. [ Links ]
[47] X. Wang, Y. Chai, H. Li, and D. Wu, "Link prediction in heterogeneous information networks: An improved deep graph convolution approach," Decision Support Systems, vol. 141, pp. 11348, 2020. [ Links ]
[48] L. Lü and T. Zhou, "Link prediction in complex networks: A survey," Physica A: Statistical Mechanics and its Applications, vol. 390, pp. 1150-1170, 2010. [ Links ]
[49] Y. Yang, R. Lichtenwalter, and N. Chawla, "Evaluating link prediction methods," Knowledge and Information Systems, vol. 45, pp. 751-782, 2015. [ Links ]
[50] A. Reiner Benaim, R. Almog, Y. Gorelik, I. Hochberg, L. Nassar, T. Mashiach, M. Khamaisi, Y. Lurie, Z. S. Azzam, J. Khoury, D. Kurnik, and R. Beyar, "Analyzing medical research results based on synthetic data and their relation to real data results: Systematic comparison from five observational studies," JMIR Med Inform, vol. 8, no. 2, pp. 16492, 2020. [ Links ]
[51] Y. Wang, X. Zang, R. Zhang, Y. Li, X. Tang, and G. Xie, "Reliability of supervised machine learning using synthetic data in health care: Model to preserve privacy for data sharing," MIR Medical Informatics, vol. 8, no. 12, pp. 18910, 2020. [ Links ]
[52] A. Guo, R. Foraker, R. MacGregor, F. Masood, B. Cupps, and M. Pasque, "The use of synthetic electronic health record data and deep learning to improve timing of high-risk heart failure surgical intervention by predicting proximity to catastrophic decompensation," Frontiers in Digital Health, vol. 8, no. 12, pp. 576945, 2020. [ Links ]
[53] L. Chang, J. Wu, N. Moustafa, A. Bashir, and K. Yu, "AI-driven synthetic biology for non-small cell lung cancer drug effectiveness - Cost analysis in intelligent assisted medical systems," IEEE Journal of Biomedical and Health Informatics, vol. 26, no. 10, pp. 5055-5066, 2021. [ Links ]
[54] SNOMED, "SNOMED CT starter guide," 21 April 2023. [Online]. Available: http://snomed.org/sg [Accessed 2023 June 7]. [ Links ]
[55] National Library of Medicine, "RxNORM," 5 October 2022. [Online]. Available: https://www.nlm.nih.gov/research/umls/rxnorm/index.html [Accessed 2023 June 7]. [ Links ]
[56] J. Walonoski, M. Kramer, J. Nichols, A. Quina, C. Moesel, D. Hall, C. Duffett, K. Dube, T. Gallagher, and S. McLachlan, "Synthea: An approach, method, and software mechanism for generating synthetic patients and the synthetic electronic health care record," Journal of the American Medical Informatics Association, vol. 25, pp. 230-238, 2017. [ Links ]
[57] P. Velickovic, G. Cucurull, A. Casanova, A. Romero, P. Lio, and Y. Bengio, "Graph attention networks," International Conference on Learning Representations, Vancouver, 2018. [ Links ]
[58] S. Brody, U. Alon, and E. Yaha, "How attentive are graph attention networks?" in International Conference on Learning Representations, Virtual, 2022. [ Links ]
[59] Y. Shi, H. Zhengjie, S. Feng, H. Zhong, W. Wang, and Y. Sun, "Masked label prediction: Unified message passing model for semi-supervised classification," in International Joint Conference on Artificial Intelligence, Montreal, 2021. [ Links ]
[60] A. Vaswani, N. Shazeer, N. Parmar, J. Uszkoreit, L. Jones, A. N. Gomez, t. Kaiser, and I. Polosukhin, "Attention is all you need," in Advances in Neural Information Processing Systems, Long Beach (CA), 2017. [ Links ]
[61] M. Fey and J. E. Lenssen, "PyG: A python library for geometric deep learning," in ICLR Workshop on Representation Learning on Graphs and Manifolds, New Orleans (LA), 2019. [ Links ]
[62] F. M. Harper and J. A. Konstan, "The movielens datasets: History and context," ACM Transactions on Interactive Intelligent Systems, vol. 5, no. 4, pp. 1-19, 2015. [ Links ]
* Corresponding author: 21834555@sun.ac.za
ORCID® identifiers
H. Parshotam: https://orcid.org/0000-0002-9428-3106
G.S. Nel: https://orcid.org/0000-0002-0293-1234
1 Structural priors are predefined assumptions or constraints pertaining to the expected patterns and relationships within a given data structure, guiding the analysis and modelling process.
2 Comma-separated values (CSV) is a file format for storing tabular data, according to which each instance is represented by a row, and the features (i.e. columns) are separated by commas.

