


Services on Demand
Article
 English (pdf)
 Article in xml format
 Article references
Indicators

Related links
-
 Cited by Google
 -
 Similars in Google
Share

 Permalink
South African Journal of Industrial Engineering
On-line version ISSN 2224-7890
Print version ISSN 1012-277X
S. Afr. J. Ind. Eng. vol.34 n.3 Pretoria Nov. 2023
http://dx.doi.org/10.7166/34-3-2942
SPECIAL EDITION
Usability of virtual tools for participatory enterprise modelling
A. Venter*; M. de Vries
Department of Industrial and Systems Engineering, University of Pretoria, South Africa
ABSTRACT
Participatory modelling (PM) is focused on actively involving enterprise stakeholders and modelling experts in the modelling process. Typically, participants are co-located and encouraged to collaborate to avoid conceptual misalignment. During Covid-19, however, people were forced to reduce significantly their physical interactions, which led to the embracing of virtual tools. However, limited research has been done to evaluate virtual tools for the purpose of PM or participatory enterprise modelling (PEM), and specifically for the ease-of-use or usability of these tools. Many standardised usability questionnaires are available to evaluate the usability of user interfaces or systems. We provide key criteria for selecting an appropriate standardised questionnaire to measure PM tool usability and, as the main contribution, examine in a controlled experiment the usability of an online tool, MURAL, when participants use PEM. We report on the tool's usability, using the selected standardised usability questionnaire, and present insights obtained through interviews and observations.
OPSOMMING
Deelnemende modellering (PM) is daarop gefokus om ondernemingsbelanghebbendes en modelleringskundiges aktief by die modelleringsproses te betrek. Tipies word deelnemers saam geplaas en aangemoedig om saam te werk om konseptuele wanbelyning te vermy. Tydens Covid-19 is mense egter gedwing om hul fisiese interaksies aansienlik te verminder, wat gelei het tot die gebruik van virtuele gereedskap. Beperkte navorsing is egter gedoen om virtuele gereedskap te evalueer vir die doel van PM of deelnemende ondernemingsmodellering (PEM), en spesifiek vir die gemak van gebruik of bruikbaarheid van hierdie instrumente. Daar is baie gestandaardiseerde bruikbaarheidsvraelyste beskikbaar om die bruikbaarheid van gebruikerskoppelvlakke of stelsels te evalueer. Ons verskaf sleutelkriteria vir die keuse van 'n toepaslike gestandaardiseerde vraelys om PM-instrument bruikbaarheid te meet en, as die hoofbydrae, ondersoek in 'n beheerde eksperiment die bruikbaarheid van 'n aanlyn hulpmiddel, MURAL, wanneer deelnemers PEM in 'n beheerde eksperiment gebruik. Ons doen verslag oor die instrument se bruikbaarheid deur die geselekteerde gestandaardiseerde bruikbaarheidsvraelys te gebruik en bied insigte wat verkry is deur onderhoude en waarnemings.
1. INTRODUCTION
Enterprise modelling (EM) is an "integrated and multi-perspective way of capturing and analysing enterprise solutions" [1], and is used to document the current or a desired future state of a company in a graphical and comprehensible way [2]. The process of analysts or modellers being predominantly those who are involved while other stakeholders are passive or absent rarely results in accurate models [3], and the participation of everyone involved is therefore encouraged [4]. Innovative approaches such as participative enterprise modelling (PEM), a "fruitful method of eliciting information and creating enterprise models at the same time", have therefore been introduced, with stakeholders actively taking part in the modelling sessions [2].
During PEM, participants are typically co-located and encouraged to collaborate to avoid conceptual misalignment. However, during Covid-19 [5], people were forced to reduce significantly their physical interactions, which led to the embracing of online tools instead. In a study by [6], referred to as 'the eSCM study' in this article, participation during EM was investigated, and an extended story-card method (eSCM) was used to facilitate remote co-modelling. Objectives in the eSCM study included (1) selecting an online modelling tool that encourages PEM; and (2) evaluating whether the selected tool encourages PEM in the specific EM context. It was found that MURAL [7], the selected online modelling tool, encouraged participative modelling and, specifically, participative enterprise modelling when constructing a cooperation structure diagram and a transaction product table, using the guidance provided by Dietz and Mulder [8].
Feedback received from the eSCM study's participants included MURAL usability concerns as well as feature deficiencies that impacted the functionality during PEM [6]. As a result, limited measuring of the tool's ease-of-modelling and usability was reported, and a usability assessment of MURAL to provide additional confidence about the general usability of the tool was recommended. To the best of our knowledge, no academic study has assessed MURAL's usability for PM. Our research questions (RQ) are therefore as follows:
RQ1: How user-friendly is the online tool MURAL during PEM, and specifically when using the extended story-card method (eSCM)? and
RQ2: What functional features from MURAL contribute to the use-in-context during PEM?
To evaluate usability, several methods and models can be used. In a study by [9], 37 different usability evaluation methods (UEMs) were identified, and the extensive use of usability testing, heuristic evaluation, and questionnaires was noted, with questionnaires often being used as they are an inexpensive method to understand perceptions. Standardised usability questionnaires are designed from metrics, based on the responses obtained from participants, that assess user satisfaction with the perceived usability of a system [10]. The reliability of these questionnaires has been established scientifically through psychometric tests, and they have been designed to be objective and to be used repetitively [11].
To understand better the previously identified limitations of MURAL, we suggest the use of a survey that includes a standardised usability questionnaire. An additional research question is therefore:
RQ3: Does the usability survey provide sufficient insight into the usability of MURAL as a PM tool, or are additional forms of inquiry needed to assess the usability of PM tools?
In the next section we outline the process of mixed methods research that was followed to evaluate MURAL.
2. RESEARCH METHOD
According to [12], design science research (DSR) analyses the knowledge base, in that it studies the extent to which design knowledge is already available to solve a problem of interest. If knowledge is already available to solve an identified problem, this knowledge can be applied by following routine design, which does not constitute DSR [12]. The survey used in the eSCM study [6], as well as UEMs such as standardised usability questionnaires, were already available, and therefore served as a starting point to evaluate the usability and functionality of MURAL.
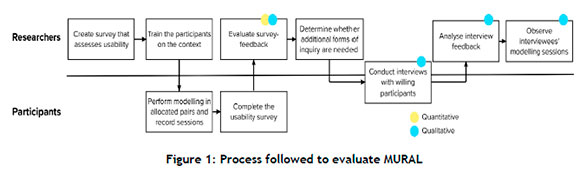
By using the available knowledge to create a new survey that extracted both quantitative and qualitative data - i.e., mixed methods research [13] - we obtained a usability score from the standardised usability questionnaire and supporting text feedback provided by the participants. We also determined whether the usability survey provided sufficient insight into the usability of MURAL as a PM tool, suggesting additional forms of inquiry to assess usability - i.e., interviews and observations, which are both qualitative methods. The research method is summarised in Figure 1.
In this article we build on research initiated by the eSCM study [6]. The similarities and differences are elaborated on in section 3.
3. BACKGROUND AND RELATED WORK
As their main contribution, [6] addressed the previous deficiencies of the story card method (SCM) and developed an extended SCM (eSCM), based on principles and guidelines that would encourage online participation during PEM. As a second contribution, they evaluated whether the selected modelling tool, MURAL, encouraged active PEM. In our study we also focused on MURAL, as this was the tool in which the limitations regarding ease-of-modelling and usability during PEM in a specific EM context were initially identified.
In the eSCM study, the eSCM content and eSCM implementation in MURAL (refer to section 4 in [6]) were explained. We followed the same process, ensuring that the participants understood the eSCM and what was expected of them, and would be able to model a specific scenario. The differences between our study and the study presented by [6] are related to the evaluation, detailed below:
• The co-modelling context: In the eSCM study [6], participants applied the eSCM as facilitators, each involving a colleague from industry as a co-modeller. In our study, participants were required to work in pairs. The participant pairs still fulfilled 'facilitator' and 'colleague' roles, as stipulated in the eSCM steps, but both participants now had knowledge about eSCM, reducing the variability in participant knowledge.
• The case used in the modelling: Considering that industry case studies were not relevant, as participants were not paired with a colleague from industry, a fictitious case to govern continued professional development (CPD) was provided to all participants by the researchers; that is, all of the participant pairs were tasked with using the CPD context to model the essence of the CPD governing operations, thus reducing variability in the case context.
• The survey: The survey used in our study was different from that presented in the eSCM study [6], as our study was focused more on the features and usability of MURAL during PEM, and therefore aimed to extract different data.
• The evaluation: In the eSCM study [6], survey feedback was used, as well as activity tracking, to measure the level of participation. In this article, we exclude the level of the participation results, and instead include the preliminary findings from interviews and observations of the recorded PEM sessions, which we consider more valuable that is, relating to the research questions presented above.
• The meeting platform: In the eSCM study [6], participants had the option to use the meeting platform of their choice. To reduce the variability in platforms, which might have affected the overall usability experience, Blackboard Collaborate was mandated. Participants also had to record their participative sessions.
• The survey in our study, which incorporated a standardised usability questionnaire and questions similar to the survey used in [6], and which would enable us to understand MURAL's ease-of-modelling and usability during PEM in a specific EM context, is elaborated on in the next section.
4. THE SURVEY
Surveys are an affordable and easy way to obtain valuable participant feedback. We therefore decided to use survey feedback, similar to what the eSCM study did [6], but with an emphasis on evaluating functionality and usability. The system usability scale (SUS) was the standardised usability questionnaire that was selected to be incorporated into our survey, as motivated in section 4.1. Functionality, usability, and user experience are not strictly independent of each other, with the physical features of the product (i.e., its functionality) impacting the usability, and the usability contributing to the user experience [14]. To extract insights into the functionality, specific feature-related questions were included, and the free-text answers in the usability section were also evaluated, while acknowledging the relationship between these concepts. The final survey that was used in our study is summarised in section 4.2.
4.1. The selected standardised usability questionnaire
When selecting a standardised usability questionnaire to incorporate into our survey, we had four primary requirements, namely (1) it should be a post-study questionnaire [15], as we would assess the usability after the participants had completed a set of tasks; (2) it should not be time-consuming to complete, considering that our participants had volunteered to take part without any compensation; (3) the questionnaire should be free to use, as no funding was available to pay for licensing fees; and (4) the questionnaire should be suitable for smaller sample sizes, as we expected the engagement of 10 to 30 participants.
According to [16], the most widely used standardised usability questionnaires for the assessment of usability at the end of a study that are also cited in national and international standards are the questionnaire for user interface satisfaction (QUIS), the Software Usability Measurement Inventory (SUMI), the Post-Study System Usability Questionnaire (PSSUQ) and the System Usability Scale (SUS). In an analysis performed by [17], post-study standardised usability questionnaires that focus on products, computer software, or software applications - excluding the questionnaires listed by [16] above - are the Technology Acceptance Model (TAM), the Usefulness, Satisfaction and Ease of use (USE) questionnaire, the Usability Metric for User Experience (UMUX), the UMUX-LITE, and AltUsability, an alternative version of the SUS that has not been fully developed into a standardised questionnaire, and was therefore excluded as an option. In addition to the post-study questionnaires identified by [17], [18] AttrakDiff 2, the Modular Evaluation of key Components of User Experience (meCUE), the User Experience Questionnaire (UEQ) and the End User Computing Satisfaction (EUCS).
We eliminated AfftakDiff 2, UEQ, and meCUE as options, as they are time-consuming to complete [18] and consist of more than 20 questions. The SUMI and USE questionnaire were also eliminated, as they consist of 50 and 30 items respectively, and QUIS was eliminated because it consists of 27 items, and could not be obtained for free within the required time frame. The remaining questionnaires were therefore TAM, UMUX, UMUX-LITE, EUCS, and SUS. TAM considers usefulness in addition to usability, as [19] believes that the actual use of technologies is affected by the intention to use, which is itself affected by the perceived usefulness and usability of the technology. We decided to exclude TAM, as our study was focused more on traditional system usability assessments; that is, the focus was not currently on usefulness or other hedonic factors. UMUX and UMUX-LITE were also excluded for this reason.
According to [20], the EUCS survey could be used across a variety of applications, hardware platforms, and development modes; but we believed that most of the questions in the EUCS survey would confuse our participants in the PEM context, as many of the questions are irrelevant to PEM. All of the subscales' questions in the EUCS are irrelevant, except the ease-of-use section, which consists of two questions, namely 'E1 : Is the system user friendly?' and 'E2: Is the system easy to use?' An example of an irrelevant content subscale question is 'Does the system provide the precise information you need?' The EUCS survey was therefore also excluded, with the only remaining questionnaire being the sUs. A visual depiction of the selection of the SUS is given in Figure 2.
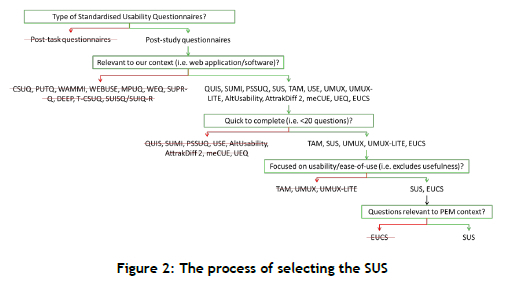
The SUS is recommended for post-study research by [16], as it is a questionnaire that "has become one of the most popular post-study standardised questionnaires". The SUS is also particularly reliable with small sample sizes [21]; however, the scoring system is somewhat complex, and the best way to interpret results involves 'normalising' the scores to produce a percentile ranking. When using the SUS, participants are asked to score 10 items (included in Appendix A), with one of five responses that range from 'Strongly agree' to 'Strongly disagree'. It should be noted that the word 'awkward' in the SUS was changed to 'frustrating' in our survey - i.e., 'I found the system very frustrating to use'.
4.2. The final survey presented
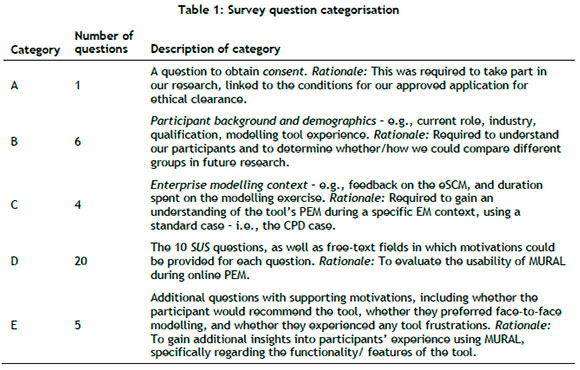
The survey that was presented to participants consisted of 36 questions in total, of which 15 were free-text questions that encouraged participants to motivate their answers. The 36 questions were grouped into logical categories, as shown in Table 1.
The final survey was created in a web-based learning management system that was accessible to the participants. The process of evaluating MURAL's usability and functionality is described in the next section.
5. USABILITY EVALUATION
In our study, we aimed to ensure that participants had a thorough training session in the method, tool, and language prior to evaluating MURAL. This was done to minimise the potential influence of insufficient knowledge on their perception of MURAL's usability. For training, the two researchers were assigned the roles of either 'facilitator' or 'colleague', and explained the 13 steps of the eSCM in MURAL to participants by using a fictitious case study. The participants also received training on constructing a cooperation structure diagram (CSD) and a transaction product table (TPT) in accordance with guidance from Dietz and Mulder [8] prior to the eSCM training, and had previously completed other tasks using MURAL.
The eSCM training, which took place in person with all 30 participants present, lasted about 90 minutes. Participants were encouraged to ask questions during the session, and once the session had been completed, they were informed of the researchers' expectations - e.g., that their modelling sessions had to be recorded - as well as the amount of time available to complete their co-modelling - i.e., using the CPD context to model the essence of the CPD governing operations.
Participants were randomly assigned partners by one of the researchers and, as in the training, each pair had to assign 'facilitator' and 'colleague' roles. There were 30 participants, and therefore 15 groups. The participant pairs followed the 13 steps of the eSCM in MURAL, modelling their CPD case. Each participant had to participate on their own device, and the modelling session(s) could take place over one or more Blackboard Collaborate sessions, with each session(s) being recorded.
When the modelling was complete, the participants evaluated their experience, and specifically the functionality and usability of using the eSCM method collaboratively in MURAL to model the prescribed CPD case. (The process of evaluating the survey feedback is described in section 5.1.) After the survey feedback had been analysed, it was determined that additional insights were required, as the survey feedback often lacked depth and context. As an example, one participant, when asked whether they experienced any frustrations related to the tool's functionality, stated: "The processes were very long when drawing them on MURAL". This statement was vague, and additional clarification was required. In another example, one participant mentioned that there were not any descriptions or tooltips when hovering over icons in MURAL; but it was unclear whether and how this 'shortcoming' specifically impacted the modelling.
We therefore conducted interviews with willing participants, as described in section 5.2. The recorded modelling sessions of the willing interviewees were also watched to obtain additional insights to support the survey and interview feedback. The observation process is detailed in section 5.3.
5.1. Survey feedback
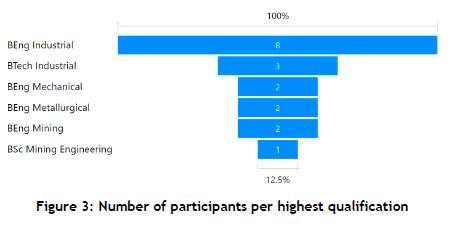
Once the pairs had completed their modelling, they could complete the usability survey. The participants were informed about their voluntary participation in the survey, that their privacy would be protected, and that participation would remain confidential. Of the 30 participants, 18 (i.e., 56%) voluntarily completed the survey of 36 questions, representing 13 of the 15 groups. All 18 survey participants had educational backgrounds in engineering, science, and/or technology, as shown in Figure 3. Of the 18 participants, about 22% were full-time students, while the remaining were employed in various roles, with most (about 33%) working in the mining industry.
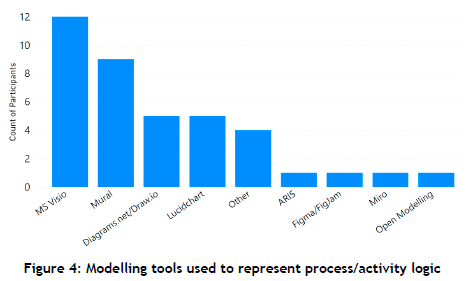
All participants had worked with at least one modelling tool before, with Microsoft Visio being the most frequently used tool (about 67%) followed by MURAL (50%), as shown in Figure 4. Vulcan and Bizagi Modeler were examples of other modelling tools that had been used.
The survey feedback results are included in section 6.1.
5.2. Interviews
After the survey feedback had been analysed, it was determined that additional context and insights were required. We decided to contact 15 of the 18 survey participants via email about doing an additional interview, based on the feedback provided in the survey. Of the 15 who were contacted, only two volunteered to be interviewed. Therefore, about 11% of the 18 survey participants were interviewed - i.e., about 7% of all participants. The interviews took place individually, and included questions that were formulated from assessing the interviewees' survey feedback. The interviews, ranging between seven and 11 minutes, were recorded, and the results are included in section 6.2.
5.3. Observations
In this article we only include and report on the observations of the two group sessions of which our interviewees were a part. The recordings were watched after the interviews had been conducted, and the researcher focused solely on usability and functionality - i.e., not on how accurately the eSCM itself was followed and implemented. The first group of interviewees recorded about three hours of their more than 10 hours of participative enterprise modelling (according to the survey), and the second interviewee's group recorded about five hours of their 10-hour participative enterprise modelling (also according to the survey). The participants spent time discussing and 'testing' the modelling before recording parts of the modelling, and so it is likely that some usability issues were not included in the recordings. The observation results are included in section 6.3.
6. RESULTS AND DISCUSSION
The results are provided and discussed according to the method of data gathering, with the survey feedback included in section 6.1, the interviews included in section 6.2, and the observations included in section 6.3.
6.1. Survey feedback
The survey data obtained from the 18 participants were analysed first. Some of the participants' backgrounds and demographics data (Category B in Table 1) are included in section 5.1. Regarding the enterprise modelling context questions (Category C in Table 1), difficulties were reported by four participants, such as challenges in differentiating informational tasks from documentational tasks, and difficult-to-follow instructions. Of the participants, 89% agreed or strongly agreed that the eSCM was followed according to the provided instructions.
When evaluating the SUS questions' accompanying free-text answers (Category D in Table 1 ), it was determined that five of the participants did not evaluate the usability of MURAL but instead the usability of the eSCM. As an example, one participant stated: "It is not at all intuitive", "It is tedious", and "It is not user friendly", but later in the survey, when asked to elaborate on any frustrations with the modelling tool, they stated that they were "very comfortable with MURAL and find it intuitive". It was decided that these five participants' SUS answers would be excluded from the analysis, but that their other feedback about the method and functionality (i.e., all of the categories excluding Category D in Table 1 ) would still be analysed. The SUS results of the 13 remaining participants are shown in Figure 5.
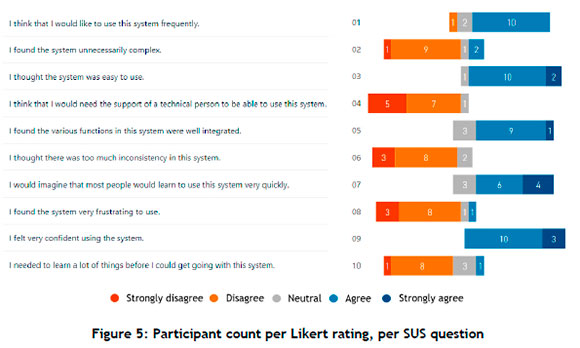
SUS yields a single number that represents a composite measure of the overall usability of the system being studied [22]. The MURAL score obtained from our study, calculated based on the responses from the 13 participants, was 74.23. Jeff Sauro [23] recommends communicating SUS scores as percentiles, indicating how well the raw score compares with others in the database. The average score, at the 50th percentile, was 68, which meant that a raw SUS score above 68 was above average. Our score of 74.23 fell within the 70-79 percentile, which meant that MURAL, in our chosen context, scored above average.
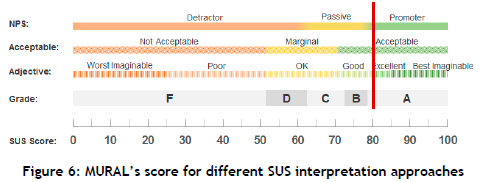
Other ways to evaluate SUS scores include grades, adjectives, acceptability, and net promoter score (NPS) categories, which are associated with raw SUS scores [23]. The score obtained for MURAL in a PEM context, using the eSCM, is shown in Figure 6.
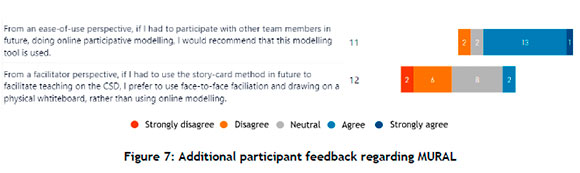
With regard to the additional questions (Category E in Table 1 ), most participants (about 72%) agreed that they would recommend this modelling tool in the future when participating with other team members (see Figure 7). Only about 11% would have preferred to use face-to-face facilitation and drawing on a physical whiteboard when using the eSCM in the future, with most not having a preference for face-to-face over online modelling, as shown in Figure 7.
When asked to elaborate on any frustrations experienced with the tool's functionality, 10 of the 18 participants (56%) provided feedback containing frustrations; two (11%) provided positive feedback about MURAL (e.g. "No, the tool is user friendly"); and four (22%) did not provide any feedback. Two (11%) participants mentioned frustrations with the groupwork and project in general instead of the tool.
The frustrations with the tool's functionality that were identified by the 10 participants who included relevant feedback were classified according to categories identified in the eSCM study [6]. Of the nine categories identified in the eSCM study [6], only two were reported by our participants in the survey feedback. Editing frustrations were encountered twice (e.g., "Formatting the fonts elements, no auto sizing feature, so one had to make sure it's properly done, causing a lot of moving objects along the way") and auto-refresh issues were encountered three times (e.g., "There were cases when drawing connection arrows that MURAL would freeze the mouse cursor on the block expansion double arrow. This prohibited many functions of the mouse and we had to undo or either exit the room and re-enter to rectify"). All of the other frustrations could not be classified according to the eSCM study [6] - e.g., "Having to duplicate and move items should they not be in your context library was also frustrating", and "When moving around some of the tasks, the arrow was not linked to it anymore despite using the auto arrow functionality to connect two blocks".
All of the new frustrations that were identified were related to user interface issues, such as moving, duplicating, and selecting objects; issues about team member awareness ("The zoom function makes it very hard to locate where your co-modeller is working on the mural"); and user interface learnability (e.g., "No descriptions or tooltips when hovering over icons"). Additional functionality feedback that was obtained by evaluating the free-text answers from the usability category (Category D in Table 1 ) included one of the participants mentioning difficulties in "creating an account/access management".
6.2. Interviews
As mentioned in section 5.1, only two participants agreed to the interviews. The first was asked to participate in an interview because their feedback about the tool's frustrations was unclear ("The processes were very long when drawing them on MURAL"). In the interview it became clear that both MURAL and the eSCM were evaluated, as suspected by the researchers; for example, when probed about their agreement with the statement that the system was unnecessarily complex, the interviewee clarified that the comment was about MURAL and about the benefit of having the eSCM template available in MURAL. When asked why the participant had strongly disagreed that the system was easy to use, but also agreed that a lot of things had to be learnt before getting going with the system, eSCM concerns were mentioned again (as previously included in the survey feedback), confirming that "using MURAL was fine".
Regarding tool frustrations, the participant had stated the possibility of "doing this wrong", but that, when creating an image of the modelled process, details would not be sufficiently visible in the PNG image. This was similar to feedback obtained in the eSCM study [6] - i.e., "the exports from MURAL are not readable"
- which was not categorised, as it was not mentioned as a frustration specifically in the eSCM study. Frustrations were also mentioned about the movement of objects (tasks would end up in the wrong "swim lane") and not being able to record the session and communicate with the co-modeller within MURAL itself
- i.e., having "everything in one platform". This last frustration links to the category, "MURAL should have the ability to verbally communicate while modelling", identified in [6]. As a first-time user of MURAL, the participant was positive about using the tool in future, mentioning the benefit of being able to see the changes as the co-modellers worked in MURAL.
The second interviewee was asked only to provide additional feedback about the tool frustrations mentioned in the survey. This interviewee had difficulty with increasing the font size and zooming in to increase the font size, and also mentioned that the multi-selection of objects to increase the font size of many objects at the same time was impossible: each object had to be selected and moved individually when wanting to make changes to the process. This was similar to the "editing frustrations" category in [6], where "not being able to edit the style of multiple text items simultaneously" was an issue. In MURAL, however, the multiselect function is available, and text can be adjusted simultaneously; the researcher therefore suspected that this could have been a user education problem. When asked whether this issue would be visible in the recording of the session (so that the researcher could confirm whether or not it was a user issue), the interviewee stated that they had practised before recording the final work, and so the issue would most probably not be visible in the recording. Last, the participant mentioned that a context library was configured in MURAL, but that, since the mapping was done in the co-modeller's MURAL and they had not set up a context library, it was frustrating, since duplicating and moving items were time-consuming. The participant confirmed that MURAL was a user-friendly tool, indicating their intention to apply it in different contexts.
6.3. Observations
In the first interviewee's recordings, the researcher noticed that the participants copied and pasted arrows instead of using the easier way of creating arrows (i.e., it seemed as if they were not aware of simpler ways of modelling in the tool). Connection problems (i.e., the category of work loss owing to connection problems) were mentioned in the recording, but the researcher was not able to see the impact of the connection issues in the recording itself. Last, sticky notes were accidentally created more than three times by the modellers, and had to be deleted, which is another identified category in [6]. Some issues observed in the recording were not mentioned in the interview, and certain frustrations mentioned in the interview, such as exporting the image, were not included in the recordings.
In the second interviewee's recording, it was observed that the participant moved items individually instead of attempting to multiselect the objects; this observation supported the user education theory mentioned in section 6.2. The modellers also initially moved items one by one that could have been grouped - e.g. the task and the '+' indicating a sub-process - but later discussed the grouping function and used it thereafter. The same applied to the problems with moving the arrows. After a few attempts to copy and paste the arrows, the modellers realised that they could easily create an arrow and then just change the type to the desired format instead of moving the arrow all the way from one side of the Mural to the other. Connection issues were mentioned - e.g., the co-modeller often reported not being able to hear the interviewee, and the interviewee's cursor/name could not be seen by the co-modeller a few times ("the app kicked me out"). It should be noted, however, that no work was lost as a result of these specific problems. The causes could have been issues other than connection problems, such as problems with the microphone: when the co-modeller mentioned the sound concern, an adjustment was made, and one could hear the participant again. A locked task did impact the modelling twice (i.e., editing frustrations), and sticky notes were accidentally created more than three times (i.e., automatic sticky note addition).
7. CONCLUSION AND FUTURE RESEARCH
Regarding the usability during PEM, and specifically when using the eSCM (i.e., RQ1 ), it could be concluded from the SUS score that MURAL scored above average, and was considered an acceptable tool in this specific context. For future research, the usability of alternative modelling tools such as FigJam or Miro should be assessed within the same context, so that different tools' usability could be compared with one another. Additional insights could then be obtained into the features in these different tools, and how these impact the perceived usability. It would also be beneficial to evaluate MURAL in an alternative EM context, such as when a different method and/or language is used instead of the eSCM. We recommend identifying a context with a larger pool of participants in our survey, as this would enable us to gather a wider range of insights into the usability and functionality of MURAL, and provide a more comprehensive evaluation of using a survey as a means of assessment.
Regarding the functional features in MURAL that contributed to the use-in-context during PEM (i.e., RQ2), the awareness of co-modeller(s) was an identified theme, as well as the real-time/near real-time changes/actions of the participants. Features were mentioned that would have contributed to the use-in-context but that were lacking in MURAL, such as the understanding of various icons in the tool (i.e., icon interpretation) and more user-friendly editing.
Most of the frustrations (i.e., seven of the nine) identified in the eSCM study were not mentioned in our survey feedback. A possible reason is that the eSCM study had a larger sample of participants who provided individual survey feedback - i.e., 25 survey participants versus the 18 participants in our study. One additional category was identified from the interviews ("MURAL should have the ability to verbally communicate while modelling"), and another category was observed in the session recordings ("automatic sticky note addition with double click"). Even though connection problems were mentioned, there was no proof of work being lost as a result, so we excluded this category. Therefore, four of the nine categories identified in [6] were identified in our study. For future research, the tool frustration categories in [6] should be expanded, based on our findings and on MURAL's features in the tool comparison results [6].
Identifying additional frustrations from the interviews and observations indicated that additional forms of inquiry were needed to assess better the usability of PM tools (i.e., RQ3). For future research, the development of a usability measurement instrument focused on and relevant to PEM specifically should be investigated. The other 13 recorded sessions could also be reviewed and reported on to extract additional insights into the usability and functionality of MURAL.
It was found that some participants did not evaluate the usability of MURAL but evaluated eSCM instead. For future research, the eSCM feedback obtained from our study could be analysed to understand better the concerns experienced with the eSCM. In addition, the survey (or the suggested usability measurement instrument) should be updated, based on learnings from this first round of evaluation - for example to avoid misunderstandings about the purpose of the usability test in the future.
Last, the standardised usability questionnaire used in our study, the SUS, was selected on the basis of an elementary elimination process, as detailed in section 4.1. For future research, we recommend a systematic literature review to determine which standardised usability questionnaires have been used in which contexts, and whether there is a more systematic process that could have been used to determine which questionnaire is most suitable on the basis of different factors.
REFERENCES
[1] J. Stirna and A. Persson, Enterprise modeling: Facilitating the process and the people. Cham: Springer, 2018. [ Links ]
[2] A. Gutschmidt, "An exploratory comparison of tools for remote collaborative and participatory enterprise modeling," ECIS 2021 Research-in-Progress Papers, 2021. [ Links ]
[3] J. Barjis, "Collaborative, participative and interactive enterprise modeling," in Enterprise Information Systems, Berlin, Heidelberg, J. Filipe and J. Cordeiro, Eds., 2009: Springer, pp. 651662. [ Links ]
[4] A. Gutschmidt, V. Sauer, K. Sandkuhl, and A. Kashevnik, "Identifying HCI patterns for the support of participatory enterprise modeling on multi-touch tables," in The Practice of Enterprise Modeling: 12th IFIP Working Conference, PoEM 2019, Luxembourg, November 27-29 2019: Cham: Springer in Lecture Notes in Business Information Processing 1865-1356, pp. 118-133, doi: 10.1007/978-3-030-35151-9_8. [ Links ]
[5] The Society for Pediatric Dermatology, "What is COVID-19?," Pediatric Dermatology, vol. 37, no. 3, pp. 555-556, 2020, doi: https://doi.org/10.1111/pde.14218. [ Links ]
[6] M. de Vries and P. Opperman, "Improving active participation during enterprise operations modeling with an extended story-card-method and participative modeling software," Software and Systems Modeling, vol. 22, no. 4, pp. 1 -28, 2023. [ Links ]
[7] Mural. "Visual collaboration made easy." https://www.mural.co/features (accessed 11 November, 2023). [ Links ]
[8] J. Dietz and H. Mulder, Enterprise ontology: A human-centric approach to understanding the essence of organisation, Cham: Springer, 2020. [ Links ]
[9] K. Sagar and A. Saha, "A systematic review of software usability studies," International Journal of Information Technology (Singapore), 2017, doi: 10.1007/s41870-017-0048-1. [ Links ]
[10] P. Gonqalves da Silva e Souza and E. D. Canedo, "Improving usability evaluation by automating a standardized usability questionnaire," in Design, User Experience, and Usability: Theory and Practice: Cham: Springer, 2018, pp. 379-395. [ Links ]
[11] B. Shneiderman, C. Plaisant, M. Cohen, S. M. Jacobs, and N. Elmqvist, Designing the user interface: Strategies for effective human-computer interaction, 6th ed. Harlow, Essex: Pearson, 2018. [ Links ]
[12] J. vom Brocke, A. Hevner, and A. Maedche, "Introduction to design science research," in Design Science Research. Cases, J. vom Brocke, A. Hevner, and A. Maedche Eds.: Cham: Springer, 2020, pp. 1-13. [ Links ]
[13] J. W. Creswell and V. L. Plano Clark, Designing and conducting mixed methods research, 3rd ed. Thousand Oaks, California: SAGE, 2018. [ Links ]
[14] N. de Voil, User experience foundations, Swindon: BCS, The Chartered Institute for IT, 2020. [ Links ]
[15] P. Laubheimer. "Beyond the NPS: Measuring perceived usability with the SUS, NASA-TLX, and the single ease question after tasks and usability tests." https://www.nngroup.com/articles/measuring-perceived-usability/ (accessed 10 March, 2023). [ Links ]
[16] J. Sauro and J. R. Lewis, "Chapter 8 - Standardized usability questionnaires," in Quantifying the user experience, J. Sauro and J. R. Lewis Eds. Boston: Morgan Kaufmann, 2012, pp. 185-240. [ Links ]
[17] A. Assila, K. M. de Oliveira, and H. Ezzedine, "Standardized usability questionnaires: Features and quality focus," Electronic Journal of Computer Science and Information Technology (eJCSIT), vol. 6, no. 1, pp. 15-31, 2016. [ Links ]
[18] A. Hodrien, "A review of post-study and post task subjective questionnaires to guide assessment of system usability," Journal of Usability Studies vol. 16, no. 3, pp. 203-232, 2021. [ Links ]
[19] F. D. Davis, "Perceived usefulness, perceived ease of use, and user acceptance of information technology," MIS Quarterly, vol. 13, no. 3, pp. 319-340, 1989. [ Links ]
[20] G. E. Heilman and J. Brusa, "Validating the end-user computing satisfaction survey instrument in Mexico," International Journal of Technology and Human Interaction, vol. 2, no. 4, pp. 84-96, 2008, doi: 10.4018/978-1-59904-945-8.ch104. [ Links ]
[21] T. S. Tullis and J. N. Stetson, "A comparison of questionnaires for assessing website usability," Usability Professional Association Conference, 2004. [ Links ]
[22] J. Brooke, "SUS: A quick and dirty usability scale," in Usability evaluation in industry, P. W. Jordan, B. Thomas, B. A. Weerdmeester, and I. L. McClelland Eds. United Kingdom Taylor & Francis, 1995, pp. 189-194. [ Links ]
[23] J. Sauro. "5 ways to interpret a SUS score." Measuring U. https://measuringu.com/interpret-sus-score/ (accessed 11 November, 2023). [ Links ]
* Corresponding author: anthea.venter@up.ac.za
ORCID® identifiers
A. Venter: https://orcid.org/0000-0002-7498-1177
M. de Vries: https://orcid.org/0000-0002-1715-0430

