


Services on Demand
Article
 English (pdf)
 Article in xml format
 Article references
Indicators

Related links
-
 Cited by Google
 -
 Similars in Google
Share

 Permalink
South African Journal of Industrial Engineering
On-line version ISSN 2224-7890
Print version ISSN 1012-277X
S. Afr. J. Ind. Eng. vol.34 n.2 Pretoria Aug. 2023
http://dx.doi.org/10.7166/34-2-2392
CASE STUDIES
Improving energy usage in commercial buildings using Six Sigma DMAIC
K. KanyindaI, *; I.J. LazarusII; O.A. OlanrewajuI
IDepartment of Industrial Engineering, Durban University of Technology, Durban, South Africa
IIDepartment of Physics, Durban University of Technology, Durban, South Africa
ABSTRACT
This article describes the energy-saving measures in commercial buildings from different perspectives on energy saving in cities. In recent years, improving energy conservation in commercial buildings has become an issue of great importance for the financial well-being of organisations. The study uses the define-measure-analyze-improve-control (DMAIC) Six Sigma approach to identify the factors that contribute to increases in electricity consumption. With the increasing shortage of energy, two years' worth of energy consumption data from a commercial building in South Africa was collected and analyzed using statistical tools. The research findings revealed that the boiler had the highest electricity consumption (38.33 per cent), followed by the kitchen (24.20 per cent) and the rest of the building (37.47 per cent). After applying the DMAIC process, it showed that the electricity consumption of the boiler could be reduced by 6 per cent during the improvement phase.
OPSOMMING
Hierdie artikel beskryf die energiebesparingsmaatreëls in kommersiële geboue vanuit verskillende perspektiewe op energiebesparing in stede. In onlangse jare het die verbetering van energiebesparing in kommersiële geboue 'n kwessie van groot belang geword vir die finansiële welstand van organisasies. Die studie gebruik die definieer-meet-ontleed-verbeter-beheer (DMAIC) Six Sigma-benadering om die faktore te identifiseer wat bydra tot toenames in elektrisiteitsverbruik. Met die toenemende tekort aan energie is twee jaar se energieverbruikdata van 'n kommersiële gebou in Suid-Afrika ingesamel en met behulp van statistiese instrumente ontleed. Die navorsingsbevindinge het aan die lig gebring dat die waterverwarmingstelsel die hoogste elektrisiteitsverbruik het (38,33 persent), gevolg deur die kombuis (24,20 persent) en die res van die gebou (37,47 persent). Nadat die DMAIC-proses toegepas is, het dit gewys dat die elektrisiteitsverbruik van die waterverwarmingstelsel tydens die verbeteringsfase met 6 persent verminder kan word.
1. INTRODUCTION
Organisations are increasingly interested in alternative energy sources as a way to moderate the ever-increasing electricity consumption in the commercial sector. Cities contribute 70 per cent of global energy use and 40 per cent to 50 per cent of greenhouse gas emissions globally, according to the United Nations' Framework Convention on climate change (UNFCCC) report on energy efficiency in urban environments [1]. With more than 80 per cent of global gross domestic product (GDP) generated in cities [2], reducing the amount of energy consumed in them is key to their contribution to sustainable growth through increased productivity and innovation and to the fight against climate change. In addition to combating climate change, It is clear from the United Nations (UN) Sustainable Development Goals (SDG) - 7 that it is globally becoming acceptable to source affordable and accessible clean energy. The global climate and environmental issues are major reasons behind the sudden surge in energy efficiency, in line with the UN's seventh sustainable development goal [3].
Sugihara and Tsuji [4] classify energy consumption into three categories, according to its end-use (i.e., its users): 'industrial', 'civil', and 'transport' sectors. The UNFCCC [1] estimates that the sectors with the greatest potential for energy savings are buildings, municipal energy, transport, and lighting. The industrial sector is among the largest, consuming high levels of energy. Electrical energy use is the main measure to determine the amount of energy consumed in a building. Improving the use of electrical energy in buildings would optimise the amount of energy used by electrical appliances. With the right management system, the amount of electricity used by such appliances could be tracked, managed, and continually reduced [5]. With the help of a device such as an eGauge, the energy consumption of a building could be collected and calculated at regular intervals. One of the management approaches that provide a framework for continuous organisational improvement is the Six Sigma (SS) approach called define-measure-analyse-improve-control (DMAIC) [6].
2. LITERATURE REVIEW
This research aimed to identify the factors contributing to high electrical energy usage in order to minimise energy costs without compromising customer satisfaction. There are energy management mechanisms and policies that assist the industrial, civil, and transport sectors in their efforts to reduce the high costs related to their energy consumption. After identifying the factors that contribute to high electricity use, the proposed Six Sigma DMAIC approach is reviewed.
2.1. Energy management
According to Capehart and Wayne [7], energy management is the judicious use of energy to accomplish prescribed objectives. In the context of this study, these objectives are to enhance energy use and reduce the energy cost of the organisation. Energy management and monitoring remains one of the most important elements in ensuring energy improvement. The South African Alternative Energy Association (SAAEA) [8] defines energy management as making informed decisions that are based on structural insights into energy consumption and its impact on an organisation. Energy management requires permanent and detailed insight into energy consumption, analysis of the related risks, translation into risk management, and the identification of opportunities [9]. With good energy management, an organisation can make a positive and conscious decision to manage its energy consumption.
Since the commercial sector is diverse, what effective energy management requires depends on many different factors, such as the organisation's size and type of business. Monitoring the energy management programme for large energy users such as commercial buildings involves installing a complete information management system, or a data collection system such as a smart meter. This management system could collect and identify energy consumption, savings, and continuous opportunities for improvement to meet the organisation's financial constraints. Cruz-Cázares, Bayona-Sáez and García-Marco [10] famously stated: "You can't manage what you can't measure". This means that energy is only manageable when users can measure their usage. Govender [11] explains that experience has shown that a one to two per cent reduction in consumption can be achieved meters have been installed simply by letting users know that they are being monitored. Furthermore, up to five per cent of the total reduction can occur when users are able to manage their energy use better [11]. With proper monitoring, recording, and analysis, using meters often leads to corrective actions that result in reduced energy costs. Rathore explains that the 1973 energy crisis forced the world to look for an alternative arrangement to ensure energy sufficiency [12]. Obviously, this led to improved energy use.
2.2. Why DMAIC?
DMAIC problem solving, known for its influential statistical techniques for fact-finding, provides advanced strategies and orderly methods to collect data and is a method of statistical analysis to identify the causes of errors or defects and to eliminate these errors. Its main objective is to guide the project team from the beginning in order to maintain the results and to reduce any variations in the process. In the context of this study, a defect is regarded as anything that causes an increase in energy consumption.
The objective of this paper is to apply the Six Sigma DMAIC method to analysing electrical consumption data and identifying the factors that contribute to increased electrical energy consumption in commercial buildings, and so to reducing electricity costs. Six Sigma has helped organisations to make more money by improving customer value and efficiency [13].
There is little interest locally in DMAIC process improvement; even globally, studies have demonstrated the initiatives of organisations in improving energy use in different sectors of the economy, mainly in the manufacturing industry, and predominantly using a technical approach. But such initiatives require a general perspective in order to address the problem comprehensively.
3. METHODOLOGY
Six Sigma DMAIC problem solving is a data-driven approach that emphasises reducing variation [14]. At a time when affordable and reliable energy is already scarce and energy suppliers are struggling to meet the demands of growing economies, Six Sigma DMAIC has the potential to improve processes and remove problems. Statistically, It refers to a process in which the distance between the nearest specification limit and the mean of a process quality measurement is at least six times that process's standard deviation [15]. The structure that is followed is defined as define, measure, analyse, improve, and control to improve energy.
Define: Identify the power consumption problem in the commercial building that requires solutions (customer requirements), identify the process flow or flow map of the building, and identify the location of the significant energy users (SEUs) in the building.
Measure: Evaluate the power consumption of the SEUs.
Analyse: Determine the root cause, and understand the factors contributing to poor performance.
Improve: Compare the energy consumption before and after the DMAIC campaign.
Control: Monitoring energy consumption in the building
4. ANALYSIS AND RESULTS
This section gives a detailed analysis of the outcomes of the data collected using eGauge in the building being studied and illustrates the way in which DMAIC can be used as a Six Sigma management tool to help to improve energy consumption in commercial buildings using its different steps.
4.1. Define
A commercial building 'ABC' has been experiencing an increase in monthly electricity costs over the previous few years. As part of the process of identifying the problem, the project team (the maintenance manager, the electrical engineer, the building manager, and the building's industrial engineer) met to determine how to reduce the monthly cost of electricity consumption. ABC was a busy commercial building located in the city of Durban, South Africa. According to South African Statistics [16], commercial buildings are the third-highest electricity consumer after industrial and residential buildings. In buildings, the locations of major energy users such as distribution boards (DBs) were provided to facilitate the installation of eGauge measuring devices. According to the eGauge website, the device measures, stores, and retrieves data directly from a local network or from a remote location via the Internet. The device is also able to compute power (V,A, VAr, kWh, etc) and to record data from optional sensors that assess flow rate, temperature, wind speed, etc. [17].
4.2. Measure
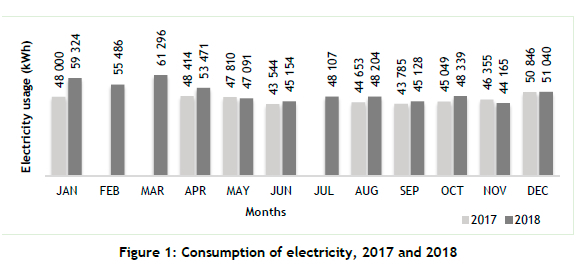
The building's historical data issued by the energy supplier (Eskom) was used to determine the building's monthly consumption and electricity bill. In addition to the electricity obtained from Eskom, an eGauge was installed in the main supply DB to collect energy consumption (kWh). Figure 1 shows Eskom's historical data for 2017 and the eGauge data for 2018, revealing a variation in the data between the two sources. The consumption rate in winter was higher than in other seasons; because Eskom regards the winter season as the peak period, a higher rate is charged.
Generally, the pricing of electrical consumption varies according to the sector. The charge also depends on the demand from the commercial sector, with high-demand and low-demand seasons. In the building ABC, the high-demand season is from May to September, and the low-demand season is from September to May. During the high-demand season, which is the winter, electrical consumption costs more than double than in the standard season. There are also a peak period and an off-peak period.
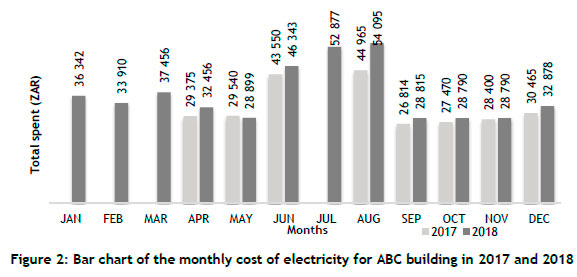
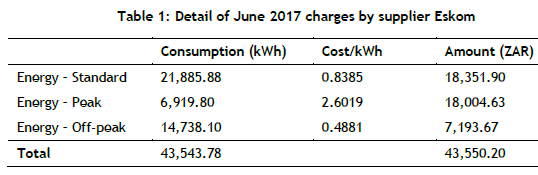
Dividing the total amount by total consumption 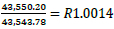 means that, for every kWh, the cost is 1 South African Rand.
4.2.1. e-Gauge data collections and SEU performance
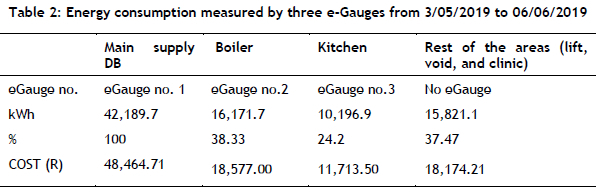
The eGauge placed on building ABC's main supply DB was able to record all of its energy consumption of the building (in kWh), revealing variations in the historical data obtained from Eskom: in May 2017 and May 2018, for example, the respective readings were 47,092 and 47,810 kWh, while in May 2019 the consumption was measured at 42,189.7 kWh. The difference was large. Three eGauges were placed in three places in the building - the first in the main supply DB, the second in the boiler area, and the third in the kitchen -to identify the areas with high electricity consumption. Other areas in the building, such as the lift, void, and clinic, were not connected to the eGauge. Table 2 below illustrates the performance of the areas evaluated in percentages, kWhs consumed, and cost in Rand.
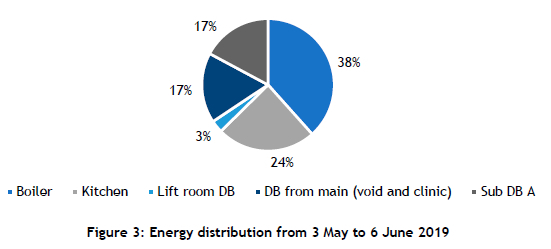
Table 2 shows that eGauge number one (connected to the supplier's main input cable) recorded consumption of 42,189.7 kWh, with the estimated cost of the total consumption of building ABC at R48,464.71. EGauge number two (connected to the boiler, with four elements: 1, 1B, 2, and 3), recorded consumption was 16,171.7 kWh, which was 38.33 per cent of the total consumption with an estimated cost of R18,577.00. Egauge number three (connected to the kitchen distribution board) recorded 10,196.9 kWh, which was 24.2 per cent of the total consumption, at a cost of R11,713.50. The rest of the areas were not connected to the e-Gauge system. The study obtained the non-connected areas' consumption rate by subtracting E-gauge number two and E-gauge number three from eGauge number one - that is, the combined boiler and kitchen consumption was subtracted from the total consumption of the building (see Table 2). The total consumption of the remaining SEUs was 37.47 per cent of the whole building's consumption (Void DB at 17%, Sub-DB A that includes clinic and hair salon at 17%, and lifts at 3%).
4.2.2. Pareto chart
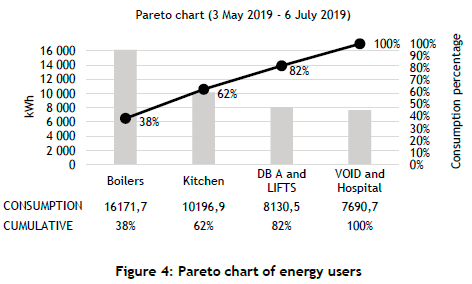
Montgomery [18] explains that Pareto is a useful Six Sigma tool that helps to focus on and target the most critical aspects of the energy consumption argument. Pareto identifies and rates the influencing parameters, and then reduces one big problem before going to the next.
Figure 5 illustrates the Pareto analysis, with the SEUs on the x-axis and the energy consumed on the y-axis. The red diagonal line represents the cumulative percentages of the energy consumed by the SEUs. The Pareto chart classified problems according to their degree of importance (degree of consumption); thus it identified the boiler as the first problem causing the increase in energy consumption, at 38.3 per cent. The kitchen was classified second at 24.2 per cent, making a total of 62.5 per cent of the energy consumed -more than half of the total energy consumed by the building. The sub-DB A and the lifts were classified third, followed by the void and the hospital in fourth place.
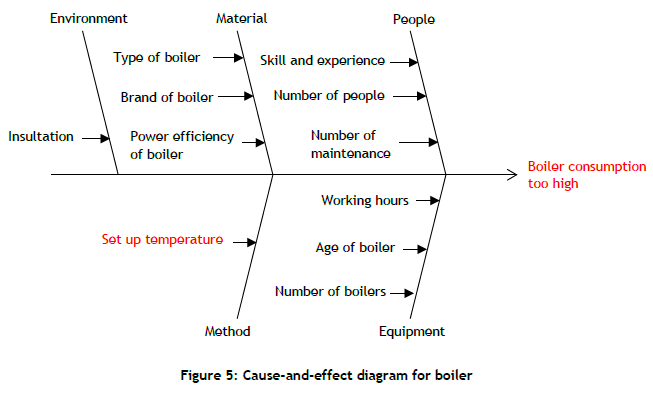
4.2.3. Cause-and-effect diagram of boiler
Based on the information revealed in the Pareto chart in Figure 4, it is crucial to track the causes of variance in the boiler. Therefore, the study constructed the fishbone diagram in Figure 5 to highlight the boiler's environmental, material, people, method, or equipment causes and effects. For instance, in the 'people' category, the increase in boiler consumption could be caused by the rise in the number of people living in the building and using electrical appliances, including hot water. Other causes could be the lack of a maintenance team to conduct timely maintenance of the energy facilities or the lack of skill and experience among the technicians involved in the day-to-day care of the building.
Under 'Method', the lack of the proper digital technology to control information or to manage energy consumption was highlighted as a reason for the higher boiler consumption. With digital technology, the water temperature of the boiler and the timing are determined and controlled by incorporating sensors. Under 'Material', the boiler might generate higher electricity consumption through the lack of boiler isolation fabrics, the boiler being too old, the brand being inefficient, or finally, the type of elements the boiler used.
The high electricity consumption could also be caused by 'Equipment' or 'Material' as shown in Figure 5. Other factors contributing to the high electricity consumption could include (1) the boiler's running time, (2) the boiler's lifespan, or (3) the boiler components used. The significant issues highlighted in the Pareto diagram in Figure 4 and that had a direct impact on the boiler's high consumption included management of the water temperature and boiling time. Incorporating a digital timer (for turning the water heating on and off) into the boiler could be helpful.
4.2.4. Boiler temperature setting
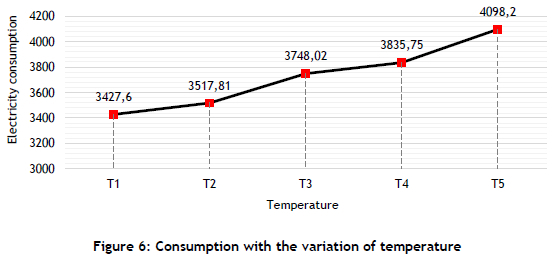
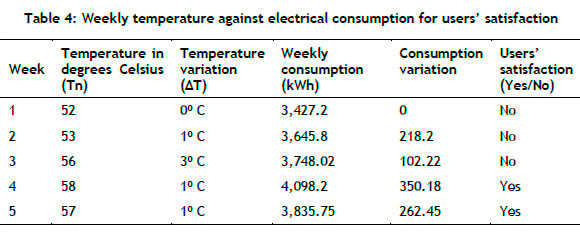
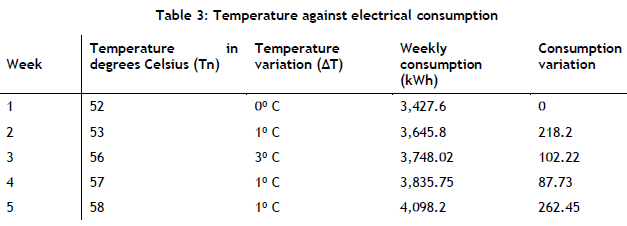
To manage the boiler's timing and temperature more efficiently, a manual digital dial device for boilers could determine and control the water's temperature output and efficient time management. The water temperature output depends on the season, and especially on the number of occupants in the building. The boiler has to work constantly to replenish the rapidly diminishing hot water stock because of high demand, leading to higher electricity consumption and costs. Table 3 describes the boiler's electricity consumption variation against the temperature adjustment for the 35 days of the study.
Figure 6 illustrates the weekly changes in electricity consumption in relation to the temperature variation. In week one, for instance, the boiler's weekly electricity consumption was recorded at the temperature (Γη) shown in Table 3. During the five weeks that were studied, residents complained about bathing in cold water, with boiler temperatures of 52 to 56 degrees Celsius. From 57 degrees Celsius or above, no complaints were recorded, denoting customer satisfaction with the hot water situation.
4.3. Analysis step
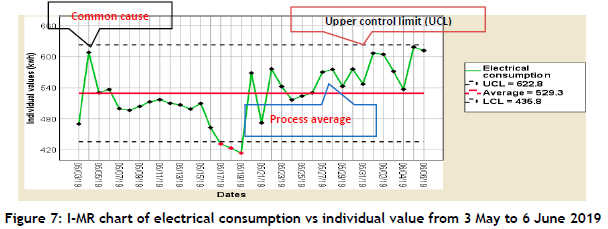
In this step, the data measured in the previous step was used to determine the cause-and-effect relationships and to understand the various sources of inconsistency. The individual and the moving charts shown in Figure 7 and Figure 8 respectively monitor the individuation value and variation change over time and the daily electrical consumption from 3 May 2019 to 6 June 2019. The red horizontal line in each graph represents the average consumption; for the individual chart, it is 529.3 kWh, and for the moving range chart it is 35.2 kWh. The two dashed lines represent the upper and lower control limits respectively, and the green zigzag line in the middle shows the boiler's electrical consumption performance.
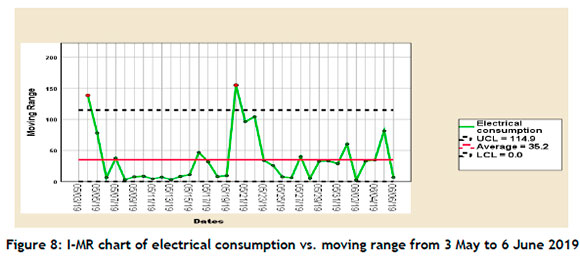
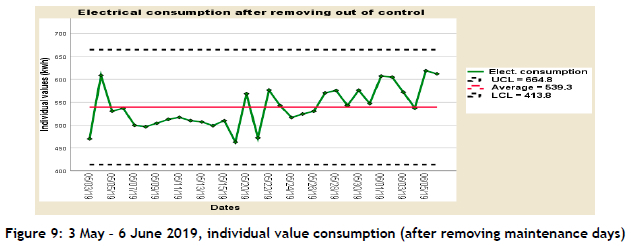
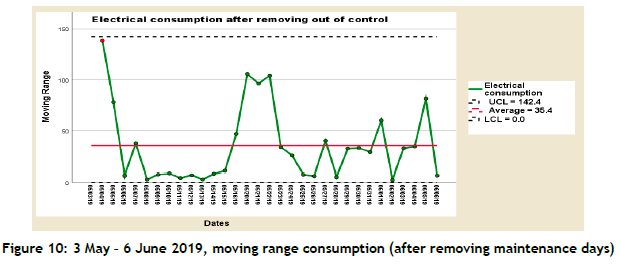
The Individual value chart in Figure 7 shows that the points on 17, 18, and 19 May 2019 were below the lower control limit (LCL). The low individual value (kWh) consumption occurred because the eGauge smart meter was stopped for maintenance. The next step in Figure 9 and Figure 10 was to analyse the relevant data by removing the 'out of lower control' points.
The data is between the control limits, and the process is in control (no special external causes). The performance line, however, shows two patterns. The first part of Figure 9 shows that, in the individual value chart, between 5 May and 16 May 2019 a relatively low boiler temperature (from 52°C to 56°C) was set to heat the water. Meanwhile, in the second pattern, from 22 May to 6 June 2019, the performance line is shown to have gone above the central line when the temperature was increased (56°C to 58°C). From 19 May to 21 May, the consumption performance was close to the average.
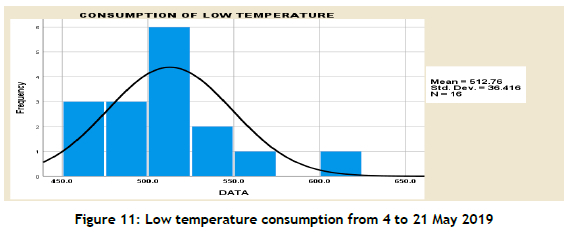
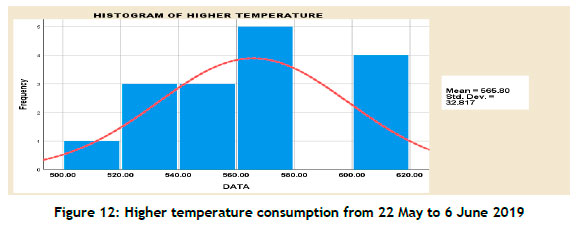
Furthermore, in Figure 11, the electricity consumption mean (average) and standard deviation were at 512.76 kWh and 36.416 respectively for the lower temperatures (from 52°C to 56°C). In Figure 12, the electricity consumption means increased to 565.8 kWh, while the standard deviation decreased to 32.817 for the second part, with the higher temperatures of 56°C to 58°C. The temperature between 56°C and 58°C was satisfactory for residents' requirements. Over the sixteen days, the collected eGauge data (N) was observed with both lower (4 May to 21 May 2019) and higher (22 May to 6 June 2019) temperatures, as shown in both figures below.
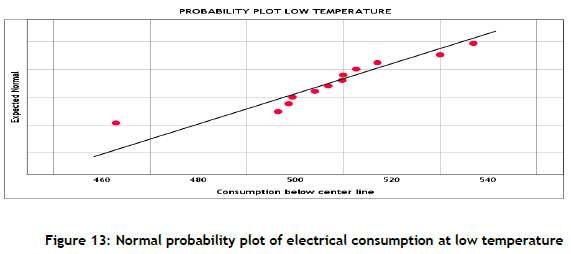
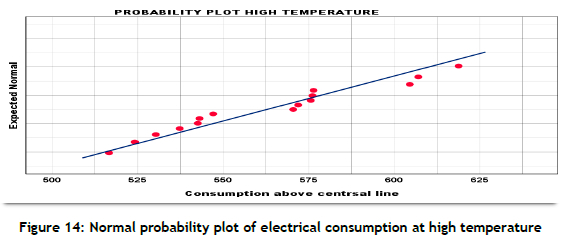
To evaluate whether or not the data was normally distributed, a graphical method called a probability plot (as shown in Figures 13 and 14) was used. According to Cline [19], a normal probability plot is a graphical technique for judging whether a data set is normally distributed. To demonstrate normal distribution, the points should be roughly in a straight line. Furthermore, the power of the normality test uses the family-wise error rate to determine whether to accept or reject the null hypothesis. The distribution is normal if ρ > 0.05 and the distribution is not normal if ρ < 0.05. In that case, the data is assumed to be normal and accepted for the subsequent analysis concerning parametric statement Ρ = 0.054. Figure 13 shows that most of the points were lying in a straight line; and, with (p) = 0.054 being greater than a = 0.05, this proves that the data is normally distributed.

4.4. Improvement step
In the two previous stages, the research focused on determining the factors that influenced energy usage in a building and identifying their sources by interpreting the data that was obtained. The results revealed that the primary cause of the increased use of power was the increase in the boiler temperature. A decision was made on 22 May 2019 to increase the boiler temperature from 56 °C to 58 °C to heat the water and accommodate the users. Every increment in temperature increased electrical consumption and relatively increased the cost of electricity. The results have shown that the water heated to 58 °C satisfied the users, but that the power consumption was substantially increased. Intending to save power consumption and money while satisfying the energy users, this research target decreased the boiler temperature by 1 °C to 57 °C. Table 4 above reveals a drastic increase in energy consumption - to 350.18 kWh - caused by the boilers temperature being increased from 56 °C to 58 °C. By decreasing the temperature to 57° C, not only were the users satisfied, but the consumption decreased to 262.45 kWh.
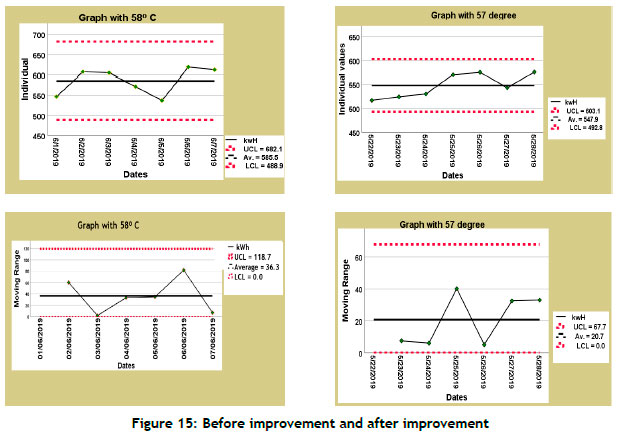
The individual value and the moving chart in Figure 15 below show that, at 57 °C, the average energy usage was 547.9 kWh, while at 58 °C the average energy consumption was 585.5 kWh. With both temperatures being satisfactory to users, using the lower temperature reduced energy consumption by 37.4 kWh (3) and saved the building money.
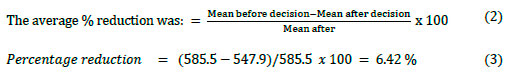
Table 5 describes the weekly electrical consumption, showing it being lower at 57 °C than at 58 °C (3,835.75 kWh < 4,098.2 kWh).
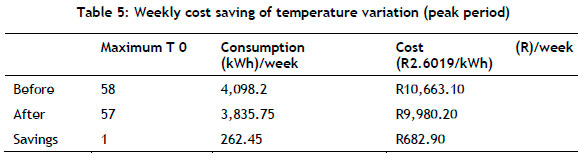
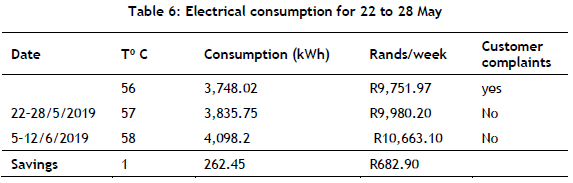
During the research, the Eskom electricity tariff per kWh averaged R1.0326. The price per kWh during the high demand season (peak period) from May to August was R2.6019/kWh compared with R0.8385/kWh for the standard period and R0.4881/kWh for the off period. Table 6 shows that the decrease in energy consumption from 4,098.2 kWh to 3,835.75 kWh led to the saving of over 262.45 kWh weekly (R682.90) during Eskom's peak season price of R2.6019 per kWh.
4.5. Control step
This step aims to ensure that the improvements in electrical consumption will be implemented in the business process and that benefits or savings are quantified. The study found in the analysis step that electricity was wasted by a boiler temperature set to heat the water from 57 °C upwards. At the boiler temperature of 56 °C, the boiler consumption was 3,748.02 kWh, and the users complained. At 57 °C, the boiler consumption was 3,835.75 kWh, and the users made no complaints; and it was the same with the boiler at 58 °C. It was advisable for the building management to introduce an automatic system device to stop the boiler running when the desired temperature is reached and to restart the boiler when the minimum temperature is reached. This means that the temperature range should be from 52 °C to 57 °C in the description of cost savings.
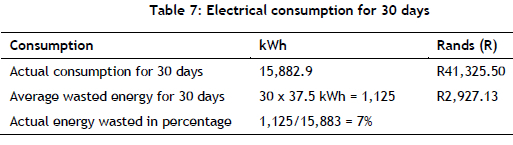
Every week, the building wasted an average of 262.45 kWh (4998.2-3835.75) just because of the boiler, or about 37.5 kWh/day. Over 30 days, the building was wasting 1,124.8 kWh or R2,926.60. The total electrical consumption by the boiler for the 30 days from 3 May to 6 June 2019 was 15,882.9 (see Table 7 below).
5. DISCUSSION
This section describes and illustrates how DMAIC was used by following its steps to discover the factors that contributed to the increased electricity bill for building ABC and to improve its energy use. Three eGauge systems were installed in the building with the aim of collecting the building's daily energy consumption. The use of these tools and techniques was guided by the main structured improvement method known as define-measure-analyse-improve control (DMAIC).
The significant energy users were kitchen appliances, computers, boilers, air-conditioners, lights, lifts, and a cold room.
6. CONCLUSION
This research aimed to identify the factors that contributed to an increase in electricity consumption in building ABC. It started by setting the study's goal and identifying the problem as a monthly increase in electrical energy consumption. The Six Sigma (SS) DMAIC approach helped to provide a framework for continuous organisational improvement. By installing three eGauges in the building to collect data, it was revealed that the boiler was responsible for the high energy consumption and the associated increased cost, followed by the kitchen. The cause was an unnecessary increase in the temperature setup.
In the second step of measurement, all consumption (historical and current) in kWh was gathered. Using quality analysis methods to determine the energy users' performance, the results indicated the following: the boiler represented 38 per cent of the consumption, the kitchen 24 per cent, DB A and the lifts 21 per cent, and others 19 per cent. Using cause-and-effect in the analysis step of the framework to identify the key factors affecting energy consumption, the source of variations was identified through the data aspect.
Through the improvement strategy of using the control method and awareness, the consumption of the boiler alone was reduced by 6.4 per cent, which was 2.4 per cent of the total consumption of the building. After the implementation of the control step of DMAIC, tracking and monitoring the data from the SEU eGauges was important. The methods and analyses presented in this study led to the conclusion that the quality management tools used in the DMAIC approach to problem solving were useful in improving energy consumption. They helped to find the source of the problems, eliminated them, and avoided them thereafter.
This study did not consider external factors such as the weather's impact on hot water usage (for example: What impact does Durban's humid subtropical climate have?). The insolent was placed close to the boiler to contain the heated water. The boiler's lifespan and the maintenance schedule could also influence the boiler's operations. The expectations of the energy reduction campaign run at that time could serve as a foundation for similar energy reduction initiatives for other commercial buildings and industries.
7. RECOMMENDATION FOR FUTURE RESEARCH
Supervising energy usage in commercial buildings needs the daily commitment of management and employees. In this case, a boiler is found as a major factor influencing electrical energy consumption. Moreover, an energy-saving device such as a thermostat needs to be installed to control the on and off as altered by sensed temperatures. Improving energy use in buildings means reducing the electrical amount of energy used by electrical devices. The total amount of electricity used by electrical devices can be continuously supervised, controlled, and reduced, using appropriate managerial techniques for commercial buildings. Improving energy use could also reduce the electrical bills.
The following are some recommendations to reduce electrical usage:
• Continuously measure the consumption; set energy consumption targets (control limits and averages).
• Dynamically manage critical periods of consumption (busy periods, peak periods) by using a behavioral approach (awareness).
• Install smart meters (sub-metering) to monitor consumption performance in buildings, as such measurements.
• Initiate feedback behavior and training of employees from employees. It is possible that the feedback interface's lack of usability in respect of visibility, improvement, and prevention would prevent savings from being achieved.
• Implement a 'Switch off geyser when not in use' awareness campaign to encourage users to switch off equipment whenever it is not being used.
REFERENCES
[1] United Nations Framework Convention on Climate Change (UNFCCC). 2015. Inspiring examples of energy efficiency in urban environments. Available at: https://unfccc.int/news/inspiring-examples-of-energy-efficiency-in-urban-environments [accessed December 2022]. [ Links ]
[2] World Bank. 2022. Urban development. Available at: https://www.worldbank.org/en/topic/urbandevelopment/overview [accessed December 2022]. [ Links ]
[3] Zakari, A., Khan, I., Tan, D., Alvarado, R. and Dagar, V., 2022. Energy efficiency and sustainable development goals (SDGs). Energy, 239. [ Links ]
[4] Sugihara, H. & Tsuji, K. 2008. Energy conservation in urban areas. Transactions on Electrical and Electronic Engineering (IEEJ) 2008(3), 10-14. DOI:10.1002/tee.20226. [ Links ]
[5] Doty, S. & Tuner, W.C. 2004. Energy management handbook. Boca Raton, FL: CRC Press. [ Links ]
[6] Gejdos, P. 2015. Continuous quality improvement by statistical process control. Procedia Economics and Finance, 34, 565-572. [ Links ]
[7] Capehart, B.L. & Wayne, C.T. 2003. Guide to energy management, 4th ed. New York: The Fairmont Press. [ Links ]
[8] South African Alternative Energy Association (SAAEA). 2015. Energy management - the framework of good practice guide - energy management. Available at: http://www.saaea.org/1/post/2015/09/energy-management-theframework-of-good-practice-guide.html [Accessed 20 May 2019]. [ Links ]
[9] Kabuya, K., Lazarus, I.J. & Olanrewaju, O.A. 2021. Application of DMAIC to improve energy consumption in a commercial building. Master's thesis, Faculty of Engineering and the Built Environment, Durban University of Technology. [ Links ]
[10] Cruz-Cázares, C., Bayona-Sáez, C. and García-Marco, T. 2013. You cannot manage right what you can't measure well: Technological innovation efficiency. Research Policy, 42(6-7), 1239-1250. [ Links ]
[11] Govender, P. 2005. Energy audit of the Howard College Campus of the University of KwaZulu-Natal. Master's thesis, Electrical Engineering, University of KwaZulu-Natal. [ Links ]
[12] Rathore, U. 2011. Energy management. New Delhi: S.K. Katara & Sons. [ Links ]
[13] Pyzdek, T. 2003. The Six Sigma handbook. New York: McGraw-Hill. [ Links ]
[14] Kubiak, T.M. & Donald, W.B. 2017. The certified Six Sigma black belt handbook, 3rd ed. Milwaukee WI: ASQ Press. [ Links ]
[15] Wang, H. 2008. A review of Six Sigma approach: Methodology, implementation and future research. International Conference on Wireless Communications, Networking and Mobile Computing, pp. 1-4. [ Links ]
[16] Statistics South Africa. 2018. Mid-year population estimates, 2018. Available at: https://www.statssa.gov.za/?m=2018 [ Links ]
[17] eGauge, 'egauge.com. [Online]. Available: Accessed 24 April 2019]. [ Links ]
[18] Montgomery, D.C. & Woodall, W.H. 2008. An overview of Six Sigma. International Statistical Review/Revue Internationale de Statistique, 76(3), 329-346. [ Links ]
[19] Cline, G. 2019. Nonparametric statistical methods using R. London: Edtech Press. [ Links ]
Submitted by authors 30 Jul 2020
Accepted for publication 11 Jul 2023
Available online 25 Aug 2023
* Corresponding author: 20721974@dut4life.ac.za
ORCID® identifiers
K. Kanyinda: https://orcid.org/0000-0001-7160-8396
I .J. Lazarus: https://orcid.org/0000-0001-6802-0129
O.A. Olanrewaju: https://orcid.org/0000-0001-6802-0129

