


Serviços Personalizados
Artigo
 Inglês (pdf)
 Artigo em XML
 Referências do artigo
Indicadores

Links relacionados
-
 Citado por Google
 -
 Similares em Google
Compartilhar

 Permalink
South African Journal of Industrial Engineering
versão On-line ISSN 2224-7890
versão impressa ISSN 1012-277X
S. Afr. J. Ind. Eng. vol.34 no.1 Pretoria Mai. 2023
http://dx.doi.org/10.7166/33-4-2736
GENERAL ARTICLES
Evaluating the accuracy of a digital correlation system to predict the fatigue failure of additively manufactured parts
S. Botha; J. Fourie; C.P. Kloppers*
Department of Mechanical Engineering, North-West University, South Africa
ABSTRACT
Internal defects that occur during the additive manufacturing process of direct metal laser sintering can have a significant influence on the fatigue performance of Ti-6Al-4V additively manufactured parts compared with parts that are made using traditional manufacturing methods. For the adoption of additively manufactured parts in the medical, automotive, and aerospace industries, the expected fatigue life of parts must be predictable and repeatable for successful application. Micro-CT scanning is commonly used to provide insight into the expected fatigue life of parts by examining internal defects that have occurred during melting. However, using a micro-CT for every part in the supply chain is not always feasible, so alternatives must be considered. One approach would be to analyse parts by applying a shortrun fatigue test coupled with a digital image correlation (DIC) system to detect areas on parts where excessive distortion is taking place. This study investigated the level of accuracy that a DIC system could obtain as an alternative non-destructive test to predict where and when a test specimen would fail. To determine whether this alternative was viable, tests were carried out until the specimens failed. The DIC images were analysed at 50% of the fatigue life and at the point just before failure to determine whether the DIC system accurately indicated the strain concentration at the same point where the specimens failed. Experimental data from the study shows that the DIC system could accurately predict the point of failure at the fatigue half-life in only 10% of the test specimens that were investigated. The DIC system was able accurately to predict the point of failure right before failure occurred in only 25% of the test specimens that were investigated.
OPSOMMING
Interne defekte wat tydens die laagvervaardiging van direkte metaal laser-sintering vorm kan 'n beduidende invloed hê op die vermoeidheid van Ti-6Al-4V onderdele. Mikrofokus rekenaar-tomografie (RT) word algemeen gebruik om insig te bekom oor die vermoeidheid eienskappe van onderdele deur die interne defekte wat gevorm het tydens die laser sintering proses te ondersoek. Die is nie haalbaar om alle onderdele in die voorsieningsketting vir mikrofokus-RT te stuur om die verwagte vermoeidheid te ondersoek nie; daarom moet ander alternatiewe oorweeg word. Een benadering sou wees om onderdele te ontleed deur middel van 'n kort vermoeidheidstoets wat gebruik maak van 'n digitale beeldkorrelasiestelsel wat areas op dele waar oormatige vervorming op onderdele plaasvind, op te spoor. Die akkuraatheid waarmee die digitale beeldkorrelasiestelsel kan voorspel waar en wanneer 'n toetsmonster sou breek tydens 'n vermoeidheid toets is in die studie ondersoek. Eksperimentele data het getoon dat die sisteem die falings punt by die vermoeidheid halfleeftyd akkuraat kon voorspel in slegs 10% van die toetsmonsters wat ondersoek was. In 25% van die toetsmonsters kon die stelsel die falingspunt akkuraat voorspel net voordat die toetsmonster breek.
1. INTRODUCTION
Additive manufacturing (AM) shows great promise to be used for the production of components in various fields of industry. The many advantages of AM, together with its versatile and highly customisable form of manufacturing, mean that it can be used in a wide variety of industrial production sectors. This versatility makes the various types of AM technology an attractive solution for manufacturing complex objects when it would not be possible to use traditional manufacturing techniques [1].
The success of AM depends on how well the manufactured object serves its intended use in its chosen application. According to Tofail, Koumoulos, Bandyopadhyay, Bose, O'Dobogue and Charitidis [2], translating the superiority and convenience of AM in creating shapes and structures into useful products is critical for the adoption of AM in an industrial setup. A number of different technologies in AM can be used to manufacture a part. Direct metal laser sintering (DMLS) technology is a powder bed fusion (PBF) process that uses a high-power fibre laser to create solid layers from loose powder materials and then joins them in a layerwise manner. This manufacturing process is characterised by highly localised heat inputs during very short interaction times, which significantly affects the microstructure [3, 4]. AM can be used to manufacture components using a variety of metallic materials such as stainless steel, nickel alloys, aluminium alloys, and titanium alloys [5]. Ti-6A-4V is an α + β titanium alloy that is known for its high strength, biocompatibility, and corrosion-resistant properties [6]. This material has an alloying content of 6% aluminium and 4% vanadium, and is also the most popular titanium alloy, with applications in the aerospace and biomedical industries, and in many others [5, 7].
Defects in the microstructure of metal additive manufactured parts affect their mechanical properties, and so complicate the entire process of commercialising AM and working towards realising Manufacturing 4.0 [8]. Substantial insight can be gained into the expected fatigue life of a part produced by AM when internal porosities can be observed, usually by using micro-CT scanning [9]. Owing to limited availability, the high cost, and the long lead times of micro-CT scanning, possible alternatives have to be considered.
To be able to apply AM parts in industrial applications such as the medical, automotive, and aeronautical industries, the fatigue lifetime of a part must be known to ensure that the correct maintenance/replacement procedures are in place [10]. Although micro-CT scanning can provide insight into the expected fatigue life of a part, it would be prohibitively expensive to scan each part produced by AM. Applying a short-run fatigue test on each part could provide an alternative non-destructive testing procedure for parts produced by AM. If, during this short run, very low displacement values were measured, conclusions could be reached about the ultimate fatigue life of the part. A digital image correlation (DIC) system could detect areas on the parts where excessive distortion was taking place, leading to the part being discarded owing to insufficient mechanical properties.
DIC is an optical analysis technique that determines an object's deformation by observation with charged coupled device (CCD) cameras, which are sensors used in digital cameras to capture still and moving images [11, 12]. The digital image correlation process determines the shift of small-faceted elements that are identified n the reference image. Such correlation algorithms can determine the maximum displacement with an accuracy of up to 1 /100 pixels [13]. The DIC system has a wide range of applications, and can be used in microscopic investigations of microelectronic or biomedical materials [14, 15]. It can also be used for large-scale measurements, such as with aerospace, automotive, marine, railway, and civil engineering/infrastructural components. The applications also include the principles of physics for the analysis, design, manufacturing, and maintenance of mechanical systems. The application areas include material strength, instrumentation and measurement, kinematics and dynamics, engineering design, and simulation [16-18]. Studies by Icöz, Patriarca, Filippini and Beretta [19] and Gordon, Hochhalter, Haden and Harlow [20] showed how to visualise and detected the strain using a DIC system.
To be able to use DIC and short-run fatigue testing as a non-destructive testing method for AM-produced parts, the identification of excessive distortions in parts needs to be validated. If the DIC system can identify excessive distortion and the location of possible failures, the minimum cycle count needs to be identified and the endurance limit of the material needs to be identified. AM parts goes through various post-processing steps to ensure the part's quality; some of these steps are stress relieving, heat treatments, hot isostatic pressing (HIP), finishing/machining, and polishing [21, 22]. For this study, the samples to be used were as close to the as-built condition as possible, with only the stress relief process having been conducted (to preserve the shape of the samples). The reason for this was to induce the largest possible displacements in the material with the lowest possible cycle count so that the viability of short-run fatigue testing with the DIC as the measurement device could be validated.
2. MATERIALS AND METHODS
2.1. Sample fabrication
The test samples' design configuration was in accordance with the ASTM E606 standard. Ti-6AI-4V test samples were manufactured at the Central University of Technology (CUT) (Bloemfontein, South Africa) using an EOSINT M280 machine equipped with a modulated 200W/400W Yb fibre laser. Samples were manufactured from EOS Ti64 powder (15μm-45μm particle size distribution) with the accompanying standard laser parameters from the manufacturer. Samples (15 of each) were manufactured in two different orientations: 0° (xy-plane parallel to the print bed) and 90° (xz-plane perpendicular to the print bed) (n=15). Following their manufacture, the parts were stress-relieved, followed by the removal of support material and preparation for testing. For the preparation of analysis using the DIC system, a very fine speckle pattern was applied to the test samples.
2.2. Mechanical properties
An MTS Landmark machine was used to perform tensile tests and induce crack propagation in the test specimens. Fatigue tests were carried out over a number of cycles that resulted in the failure of the specimens. During the fatigue tests, a digital image correlation Q-400 system (Dantec Dynamics) was used to accurately detect small displacements during testing.
2.3. Scanning electron microscopy
Scanning electron microscopy (SEM) (FEI Quanta FEG 250 SEM) was used to evaluate the test specimens' point of failure to identify any defects that occurred during the manufacturing process.
3. RESULTS AND DISCUSSION
3.1. Tensile test results
Three specimens per build direction were selected at random and tested. The peak loads obtained from the tensile tests of the Ti6Al4V samples with two different build directions are shown in Table 1. The ultimate tensile stress (UTS), yield stress (YS), modulus of elasticity, and strain obtained are given in Table 2.
From the data shown in Table 1, for each of the three samples manufactured in the 0° orientation, small differences were experienced in the peak load. The mean value was 26.348 kN with a standard deviation of 0.065 kN. For the 90° samples, the mean peak load was measured at 24.570 kN with a standard deviation of 0.171 kN. As can be seen in the data, there was a degree of variance in the peak loads that the samples experienced; however, the data was still within 0.171 kN from the mean load of 24.570 kN. It is clear from the data that these parts exhibited anisotropic behaviour, with the properties in the XY plane significantly differing from those in the parts manufactured in the XZ plane.
The average ultimate tensile stress for the 0° orientation samples was 1094.769 MPa. The data obtained indicated a modulus of elasticity and yield stress of 111.913 GPa and 1077.462 MPa respectively, while the strain was measured as 0.021804 mm/mm. The average UTS and yield stress obtained from the tensile tests were comparable with values obtained from the literature for samples that had been tested in the as-built condition with only stress-relief done on the parts [23]. The samples printed in the XZ plane (the 90o samples) proved to be stiffer, with an average modulus of elasticity 6.34% higher; this could be attributed to the anisotropic behaviour of the parts. Although much stiffer, the parts were only 2.43% stronger in yield than their XY plane printed counterparts.
The mean values for the UTS and yield stress of the 90° samples were 1117.903 MPa and 1103.696 respectively, while the modulus of elasticity obtained was 119.009 GPa and the strain was 0.026131 mm/mm. The UTS for these specimens was within 2% of what was expected from the literature, with the measured UTS at 1117.903 MPa compared with 1096.7 MPa [23]. The yield stress was within 8.5% of what is expected from the literature - 1103.696 MPa compared with the 1017.7 MPa from the literature.
3.2. Fatigue test results
An S-N curve (shown in Figure 1) was set up for the test samples that were subjected to varying loads. By doing this, the endurance limit of the Ti-6Al-4V samples could be determined.
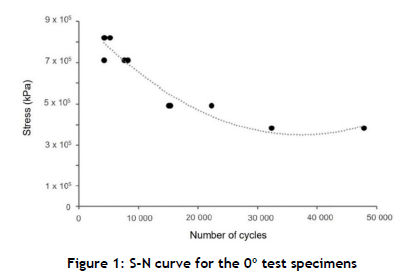
The number of cycles completed at the respective loads of the 0° samples is shown in Table 3.
From the results shown in Table 3 and Figure 1, it can be seen that the samples in the 75% UTS load range grouped well together. Samples B6 and B9 were subjected to a similar number of cycles before fracturing, while sample B5 lasted more than 800 cycles longer before failing. For the 65% UTS range, two samples (B4 and B11) failed at a similar number of cycles, with the third sample (B2) failing at almost half the number of cycles. In contrast, for the 45% UTS range, two samples (B8 and B10) failed at around 15 000 cycles, while the third sample (B1) failed at a greater number of cycles. In the 35% UTS load range, there was a noticeable difference in the number of cycles that each sample completed. Specimen B7 failed before specimen B3. From the data it is clear that, for the specimens of this orientation, the endurance limit was not reached even at a load equal to 35% of the UTS of the material.
The S-N curve of the 90° samples is shown in Figure 2, and Table 4 provides the data for the number of cycles each test sample completed.
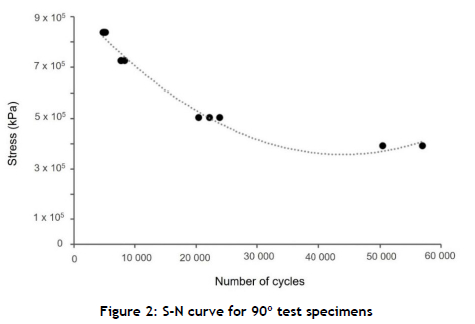
In Table 4 and Figure 2 the ideal grouping for the 75% UTS load range is shown. Similar results were obtained for the 65% UTS load range samples: the samples grouped close together, with one sample (A10) lasting a few hundred cycles longer than the other two (A4 and A7). The three samples in the 45% UTS load range resulted in differing values for the number of cycles that each endured before failure. All three specimens fell within the same region of fatigue life (20 000 - 25 000 cycles), with the difference between the sample that lasted longest and the one that failed first being 3 445 cycles. The test samples that were subjected to 35% of the UTS load both lasted more than 50 000 cycles, with one specimen outlasting the other by more than 6 000 cycles. Once again, from this data it can be noted that the endurance limit was not reached for this orientation at a load of 35% of the UTS.
3.3. SEM results of failed samples
From the results discussed above, for the data of the 35% UTS load range for the 0° orientation, sample B7 failed before sample B3, with 32 330 cycles and 47 895 cycles completed respectively (see Table 3). To observe the surface phenomena of the materials, SEM was used to evaluate the fracture sites to determine whether there were defects that could have led to the samples failing prematurely. Figure 3 shows the micrograph of sample B7.
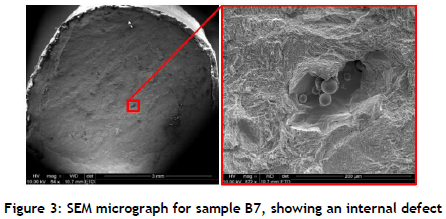
In the enlargement of the fractured surface, an internal defect can be seen along with residual metal powders that did not completely sinter during the manufacturing process. It can be noted that the metal powder is spherical and has differing diameters. This internal defect (porosity), which is about 200μm in length, possibly contributed to the premature failure of sample B7.
For the samples of the 90° orientation, from the data shown in Table 4, sample A2 - which was subjected to the 45% UTS load - failed first and completed 20 403 cycles, compared with the other samples, which completed 22 201 and 23 848 cycles respectively. Figure 4 shows the SEM micrograph of the fracture site of sample A2.
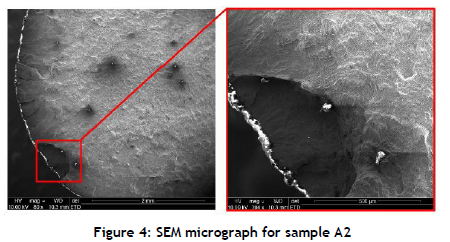
Figure 4 shows the location and size of the defect present at the fracture site of sample A2. The surface defect was of a significant size, measuring almost 500μm in diameter. This defect contributed to the premature failure of the sample. Surface defects in the parts were the main cause of failure in most of the specimens. The literature is clear in arguing that surface defects have the highest impact on the fatigue life of test specimens [24].
3.4. DIC results
During the fatigue tests, the DIC system was being used simultaneously to acquire images of the tests during the procedure. A trigger was activated once the MTS reached a certain load on the rising slope of the stress-life cycle's first cycle. Every 50th cycle was captured to prevent too many images being stored. The images were evaluated using ISTRA 4D software, and the true shear strain was visualised in the images that were obtained.
For the 0° orientation, Figure 5 shows the DIC results of sample B1, which lasted the longest and had the highest number of cycles for the 45% UTS load range. The DIC images could accurately predict where the sample failed; however it could only be seen in the image taken the instant before the specimen failed.
Figure 6 shows the DIC results for sample B2, where the system was unable to predict accurately where that sample would fail.
In respect of the 90° orientation samples, all of those that were subjected to 35% of the UTS load lasted more than 50 000 cycles, with sample A6 outlasting the other samples. Figure 7 shows the DIC results for sample A6, where the system was able to predict accurately where the test specimen would fail. This prediction was accurate for both the image at the halfway mark of the fatigue test and the image taken the instant before failure occurred.
The DIC results for sample A6, which lasted the longest and had the highest number of cycles for the 45% UTS load range, are shown in Figure 7. The DIC images could accurately predict where the sample failed; however it could only be seen in the image taken the instant before the specimen failed.
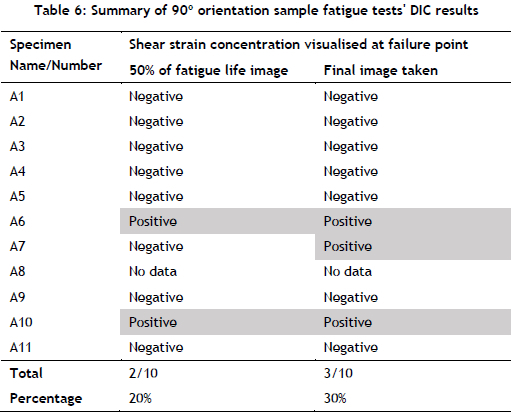
The results of the remaining samples are summarised in Tables 5 and 6. These two tables contain the results of the DIC system's ability to predict the failure point of each sample by visualising the shear strain concentration on images taken of the sample during testing. Where the DIC system was unable to accurately predict the point of failure, the value is given as negative and highlighted in red. In the cases where the DIC was able to predict the point of failure, the value is given as positive and highlighted in green.
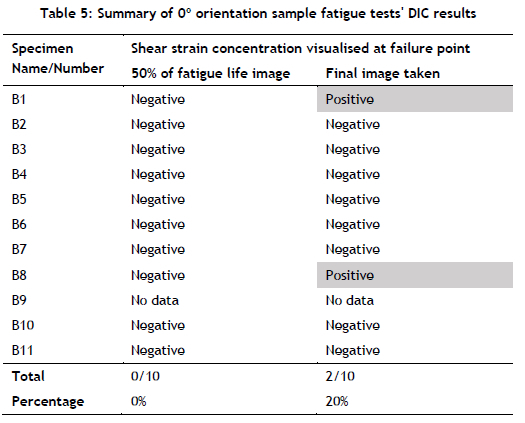
From Table 5 it can be noted that only images taken immediately before failure occurred accurately showed where the specimen would fail. This happened in just 20% of the samples that were tested in this orientation.
From Table 6 it is clear that the DIC accurately predicted where the specimens would fail in 20% of the images taken at half-life and in 30% of the images taken immediately before failure occurred.
4. CONCLUSION
The purpose of the study was to determine whether or not a DIC system could be used to determine the fatigue life of Ti-6Al-4V tensile test specimens. Discovering this entailed completing the fatigue tests until failure occurred. The evaluated images obtained from the DIC system would be used to scrutinise the fracture point and to identify at what percentage of the fatigue life the strain first appeared in the same area where the failure occurred. From the study, the following conclusions were reached:
• The Ti-6Al-4V test specimens reacted very brittlely during testing, as was expected for the stress-relieved condition, in the sense that it failed catastrophically. The specimens did not show significant signs of strain in the form of necking before failing. The accuracy of the DIC system was tested with this in mind to determine whether it could accurately identify the strain concentration in the specimens. It was possible to capture images in which the DIC accurately predicted where the specimen would fail, but it rarely happened.
• The surface defects that were present in the parts were considered to be the main cause of failure in most of the specimens.
• The DIC system is not a viable testing system to replace other non-destructive testing methods, such as micro-CT scanning, for Ti-6Al-4V test specimens that have been additively manufactured and tested in the stress-relieved condition.
• Owing to the brittle nature of the material tested and the rate at which the testing was conducted, it could be concluded that the use of a DIC system to predict the fatigue life of Ti64 parts is not feasible. No significant distortion was noticeable to be able to use this as a tool to predict the failure of the material well in advance of its actual failure.
ACKNOWLEDGEMENTS
The South African Department of Science and Technology is acknowledged for support through the Collaborative Programme for Additive Manufacturing (CPAM).
REFERENCES
[1] DebRoy, T., Wei, H., Zuback, J., Mukherjee, T., Elmer, J., Milewski, J., Beese, A.M., Wilson-Heid, A., De, W. & Zhang, W. 2018. Additive manufacturing of metallic components - process, structure and properties. Progress in Materials Science, 92, pp 112-224. [ Links ]
[2] Tofail, S.A., Koumoulos, E.P., Bandyopadhyay, A., Bose, S., O'Donoghue, L. & Charitidis, C. 2018. Additive manufacturing: Scientific and technological challenges, market uptake and opportunities. Materials Today, 21(1), pp 22-37. [ Links ]
[3] Baca, A., Konecná, R., Nicoletto, G. & Kunz, L. 2016. Influence of build direction on the fatigue behaviour of Ti6Al4V alloy produced by direct metal laser sintering. Materials Today: Proceedings, 3(4), pp 921-924. [ Links ]
[4] Baca, A., Konecná, R. & Nicoletto, G. 2017. Influence of the direct metal laser sintering process on the fatigue behavior of the Ti6Al4V alloy. Materials Science Forum, 891, pp 317-321. [ Links ]
[5] Foehring, D., Chew, H.B. & Lambros, J. 2018. Characterizing the tensile behavior of additively manufactured Ti-6Al-4V using multiscale digital image correlation. Materials Science and Engineering: A, 724, pp 536-546. [ Links ]
[6] Liu, S. & Shin, Y.C. 2019. Additive manufacturing of Ti6Al4V alloy: A review. Materials & Design, 164, 107552. [ Links ]
[7] Karlsson, J., Sjögren, T., Snis, A., Engqvist, H. & Lausmaa, J. 2014. Digital image correlation analysis of local strain fields on Ti6Al4V manufactured by electron beam melting. Materials Science and Engineering: A, 618, pp 456-461. [ Links ]
[8] Dilberoglu, U.M., Gharehpapagh, B., Yaman, U. & Dolen, M. 2017. The role of additive manufacturing in the era of industry 4.0. Procedia Manufacturing, 11, pp 545-554. [ Links ]
[9] Hu, Y., Wu, S., Withers, P., Zhang, J., Bao, H., Fu, Y. & Kang, G. 2022. The effect of manufacturing defects on the fatigue life of selective laser melted Ti-6Al-4V structures. Materials & Design, 192, 108708. [ Links ]
[10] Seifi, M., Gorelik, M., Waller, J., Hrabe, N., Shamsaei, N., Daniewicz, S. & Lewandowski, J.J. 2017. Progress towards metal additive manufacturing standardization to support qualification and certification. The Journal of The Minerals, Metals & Materials Society, 69(3), pp 439-455. [ Links ]
[11] Nicoletto, G., Marin, T., Anzelotti, G. & Roncella, R. 2011. Application of high magnification digital image correlation technique to micromechanical strain analysis. Strain, 47, e66-e73. [ Links ]
[12] Abu, S.H.K., Cao, X.J., Gholipour Baradari, J., Wanjara, P., Cuddy, J., Birur, A. & Medraj, M. 2012. Determination of global and local tensile behaviours of laser welded Ti-6Al-4V alloy. Advanced Materials Research, 409, pp 859-864. [ Links ]
[13] Buttlar, W.G., Hill, B.C., Kim, Y.R., Kutay, M.E., Millien, A., Montepara, A., Paulino, G.H., Petit, C., Pop, I.O. & Romeo, E.J.M. 2014. Digital image correlation techniques to investigate strain fields and cracking phenomena in asphalt materials. Materials and Structures, 47(8), pp 1373-1390. [ Links ]
[14] Palanca, M., Tozzi, G. & Cristofolini, L.J. 2016. The use of digital image correlation in the biomechanical area: A review. International Biomechanics, 3(1), pp 1-21. [ Links ]
[15] Niu, Y., Wang, J., Shao, S., Wang, H., Lee, H. & Park, S.J. 2010. A comprehensive solution for electronic packages' reliability assessment with digital image correlation (DIC) method. Microelectronics Reliability, 87, pp 81-88. [ Links ]
[16] McCormick, N. & Lord, J.J. 2010. Digital image correlation. Materials Today, 13(12), pp 52-54. [ Links ]
[17] Mousa, M.A., Yussof, M.M., Udi, U.J., Nazri, F.M., Kamarudin, M.K., Parke, G.A., Assi, L.N. & Ghahari, S.A. 2021. Application of digital image correlation in structural health monitoring of bridge infrastructures: A review. Infrastructures, 6(12), 176. [ Links ]
[18] Tekieli, M., De Santis, S., De Felice, G., Kwiecien, A. & Roscini, F.J. 2017. Application of digital image correlation to composite reinforcements testing. Composite Structures, 160, pp 670-688. [ Links ]
[19] Içöz, C., Patriarca, L., Filippini, M. & Beretta, S. 2014. Strain accumulation in TiAl intermetallics via high-resolution digital image correlation (DIC). Procedia Engineering, 74, pp 443-448. [ Links ]
[20] Gordon, J., Hochhalter, J., Haden, C. & Harlow, D.G. 2019. Enhancement in fatigue performance of metastable austenitic stainless steel through directed energy deposition additive manufacturing. Materials & Design, 168, 107630. [ Links ]
[21] Kumbhar, N.N. & Mulay, A.V. 2018. Post processing methods used to improve surface finish of products which are manufactured by additive manufacturing technologies: A review. Journal of the Institution of Engineers (India), 99(4), pp 481-487. [ Links ]
[22] Peng, X., Kong, L., Fuh, J.Y.H. & Wang, H. 2021. A review of post-processing technologies in additive manufacturing. Journal of Manufacturing and Materials Processing, 5(2), 38. [ Links ]
[23] Beretta, S. & Romano, S.J. 2017. A comparison of fatigue strength sensitivity to defects for materials manufactured by AM or traditional processes. International Journal of Fatigue, 94, pp 178191. [ Links ]
[24] Hibbeler, R.C. 2005. Mechanics of materials, 6th ed. New Jersey: Pearson Prentice Hall. [ Links ]
Submitted by authors 19 Apr 2022
Accepted for publication 30 Sep 2022
Available online 26 May 2023
* Corresponding author: cp.kloppers@nwu.ac.za
ORCID® identifiers
S. Botha: https://orcid.org/0000-0002-4975-0721
J. Fourie: https://orcid.org/0000-0001-9796-4153
C.P. Kloppers: https://orcid.org/0000-0001-5942-0251

