


Serviços Personalizados
Artigo
 Inglês (pdf)
 Artigo em XML
 Referências do artigo
Indicadores

Links relacionados
-
 Citado por Google
 -
 Similares em Google
Compartilhar

 Permalink
South African Journal of Industrial Engineering
versão On-line ISSN 2224-7890
versão impressa ISSN 1012-277X
S. Afr. J. Ind. Eng. vol.34 no.1 Pretoria Mai. 2023
http://dx.doi.org/10.7166/34-1-2699
GENERAL ARTICLES
A new flow-based model of end-to-end integration in premium product supply chains
R.A. Alcívar-EspínI, II, *; Y. ChouI; C. TsaoI
IInstitute of Industrial Engineering, National Taiwan University, Taiwan
IIFacultad de Ciencias Administrativas, Escuela Politécnica Nacional, Ecuador
ABSTRACT
Driven by the total cost of ownership, US-China trade and technology competition, and the COVID-19 pandemic, global supply chains are undergoing a major restructuring that will soon transform business and economics all over the world. Recently, supply chains with end-to-end integration for premium agri-food products have emerged as a new business model. This paper examines how they should function, and identifies the supply chain structure/production/business conditions necessary for their development. We study a premium supply chain consisting of many small farms that produce top-quality bananas, one integrator firm, and thousands of retail stores. We use industry and business data to calibrate a multiple-route flow-based model from farms to integrator to retailers/markets. We then use sensitivity analysis to illuminate the stakeholders' decision behaviour, and identify and discuss three main decision issues: contract farming, capacity strategy, and business robustness. For contract specification, contracting on price rather than quantity is conducive to coordinating the interests of the stakeholders. For the capacity strategy, the integrator should source raw products from many small farms rather than fewer large farms. For business robustness, the integrator could still ensure robust profits by regulating its product supply when new competitors arise or demand changes. These results are tested under various scenarios to determine the impact of input parameters or supply chain structure, and are verified with an industry practitioner who has experience with multiple premium agri-food products. The results, along with the flow model and its computation procedure, could be used by supply chain planners to start new businesses or to differentiate retailers' premium product offerings in competitive business environments.
OPSOMMING
Gedryf deur die totale koste van eienaarskap, handel en tegnologie-mededinging tussen die Verenigde State van Amerika en China, en die COVID-19-pandemie, ondergaan wêreldwye voorsieningskettings 'n groot herstrukturering wat binnekort die besigheid en ekonomie oor die hele wêreld sal transformeer. Onlangs het voorsieningskettings met end-tot-end-integrasie vir premium landbouvoedselprodukte as 'n nuwe sakemodel na vore gekom. Hierdie artikel ondersoek hoe hulle moet funksioneer, en identifiseer die voorsieningskettingstruktuur / -produksie / - besigheids toestande wat nodig is vir hul ontwikkeling. Ons bestudeer 'n premium voorsieningsketting wat bestaan uit baie klein plase wat piesangs van topgehalte produseer, een integreerfirma en duisende kleinhandelwinkels. Ons gebruik industrie- en besigheidsdata om 'n meervoudige roete-vloei-gebaseerde model te kalibreer van plase tot integreerder tot kleinhandelaars/markte. Ons gebruik dan sensitiwiteitsanalise om die belanghebbendes se besluitgedrag te analiseer, en identifiseer en bespreek drie hoofbesluitkwessies: kontrakboerdery, kapasiteitstrategie en besigheidsrobuustheid.
Vir kontrakspesifikasie is kontraktering op prys, eerder as hoeveelheid, bevorderlik om die belange van die belanghebbendes te koördineer. Vir die kapasiteitstrategie moet die integreerder rou produkte van baie klein plase verkry eerder as minder groot plase. Vir besigheid se robuustheid kan die integreerder steeds robuuste winste verseker deur sy produkaanbod te reguleer wanneer nuwe mededingers ontstaan of vraag verander. Hierdie resultate word onder verskeie scenario's getoets om die impak van insetparameters of voorsieningskettingstruktuur te bepaal, en word geverifieer met 'n bedryfspraktisyn wat ondervinding het met veelvuldige premium agri-voedselprodukte. Die resultate, tesame met die vloeimodel en sy berekeningsprosedure, kan deur voorsieningskettingbeplanners gebruik word om nuwe besighede te begin of om kleinhandelaars se premium produkaanbiedinge in mededingende besigheidsomgewings te onderskei.
1. INTRODUCTION
Global supply chains are undergoing major restructuring. The outsourcing trend that started in the 1980s has slowed down, and onshore manufacturing has gained due consideration from the perspectives of firms' dynamic capabilities and total cost of ownership [1]. The US-China trade and technology competition and the COVID-19 pandemic are also driving forces of supply chain restructuring. These forces will soon transform business and economics all over the world.
1.1. Problem description
In recent years, premium agri-food products have emerged as a new retail food category, driven by consumer demand for quality [2] and environmentally friendly business practices [3]. New categories, such as organic food and safety-standard-compliant foods, have been created by enforcing safety practices, ethical standards, and process-based certification [4]. There are two types of agri-food supply chain: perishable products and non-perishable staple foods. Typical perishable agri-food supply chains consisting of farm producers, factors, processors, distributors, wholesalers, and retailers exhibit several characteristics that differentiate them from manufacturing supply chains - e.g., weather conditions, environmental (air, water) concerns, multiple stakeholders, and complex food safety regulations. Perishable foods are also produced mostly by small farm operators who have different attitudes towards the cluster benefits of networking, human resources, and common propagation [5]. As a result, many agri-food supply chains are fragmented in structure. Unlike traditional manufacturing chains, in which the same factory can manufacture two grades of the same product, distinct supply chains need to be developed for premium agri-food products [6].
According to a traditional producer-centric approach, a single firm with a large farm could be the sole producer and distributor of a premium agri-food product. An alternative approach, however, could vertically integrate small producers with food processors and marketers [7]. In fact, vertical integration is a significant determinant of firms' innovation behaviour [8], and is most advantageous when consumption patterns must be gradually learned at the same time that seed and production technologies undergo experimentation. In a review of business model innovations, Tell et al. [9] point out the shortcomings of the traditional producer-centric approach, and suggest that entrepreneurs engage in business model innovation on the basis of production technologies and institutional innovation. Using small producers through vertical integration has the additional benefit of improving social welfare when small farm operators are an economically disadvantaged group in conventional agri-food supply systems.
1.2. Literature overview
Supply chain integration (SCI) describes the process of connecting decisions and actions across firms in the same chain [10]. It is a major form of supply chain restructuring, and it also facilitates shortening supply chains to improve their economic and environmental sustainability [11]. The successful implementation of supply chain strategies depends on the stakeholders' actions and reactions and the characteristics (fairness, trust, etc.) of the supplier-buyer relationship [12]. Transaction cost economics, resource-based considerations, and the learning organisation, which are the dominant theories in the SCI literature [13], explain the motivations for integration and identify opportunities for improvement. At the operational level, SCI is classified into functional, logistical, informational, and process integration. Integration also mostly spans zero, one, or two firms in an upward or downward direction [14]. The most popular route starts with enhancing internal effectiveness, followed by upstream streamlining and downstream integration [15]. Most studies use dyadic and triadic models for making inventory, scheduling, fulfilment, and retail pricing decisions [16, 17].
End-to-end integration, the widest span of integration, encompasses both the production end and the market end. More complicated than dyadic and triadic integration, its benefits are substantial and strategic. For instance, a firm could enter markets that might have seemed too volatile under a traditional non-integrated chain [18], or a new market could be created outright. An exceptional example is Nestlé Nespresso, which developed a new premium coffee business around capsule coffee machines and a multi-stakeholder supply network [19]. On the supply side, Nestlé provides supporting services, bank loan guarantees, and production inputs to small farmers, and pays them a premium price. By operating small plants close to its markets, Nestlé maximises the use of local materials.
In general, the literature on vertical integration aims to answer the questions 'what' and 'why' [13, 18, 20] - i.e., what does integration do, and what are its objectives? - whereas we want to answer the question 'how' - i.e., how can a premium chain be developed, and what are the proactive implications for business development? We are motivated by a further understanding of the role of product differentiation as a determinant of vertical integration, and by Fernández-Olmos et al. [20], who suggest that mitigating opportunism and managing unforeseen contingencies must be addressed in integration efforts.
1.3. Objective and methodology
The end-to-end problem we investigated is characterised by (1) differentiated perishable agri-food products for retailing, (2) a large number of small producers, and (3) developing a new business from a fragmented supply system. The purpose of this paper is to examine how end-to-end supply chains should function, and to identify the chain structure/production/business conditions necessary for their development. We studied a premium banana case in Taiwan. The Dole Food Company provides premium bananas to several thousand convenience stores (the 7-11 chain) in Taiwan. Dole Food is the integrator and the small farmers are the primary producers under contract. Besides providing agricultural advice, Dole Food operates postprocessing facilities for ripening raw bananas in a temperature- and humidity-controlled environment. The convenience stores sell the bananas by the piece or in packages at prices several times higher than those in traditional retailing channels. This integrated chain is so successful that other produce such as fruit corn has been added to the chain stores' product offerings, and the premium agri-food business has been imitated by other convenience chain stores. Therefore, this banana end-to-end chain is suitable for a case study.
We construct a flow model of multiple routes to the markets by reviewing local business magazines and government publications. We then collect production and business data to calibrate the model and to explore the stakeholders' possible decision behaviour. Since there is uncertainty in production, market, and chain structure (the number of contract farmers and the product flow in multiple routes), the results are tested under various scenarios to determine the impact of input parameters and supply chain structure, and verified with an industry practitioner who has experience with multiple premium agri-food products.
The remainder of this paper is organised as follows. Section 2 presents our flow-based model and the case study. Section 3 discusses the industry and business data. Section 4 explains the business economic analysis of the integrator. Section 5 explains the three main decision points: contract farming, capacity strategy, and business robustness. We also validate and discuss the results in that section. Conclusions are drawn in the final section.
2. A FLOW-BASED MODEL CASE STUDY OF END-TO-END PREMIUM CHAINS
In this section we present our flow-based model for our case study of an end-to-end premium chain of supplying bananas in Taiwan. Figure 1 illustrates the structure of the premium chain and its surrounding system. There are two formal channels of distribution: premium and traditional. The premium channel has three stakeholders: independent small farms, an integrator, and a chain of retail stores. The integrator signs supply contracts with multiple farmers and a distribution contract with the management of the retail stores. The traditional distribution channel has long been dominated by large wholesalers, and in recent years the government of Taiwan has established public auction agencies to improve market efficiency, which significantly benefits small farmers. In this case study, the size of the contract farms is one hectare. N denotes the total number of contract farms, and the supply contract arrangements specify a contract price pc and a contract quantity qc. Farms are not penalised for producing less than qc.
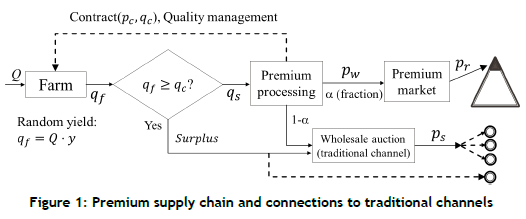
The premium channel has one stage of production and one stage of processing. Q denotes the input quantity to a farm, qf denotes the random output, where the subscript f denotes a farm or farmer, and y denotes the random yield rate. If the actual output is greater than qc, then the surplus is sold through the traditional channel in a public auction, also called the secondary market, at price ps. qs and qs = min(qf,qc) denote the actual quantity supplied to the processing stage (ripening, quality screening, packing, etc.). Since the bananas must be premium grade, we call the retail chain stores 'the premium marketplace'. We use the parameter α, 0 < α < 1 to represent the fraction of qs sent to the chain stores and use (1 - a)qs to represent the remainder sent to the traditional channel.
The farmers can also sell their bananas at their farms, self-owned stores, and local stores. Depending on market conditions, they might receive higher net profits. We consider these farmers' outside opportunism as tertiary venues, and do not include them in our model. The bottom dashed line in Figure 1 denotes the tertiary venues.
We call our model a flow-based model because the farm outputs from the supply base are sent to the processing plant over the whole year, instead of monthly or seasonally. The processed products are sent separately to the premium and secondary markets. Parameter α represents the lever for controlling the product quantity sent to the premium market, which also insulates the premium market from the volatility of farm output and farmers' opportunism.
The traditional channel is anchored on a public auction. A government agency publishes the secondary market price ps on the internet. We denote the retail price in the premium market as pr and the purchase cost to the retailer as pw. The difference pr - pw is the retailer's gross profit. We represent market demand qr by an exponential function, such that demand decreases with price at a rate faster than a linear function:

where λ is a price parameter and M is market size. This demand function is a common willingness-to-pay model in the literature [21]. Letting the unit cost of premium processing be k, the profit function for the integrator, denoted by subscript m, is
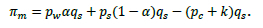
The profit function for each farmer is
where c is the unit production cost of farming. The total production cost cQ is a sunk cost, which is irrelevant in our analysis, so we assume the marginal production cost c to be zero without loss of generality. We assume that farmers incur no penalty for shortages in farm output.
3. DATASET AN D ANALYSIS
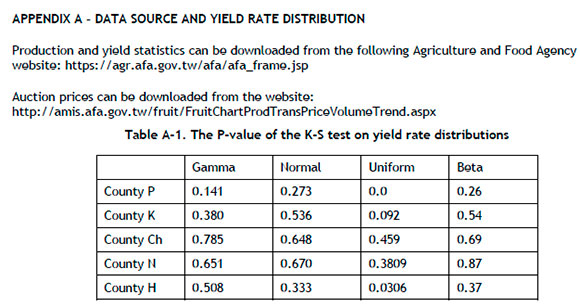
Taiwan has a long history of banana production [22]. The two government agencies, the Agriculture and Food Agency and the Taiwan Banana Research Institute, collect and publish the production and yield statistics of bananas, as well as other agricultural products. We download the panel data of bananas for five farming counties from 1997 to 2017 from the Agriculture and Food Agency database (website in Appendix A). Because premium bananas are supplied to the market over the whole year, it is essential that we include farming counties with different planting seasons. We use the panel data to estimate the random yield rate by using statistical tests.
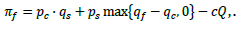
Table 1 lists the results of statistical tests on the yield rate distribution for the three major counties of the five. (Table A-1 of Appendix A lists the P-value of the K-S test of the yield data of the five counties and four candidate probability distributions.)
Reading down the 'normal distribution' column, the average yield rate of the three counties from the warmer south to the cooler north is 0.56, 0.53, and 0.39 respectively. The standard deviation confirms the general belief about the volatility of farm production in Taiwan. The support of the beta distribution function is the interval [0, 1], which is very suitable for directly modelling the yield rate, unlike the gamma and normal distribution, which might give extreme values outside the interval [0, 1]. We use the beta distribution in this paper. Nevertheless, the generality of our analysis methodology is not lost.
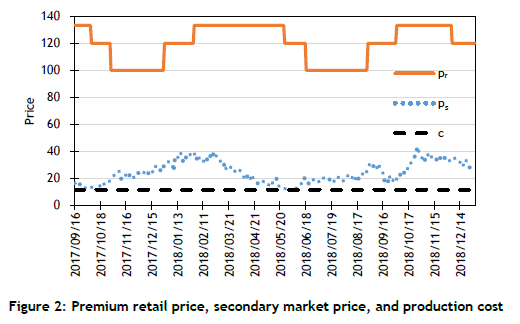
Figure 2 below shows the retail price data from the shelf tag collected daily for 15 months. The retail price is collected from stores in Taipei. The price is the same in all stores. We download the secondary market price from the wholesale trading database maintained by the Agriculture and Food Agency (website in Appendix A). For both time series of pr(t) and ps(t), the prices are lower in summer than in winter, which is consistent with Chadwick and Nieuwoudt [23]. The pr(t) lags ps(t) slightly, although the range of variations is similar. It is logical that the premium market reacts with a time lag to the seasonal supply of the general market. The average prices are pr=119.7=120 and ps=24.6. The daily sale is around 9 589 kilograms (kg). All prices are in USD. As the production cost does not vary significantly across major production counties, we use the national average as the production cost.
In Chadwick and Nieuwoudt [23], the estimate of banana price elasticity under constrained supply generally falls between 1.42 and 1.52. By assuming a price elasticity of 1.5, we calibrate the demand function of Equation 1 as
and with the average price of 120, sale quantity of 9589, and e =1.5, we solve for M and λ
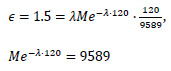
and obtain λ = 0.0125 and Μ = 42975.
Business-to-business negotiations determine the wholesale price between the integrator and the retailer, and both parties revise the price when there are substantial changes in the marketplace. Because the chain stores sell hundreds of food and non-food products, industry practice calls for managing the gross profit rates of the product assortment. In our case study, the gross profit margin of the retail chain stores is 32.3%, 32.8%, and 33.2% respectively from 2015 to 2017, based on the publicly available financial statements of the Taiwan 7-11 chain. The difference between the wholesale price and the retail price is the mark-up. We use the average gross profit margin as our reference value for mark-up, and include the following data taken from the Taiwan Banana Research Institute:
• The production input Q = 45 000 per hectare.
• The premium processing cost k = 14.0 per kg.
• The farm production cost c = 11.37 per kg.
4. BUSINESS ECONOMIC ANALYSIS OF THE INTEGRATOR
We incorporate the stakeholders' decision logic and Taiwan's banana industry data into our model. As described above, the yield rate is an essential variable, so we let yield rate y follow a probability distribution with density function f(y) and cumulative distribution function F(y). We let qc specify the contract quantity for one hectare of farmland. We define yc = qc/Q by converting the contract quantity qc to a corresponding target yield rate yc on the fixed input Q - i.e., yc is the normalised qc. We express the supply from each farm as

We let ys = min(y, yc). We express the expected value of the supply as

where ys is the normalised qs. By definition and the Leibniz integration rule,

The last (integral) term is the shortage in yield rate as a result of a poor harvest. We can use Equation 2 to calculate the average supply per farm under random yield. Note that the expected supply per unit of farmland is a function of the contract quantity, as shown in Equation 3 - i.e., qc is implicit in E[ys].
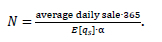
The integrator in our case study sources raw bananas from the small farms under contract. Supposing there is one harvest in a year, the minimal number of farmers, N, that the integrator needs to meet market demand is
We determine the market-clearing price by solving the demand and supply equation

where demand on the left-hand side is a function of the retail price pr and supply on the right-hand side is a function of qc and N. Rewriting Equation 4, the market-clearing price is

The yearly profit of the integrator, nm, equals the profit obtained from selling the supply of each farm multiplied by the number of farms under contract:
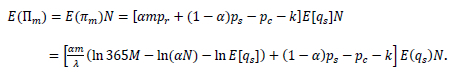
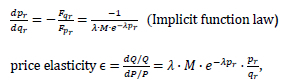
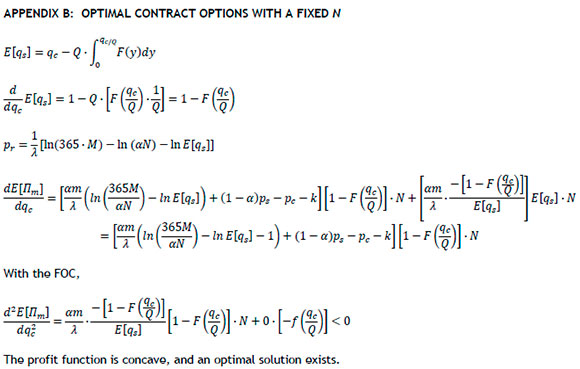
The fact that the two parameters of the supply contract are not independent is a characteristic of end-to-end integrated chains. Therefore, one is derivable from the other. For any given N, we obtain the profitmaximising contract quantity from the necessary condition dE(jim)/dqc = 0 (see Appendix B):

After simplification:

which relates the two parameters of the contract. For each qc, since we can solve for a corresponding pc and vice versa, Equation 6 specifies a trajectory of the optimal contract arrangements. The trajectory represents all optimal contract solutions. This is a result of the integrator optimising the profit. We refer to the trajectory as 'optimal contract' (OC) and designate the trajectory as an implicit function OC(pc, qc) = 0. In numerical example 1 below, Equation 6 is general for all distribution functions of the yield rate, and we apply it to the beta distribution.
4.1. Numerical example 1: Matching demand with supply
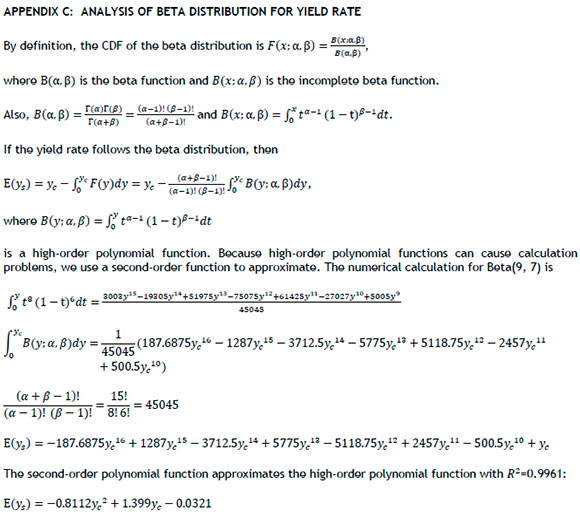
In numerical example 1, the yield rate follows the beta distribution beta(9,7). The resulting formula for the E[ys] of Equation 3 will be a polynomial function of 16 degrees. Nevertheless, regression by a second-degree polynomial is a good approximation with fi2=0.9961 (see Appendix C):
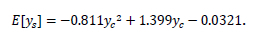
By substituting this expression of E[ys] into Equation 6, we obtain

and use Equation 7 to calculate an optimal contract price for each contract quantity. In Figure 3 below we plot the OC along with two other demand functions at different stages of the supply chain. We let α = 0.8, m = 0.7, ps = 24.6, and N = 200. Figure 3 also shows the functional relationships in the price-quantity space.
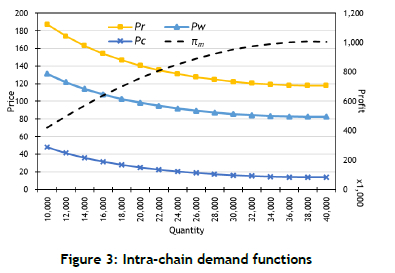
The top curve is the market demand function pr(qr), the middle curve is the relationship between pw and qr, with pw = m- pr, and the bottom curve is the OC. Plotting the expected profit of the integrator by using the right axis for each contract quantity reveals that the integrator's profit is concave and that it increases with the contract quantity, but at a decreasing rate.
Next, we explain the other three curves. Considering that a supply chain of multiple stages is a sequence of long-term demand-supply relationships, one for each stage, we represent each relationship by a demand function or inverse demand function. All firms in each stage constitute a horizontal market - i.e., a duopoly or oligopoly - and the horizontal markets might have different market structures. If a supply chain is non-integrated, the horizontal markets are more or less independent, and in an integrated chain they are tightly coupled. Figure 3 shows the three curves representing the intra-chain demand functions from the supply chain's market end to the producer end. The premium market determines the top curve, but it is up to the integrator to decide the size of the premium market by controlling the supply. The gap between the top and middle curves equals the retailer's mark-up; high mark-ups indicate high market power. The middle curve also imposes a ceiling on the planning space for specifying the farm contract. In this space, the integrator's profit-maximising behaviour determines the OC curve at the bottom. The integrator and farmers need to settle on a specific point of the curve that suits their respective interest. The three intra-chain demand functions characterise the interactions between the stakeholders, and the spacing between the demand functions represents the prospect of profit allocation.
5. DECISION POINTS: CONTRACT FARMING, CAPACITY STRATEGY, AND BUSINESS ROBUSTNESS
We would like to know which parameter in the supply contract is more effective at resolving conflicts in the negotiation process. Therefore, we need to ask:
• Should the supply contract arrangements focus on contract price or on contract quantity?
• What guidelines are required for the integrator using a supply base of multiple small farms or fewer large farms?
• Should a new competitor appear, how should the integrator respond? Does the premium chain generate robust profits?
We analyse the decision points for three cases below. Section 5.1 discusses the case of a single farmer, Section 5.2 discusses the case of multiple farms, and Section 5.3 discusses the case of varying the parameters λ and α.
5.1. Single farmer case and contract farming decisions
In the absence of a premium chain, the farmers are most likely to sell their farm output mainly to the secondary market. For brevity, H denotes the premium market and L denotes the secondary market. nfH and nf,L denote the farmers' profits from the premium and secondary markets respectively. Similarly, nm,H and nm,L denote the integrator's profits from the two markets respectively.
We consider a range of contract prices in applying Equation 7. For each contract price, the corresponding contract quantity is determined from the OC function, and the retail price is determined from Equation 5. Figure 4 below shows the four profit curves: two for the farmers and two for the integrator. We assume a zero marginal production cost without loss of generality. Therefore, nfH = pcE[qs]. The two profit functions for the integrator decrease with the contract price, which is consistent with our expectation. As the contract price increases, the integrator's cost increases, and the increasing contract price is accompanied by a decreasing contract quantity. Thus the quantity that is sold to the secondary market also decreases. For the integrator, the profits from L account for a small percentage of the total profit, and are less important than the profits from H.
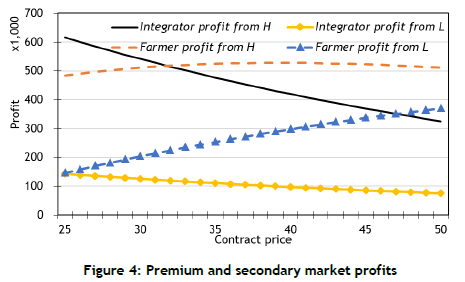
The two profit functions for the farmers are intriguing. For the H market, the farmers' nf,H is concave and does not continue to increase with the contract price, but levels off initially and then decreases slightly. The farmers' profits from serving the H market are more-or-less the same over a broad range of contract prices. In other words, the profits are not sensitive to contract price. For the L market, the farmers' nfL increases with the contract price because the quantity sold to the secondary market increases. Note that, even though the farmers reap profits from the H market, opportunities for more profits can be gained in the L market. The reason is attributable to the integrator's profit-maximising OC. All options of (pcqc) pairs generate the same profit for the integrator and leave the farmers with little room to manoeuvre. On first thought, the farmers might desire a high contract price, but in this case of an integrated chain, more profits will not result from selling to the H market but from selling the surplus - i.e., the output subtracted from the contract quantity - to the L market. The farmers can also sell their surplus output to tertiary venues. A higher contract price is accompanied by a lower contract quantity, and thus a higher surplus quantity. While the supply contract does guarantee a lump-sum profit, the surplus output is likely to be the farmer's primary concern and economic motivation.
5.2. Multiple farms case and capacity strategy decisions
If the premium chain creates additional profits, which is a form of economic surplus, the integrator can sign up more farmers with a lower contract quantity for each farmer, or fewer farmers with a higher contract quantity. Recall that qc and N are the supply variables, which together determine the total maximum supply to the H market. The effect of the two variables is different. Because the yield is uncertain, qc has a diminishing effect on the expected supply, whereas the effect of N is proportional. In Figure 5 below, we plot the profits of the integrator and N farmers over the qc-N space. In 5a, the top surface in front is the integrator profit E[nm] and the other surface is the total profit Ν · E[ny] of N farms. In 5b, the farmers' profit function is marked with two isoquant curves for pc= 30 and 40. At the extreme point of N = 250 and qc = 40,000, the total profit of N farms is approximately 7.5% of the integrator's profit. Therefore, when there is excessive supply, the farmers have small profits. When there is increased supply, both the retail and contract prices decrease, and the farmers' total profits decrease at a faster rate (Figure 3 also illustrates the effect). Of the two supply variables, the effect of N is more dramatic than qc, as shown in Figure 5a. If a fair profit allocation between the integrator and farmers is desirable, the integrator should curb its inclination to choose an N that is larger than necessary.
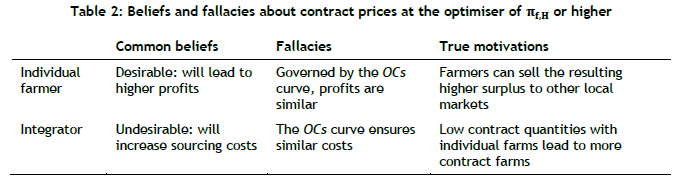
The results of this case imply that both the farmers and the integrator might prefer a high contract price. That the integrator prefers a high contract price is revealing. For the farmers, a higher pc is desirable because the associated qc implies a higher surplus output at their disposal, whereas for the integrator a higher pc is a cost. For the integrator, however, a higher pc is associated with a lower qc, which in turn allows for a larger N. Since the marginal contribution of N is higher than that of qc, the integrator is better off with a contract price higher than the optimiser of nfH. Table 2 summarises the fallacies in the common beliefs about contract prices and the true motivations for both parties. Transfer prices - i.e., the prices charged between any two nodes of the supply chain - are a frequent friction point in supply chain coordination and contract arrangements, which is true for our premium chain. Both sides could reach consensus on a certain high value of pc by separately accounting for the farmers' surplus output and the size of the integrator's supply base. Table 2 implies that it would be best for each side to examine the effects of the friction point on the other.
Clearly, when the interests on both sides are not in direct conflict, reaching consensus is likely to succeed. For instance, if we set the contract price to the maximum of the historical secondary market price - i.e., pc = max{ps (t), Vt) = 40 - the farmers will not object and the price will also mitigate their opportunism. In Figure 5b, all combinations of (qc-N) that support this price are marked as an iso-quant curve. The following formula shows that each individual farmer's profit has two parts:

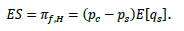
In the absence of our premium market, each farmer's total profit is ps - QE[y]. If there is a premium market, it generates additional profits - i.e., the economic surplus (ES) from the H market. Thus,
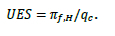
We define unit economic surplus (UES) as the ratio of ES to qc
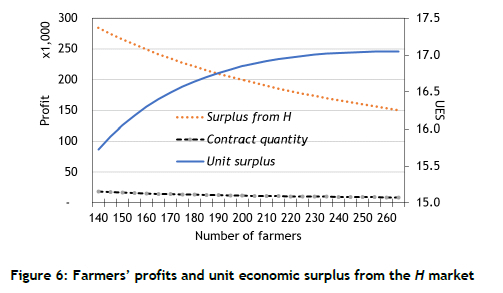
In Figure 6 below we plot the ES from the H market, qc, and the UES for each value of N. The horizontal axis is the number of farms. While all of the farmers are concerned with the quantity qc they are likely to be heterogeneous in opportunism because their outside opportunities might vary. In deciding the value of N, the integrator needs to find enough willing farmers. Since qc has a diminishing effect on the UES, the integrator might treat it as a constraining factor. The curvature of the UES reflects the constraining effect. Although the integrator's profit increases with N, finding enough willing farmers will be increasingly difficult. We propose that the UES is a suitable criterion for setting the value of N.
5.3. Business robustness
The price parameter λ, a variable that can change over time, relates to price elasticity. If λ increases but the price is kept unchanged, the demand quantity decreases. Thus λ, which represents the selectivity of the aggregate customer, also relates to the size of the H market. Since profit is an important criterion in business planning, we consider our premium chain to be sustainable if the changes in λ have an insignificant impact on the integrator's total profit. This capability relates to demand management through supply chain flexibility [24].
Considering that as λ increases the total profit decreases, we are concerned about the robustness of our premium chain when the market has a short-term variation in λ. We rewrite the integrator's profit function as

In the short term - e.g., within a year - we consider the supply E[qs]N to be fixed. We let r = [E(nm )/E(qs )N] + pc + k be the revenue contribution per unit of product. The r is a function of both α and λ. By rewriting the above question, we obtain

Denote the short-term λ as 1. Substituting λ to the above equation,
We are interested in finding a new α for each λ such that the same unit profit is obtainable. We denote the solution a as ã, which is determined by satisfying the following equality:

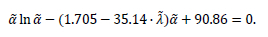
where Equation 9 takes the form of χ In χ + bx + c = 0, and its general solution is the exponential function χ = exp(-b + W(-c-eb)) , where W is the Lambert W function (https://en.wikipedia.org/wiki7Lambert_W_function).
5.3.1. Numerical example 2: Changing λ and α
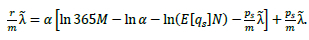
In Table 3, our lookup table, we suppose that initially λ = 0.0125, a = 0.70, and pr = 164.9 in the middle column. By substituting various constants, Equation 9 becomes
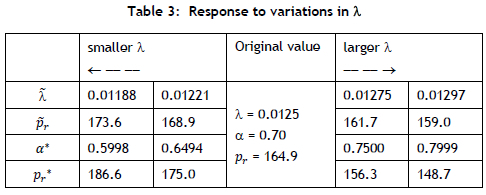
Calculating the value of the Lambert W function is computationally burdensome; so we solve for λ for each potential & and construct this lookup table:
Table 3 reveals that, if a competing product appears in the H market, or if retail store customers become more selective, the value of λ increases and the price decreases. Following the logic of our premium product profit and the H market, shifting the business to a smaller niche segment of the H market would be a logical response; but doing so would decrease the integrator's total profit. Instead, the integrator should increase the total supply by adjusting to a larger α (and a lower price) to maintain its original profit level. Note that parameter α can also function as a control lever for managing the profitability of the H market.
6. CONCLUSIONS
Supply chains with end-to-end integration for premium agri-food products have emerged as a new business model. In this paper, we have studied how they function and the production/business conditions needed for their successful development. We have proposed a new multiple-route flow-based model that encompasses a primary and secondary channel, and have identified three crucial decision issues, namely contract farming, capacity strategy, and business robustness, to accommodate the interests of the integrator and the farms under contract.
We find that contracting on price, rather than on quantity, is conducive to accommodating the interests of the integrator and the farmers. The contract price, which is a transfer price between both sides, is a potential friction point in contract negotiations. Instead of resorting to market power or game-theoretical optimisation, we find that both sides should consider the effects of the friction point on the other side. In our case study, a consensus could be reached by considering both the farmers' surplus output and the size of the integrator's supply base. For capacity strategy decisions, the integrator should source raw products from a large number of small farms, rather than from fewer but larger farms, thereby making a profit from the supply base as a whole rather than squeezing profits from the individual farmers. For robust business decisions, the integrator should adjust its supply to changes in market conditions and new competitors to ensure similar profits and to sustain its business. In conclusion, end-to-end integration of premium chains improves the differentiation of the retail sector, and the proposed flow-based model contributes to advancing our understanding of how premium chains function in the supply systems and in industrial engineering practice, and can foster new businesses around new food categories.
REFERENCES
[1] Gyarmathy, A., Peszynski, K. & Young, L. 2020. Theoretical framework for a local, agile supply chain to create innovative product closer to end-user: Onshore-offshore debate. Operations and Supply Chain Management: An International Journal, 13(2), pp 108-122. [ Links ]
[2] Henson, S. & Reardon, T. 2005. Private agri-food standards: Implications for food policy and the agri-food system. Food Policy, 30(3), pp 241-253. [ Links ]
[3] Miceikiene, A., Krikstolaitis, R. & Nausediene, A. 2021. An assessment of the factors affecting environmental pollution in agriculture in selected countries of Europe. Transformation in Business & Economics, 20(1)(52), pp 93-110. [ Links ]
[4] Higgins, V., Dibden, J. & Cocklin, C. 2008. Building alternative agri-food networks: Certification, embeddedness and agri-environmental governance. Journal of Rural Studies, 24(1), pp 15-27. [ Links ]
[5] Haviernikova, K., Snieska, V., Navickas, V. & Burksaitiene, D. 2019. The attitudes of small and medium entrepreneurs toward cluster cooperation: The expectations and reality. Transformations in Business & Economics, 18(3)(48), pp 191-205. [ Links ]
[6] Raynolds, L.T. 2004. The globalisation of organic agro-food networks. World Development, 32(5), pp 725-743. [ Links ]
[7] Delgado, C.L. 2012. Sources of growth in smallholder agriculture integration of smallholders with processors in sub-Saharan Africa: The role of vertical integration of smallholders with processors and marketers of high value-added items. Agricultural Economics Research, Policy and Practice in Southern Africa, 38(1), pp 165-189. [ Links ]
[8] Karantininis, K., Sauer, J. & Furtan, W.H. 2010. Innovation and integration in the agri-food industry. Food Policy, 35(2), pp 112-120. [ Links ]
[9] Tell, J., Hoveskog, M., Ulvenblad, P., Ulvenblad, P.O., Barth, H. & Stahl, J. 2016. Business model innovation in the agri-food sector: A literature review. British Food Journal, 118(6), pp 1462-1476. [ Links ]
[10] Du Toit, D. & Vlok, P.J. 2014. Supply chain management: A framework of understanding. South African Journal of Industrial Engineering, 25(3), pp 25-38. [ Links ]
[11] Malak-Rawlikowska, A., Majewski, E., Was, A., Borgen, S.O., Csillag, P., Donati, M., ... & Wavresky, P. 2019. Measuring the economic, environmental, and social sustainability of short food supply chains. Sustainability, 11(15), p 4004. [ Links ]
[12] Hingley, M.K. 2005. Power imbalanced relationships: Cases from UK fresh food supply. International Journal of Retail & Distribution Management, 33(8), pp 551 -569. [ Links ]
[13] Perdana, Y.R., Ciptono, W.S. & Setiawan, K. 2019. Broad span of supply chain integration: Theory development. International Journal of Retail & Distribution Management, 47(2), pp 186-201. [ Links ]
[14] Frohlich, M.T. & Westbrook, R. 2001. Arcs of integration: An international study of supply chain strategies. Journal of Operations Management, 19(2), pp 185-200. [ Links ]
[15] Childerhouse, P. & Towill, D.R. 2011. Arcs of supply chain integration. International Journal of Production Research, 49(24), pp 7441-7468. [ Links ]
[16] Alcívar-Espín, R.A., Chou, Y.C. & Huang, C.C. 2021. Two-part tariff contract design for a supplier base: A unifying methodology. IMA Journal of Management Mathematics, 33(3), pp 417-432. [ Links ]
[17] Matopoulos, A., Vlachopoulou, M., Manthou, V. & Manos, B. 2007. A conceptual framework for supply chain collaboration: Empirical evidence from the agri-food industry. Supply Chain Management: An International Journal, 12(3), pp 177-186. [ Links ]
[18] Bowen, S. & Burnette, M. 2019. Redefining the value from end-to-end integration. Supply Chain Management Review, March/April, pp 36-41. [ Links ]
[19] Alvarez, G., Pilbeam, C. & Wilding, R. 2010. Nestlé Nespresso AAA sustainable quality program: An investigation into the governance dynamics in a multi-stakeholder supply chain network. Supply Chain Management: An International Journal, 15(2), pp 65-182. [ Links ]
[20] Fernández-Olmos, M., Dejo-Oricain, N. & Rosell-Martínez, J. 2016. Product differentiation strategy and vertical integration: An application to the DOC Rioja wine industry. Journal of Business Economics and Management, 17(5), pp 796-809. [ Links ]
[21] Huang, J., Leng, M. & Parlar, M. 2013. Demand functions in decision modeling: A comprehensive survey and research directions. Decision Sciences, 44(3), pp 557-609. [ Links ]
[22] Hwang, S.C.& Ko, W.H. 2004. Cavendish banana cultivars resistant to Fusarium wilt acquired through somaclonal variation in Taiwan. Plant Disease, 88(6), pp 580-588. [ Links ]
[23] Chadwick, J.B. & Nieuwoudt, W.L. 1985. The demand for bananas and the economic effect of supply restriction. Agrekon, 24(2), pp 14-20. [ Links ]
[24] Yuan, J., Gao, J. & Wu, D. 2017. Demand chain alignment competence, managerial cognition, and firm performance: The moderating role of supply chain flexibility. Transformations in Business & Economics, 16(3C-42C), pp 505-523. [ Links ]
Submitted by authors 1 Jan 2022
Accepted for publication 21 Dec 2022
Available online 26 May 2023
* Corresponding author: roberto.alcivar@epn.edu.ec
ORCID® identifiers
R.A. Alcívar-Espín: https://orcid.org/0000-0003-4811-3381
Y. Chou: https://orcid.org/0000-0001-5140-1275
C. Tsao: https://orcid.org/0000-0002-9851-7686

