


Servicios Personalizados
Articulo
 Inglés (pdf)
 Articulo en XML
 Referencias del artículo
Indicadores

Links relacionados
-
 Citado por Google
 -
 Similares en Google
Compartir

 Permalink
South African Journal of Industrial Engineering
versión On-line ISSN 2224-7890
versión impresa ISSN 1012-277X
S. Afr. J. Ind. Eng. vol.33 no.4 Pretoria dic. 2022
http://dx.doi.org/10.7166/33-4-2732
GENERAL ARTICLES
Base models for simulating the South African forestry supply chain
J.M. LaubscherI; J. BekkerI,*; S. AckermanII
IDepartment of Industrial Engineering, Stellenbosch University, South Africa
IIDepartment of Forestry and Wood Science, Stellenbosch University, South Africa
ABSTRACT
The South African forestry supply chain is a complex system that involves both the production of trees (site preparation, re-establishment, tending, and maintenance operations) and the production and distribution of wood products from plantation stands to the pulp- and sawmills. This paper reports on a study that investigated the suitability of discrete-event simulation for modelling forestry supply chains. As part of a larger research project, two discrete-event simulation models with bi-objective optimisation of the South African pulpwood and saw-timber supply chains respectively were developed. The simulation models were developed for each supply chain by first mapping out the supply chain processes through subject-matter expert and stakeholder consultation. Thereafter simulation concept models were developed, and the required input data were identified, acquired, and verified. The simulation models were verified and validated to be realistic representations of the supply chains that they imitate. The study concluded that the simulation models demonstrated the ability to perform scenario analysis and bi-objective optimisation. It was also demonstrated that the two disciplines of industrial engineering and forestry science can successfully collaborate.
OPSOMMING
Die Suid-Afrikaanse bosbouvoorsieningsketting is a komplekse stelsel wat bestaan uit beide die produksie van bome (terreinvoorbereiding, hervestiging en versorging van saailinge, asook algemene plantasie-instandhouding) en die produksie en verspreiding van hout vanaf die plantasies na die pulp- en saagmeulens. Hierdie artikel handel oor 'n studie waarin die geskiktheid van diskrete-gebeurtenis simulasie vir die modellering van bosbou-voorsieningskettings met dubbele-doelwitoptimering ondersoek is. As deel van 'n groter navorsingsprojek is twee voorsieningketting-simulasiemodelle ontwikkel: een vir pulphout en die ander vir saaghout. Die simulasiemodelle is ontwikkel deur eerstens die prosesvloei van die twee voorsieningskettings uit te beeld met die hulp van vakkundiges en belanghebbers. Daarna is simulasie-konsepmodelle ontwikkel en die data wat benodig was is geïdentifiseer, verkry en geverifieer. Die simulasiemodelle is ontwikkel, waarna verifikasie en validasie gedoen is om te bevestig dat die modelle realistiese voorstellings is van die voorsieningskettings wat hulle moet naboots. Die gevolgtrekking van die studie is dat die simulasiemodelle wat ontwikkel is die vermoë demonstreer om beide scenario-analise en dubbele-doelwit optimering uit te voer. Dit word ook illustreer dat die dissiplines van bedryfsingenieurswese en bosbou suksesvol kan saamwerk.
1. INTRODUCTION
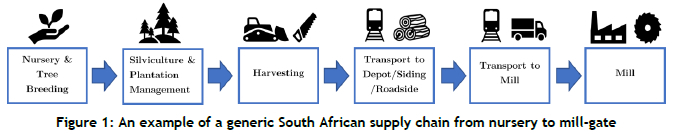
We present a study that investigated the potential of using discrete-event simulation (DES) and bi-objective optimisation of the South African forestry supply chain. DES and bi-objective optimisation were considered in the problem domain following a literature review that indicated some gaps in forestry supply chain modelling. The South African forestry supply chain can be divided into discrete sections: nurseries, silviculture (growing and cultivation of trees), harvesting, transport, and processing [1]. However, when viewed from a complete supply chain perspective, there can often be an imbalance where improvement in certain sections of the supply chain can present situations that result in poorer efficiency by other sections.
Ultimately, an understanding is needed to know to which extent an improvement of an operational section (nursery, silviculture, harvesting, etc.) has an impact on other sections further down the supply chain, and therefore on the value created by the entire supply chain. This recognition has led the South African forestry industry to look at its supply chains more holistically. To this end, three major stakeholders in the South African forestry industry collaborated with members of the departments of industrial engineering and forest and wood science at Stellenbosch University, South Africa, to develop models of two types of supply chain. It was agreed to investigate the merits of discrete-event simulation (DES) models for this purpose. The industrial engineering members developed the simulation models under the guidance of the forestry experts who, as the stakeholders of the study, provided the input data, process rules, and logic, as well as the study objectives and model requirements.
For illustration, Figure 1 depicts a generic South African forestry supply chain; however, two supply chains were studied in this research: a pulpwood supply chain (pulp and paper products) and a saw-timber supply chain. Furthermore, when the terms 'pulpwood supply chain' and 'saw-timber supply chain' are used in this study, they refer to the supply chains from the nursery gate to the mill gate. In other words, the internal functioning of the nurseries, pulp mills, and sawmills is not considered part of the supply chain.
Sufficient supply chain simulation models could clarify ways in which key industry players could increase revenue, reduce costs, and improve customer service levels [2].
The benefits of performing a supply chain simulation (SCS) are as follows [3]:
• An SCS creates a deeper understanding of the overall supply chain process and its characteristics using graphical representation.
• An SCS can capture system dynamics by using probability distributions. Unexpected events can be modelled to see how they might impact the supply chain.
• An SCS could visibly reduce the risk of the changes made during the supply chain planning process using what-if simulation.
In 2018, the South African forestry industry contributed 0.6% of the GDP, and 10% when related to agriculture, while it provided 58 900 direct jobs and 90 200 indirect jobs [4]. For this reason, improving and optimising the supply chains in this sector would bring economic benefits not only to grower-processor companies but also to the communities where they are located, in the form of direct and indirect welfare.
These simulation models aim to provide the stakeholders with support for strategic decision-making by allowing scenario analysis through experimentation and bi-objective optimisation. This paper discusses the required structure of such simulation models, and demonstrates the capabilities of the simulation models that were developed.
In this work, two case studies were developed. The pulpwood supply chain case study relates to the Clan plantation in the KwaZulu-Natal midlands region, while the saw-timber supply chain case study relates to the Longridge plantation in Sabie, Mpumalanga. Figure 2 illustrates the primary forestry plantation regions in South Africa. Mpumalanga and KwaZulu-Natal each hold around 40% of the total plantation area and timber-processing facilities in South Africa, whilst the Eastern Cape holds around 11%. Together these three provinces account for more than 90% of South Africa's plantations [5].
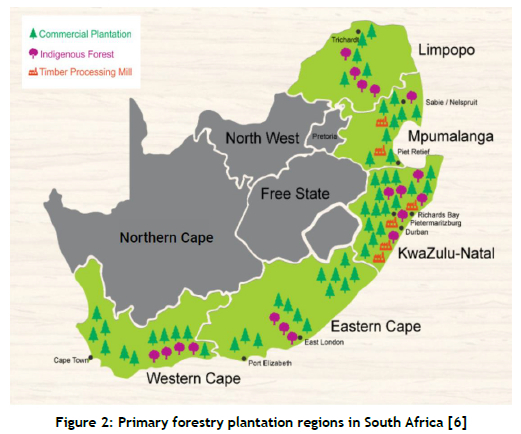
The most common species used in large-scale plantations are Pinus spp., Eucalyptus spp., and Acacia spp. (mainly Acacia mearnsii or black wattle). Pinus spp., often referred to as 'pine' or 'softwood' timber, represents about 51% of total plantings. Eucalyptus spp., referred to as 'gum trees' or 'the eucalyptus species', represent 42%, while wattle accounts for about 7% of the total plantings. These two genera are grown throughout South Africa, with the main areas for pine saw-timber production situated in the northeastern Mpumalanga region, while the main eucalyptus and wattle pulpwood producers are in KwaZulu-Natal.
The timber harvested from pine and eucalyptus trees is used in different ways. In respect of pine, the timber harvested from thinning (young or mid-rotation) trees is used for the manufacture of pulp/paper and small sawn-timber products (boxes, pallets, and crates). The logs from mature trees (20-30 years old) are mainly used in building and construction, while high-quality knot-free timber is used for engineered wood products such as ply. Eucalyptus, on the other hand, is mainly used as a feedstock to the pulp and paper market, with other uses including mining supports, transmission poles, and - in the case of older trees - as a sawn-timber product. In contrast to pine, eucalyptus has the benefit that the harvested tree stump will coppice (re-sprout) to form second/new crops for the following timber growth rotation, while pine trees have to be replanted with seedlings. Eucalyptus trees are generally harvested at between seven and 10 years of age.
The remainder of the paper is structured as follows. A brief literature study is presented on the topics of supply chain simulation in the forestry industry, discrete-event simulation, and software. This is followed by a discussion of the developed simulation models. The research methodology is explained, followed by the verification and validation efforts that were performed to ensure that the models were adequate and acceptable to the stakeholders. Finally, typical experimental results are presented to demonstrate some of the capabilities of the simulation models.
2. RELATED WORK
We present selected references to related work.
Opacic and Sowlati [7] reviewed applications of DES in the forest product sector, and concluded that it is used in a variety of problem areas, including the impact of machine interactions in forests and mills, conducting bottleneck analyses, determining the feasibility of machine replacements, assessing log transportation methods, and analysing biofuel supply chains. Their models included stochastic elements owing to uncertainties about processing times and the demand for raw materials and products. They suggested that future work consider simulation-optimisation and the use of multiple objectives in optimisation. In another literature review, Kogler and Rauch [8] reported on trends of DES in multimodal and unimodal transportation in the wood supply chain. They identified common shortcomings, which included rough explanations of simulation models (insufficient documentation) and the absence of details about the verification and validation processes followed during simulation studies. There are research gaps concerning simulation studies of entire, resilient, and multimodal wood supply chains and of supply-and-demand risks. They identified the need to combine simulation methods with optimisation - i.e., simulation-optimisation.
Kogler and Rauch [9] developed a DES model that allowed for decision support of multi-modal transport in forestry supply chains, improving supply chain resilience, and reducing greenhouse gas emissions. Shahi, Pulkki, Leitch & Gaston [10] developed a simulation-based optimisation model that integrated production planning with inventory management in the forest products industry supply chain while incorporating supply-and-demand uncertainty. Kogler, Stenitzer & Rauch [11] developed a DES model to study the multi-echelon unimodal transport concept, in which timber is synchronously trans-shipped at a truck terminal with four trans-shipment lots from self-loading trucks to semi-trailers. They found optimal truck fleet configurations and reduced costs while introducing and proving the truck terminal concept, which replaced self-loading trucks.
In a study by the Natural Resource Institute of Finland, in conjunction with the University of Eastern Finland's Faculty of Science and Forestry, combining the optimisation of wood supply chains with forest management practices was investigated [12]. The paper presented a methodology for integrated forest management and wood supply chain optimisation over time in the context of Finnish forestry, in anticipating developments in the wood processing industry. In their study, the Finnish MELA simulator was used to generate many treatment schedules over time at the management unit level. Each of these treatment schedules then provided unique estimates of extracted wood volumes by different assortment categories for each period. The research yielded important recommendations for the improvement of the Finnish forestry supply chain. A conclusion was reached that other forest enterprises would be able to use their methodology to analyse the impact of new factories on wood flows or to support them in strategic planning of wood supply over different periods and to different destinations.
In another study, simulation modelling was used to align tactical and operational management decision levels in the Canadian forestry supply chain [13]. The study was performed by first modelling the Canadian forestry supply chain network to optimise product flows, using the LogiLab software system. The LogiLab model used mathematical optimisation to create a tactical aggregated plan for production and transportation. The optimisation model aimed to maximise profits by simultaneously increasing production value and reducing transportation, inventory, and production costs. The LogiLab model helped to identify specific quantities to be produced at each plantation mill and to be transported from one node to another for a different period, to achieve the goal of maximum profitability. The tactical aggregated plan (LogiLab model) could then be used to identify management policies (execution policies) that would, in turn, be able to guide day-to-day business activities on an operational level. The second part of their study entailed developing a discrete-event simulation model using Simio simulation software. The simulation model was implemented to evaluate the impact of the combination of production and transportation flow policies and execution policies (for example, truck-loading and dispatching rules) as suggested by the decision-maker. In short, the simulation model was used to anticipate the performance of operational and execution policy.
Shahi and Pulkki [14] reviewed supply chain optimisation of the Canadian forest products industry, and concluded that simulation and optimisation had been used independently in supply chain management in the past, and that most studies focused on deterministic problems. They therefore called for simulation-optimisation models.
Scholz et al. [15] investigated digital technologies in forest supply chain optimisation, and found, among other things, that there were two main approaches to strategic planning: simulation-based approaches, and optimisation. Only one paper addressing simulation-optimisation was cited, while one study applying multi-objective optimisation using goal programming was found.
Given the selected related work, our main conclusion was that discrete-event simulation models have been developed for forestry supply chains, but that a larger focus on stochastic behaviour was needed, together with the optimisation of at least two objectives [7], while simulation and optimisation had been used separately in supply chain management [14].
3. METHODOLOGY
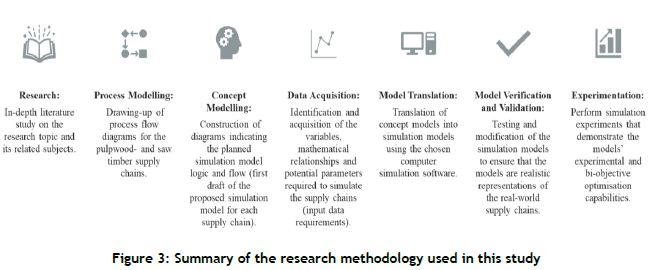
The research methodology that was used in this study to produce simulation models for the South African pulpwood and saw-timber supply chains is summarised in Figure 3.
The logic and flow of the pulpwood and saw-timber supply chains was established through stakeholder and subject-matter expert consultation and through industry site visits. During these site visits, various parts of the real-world supply chains were observed and documented. These sites included the Sappi Clan Nursery, York Timbers Nursery, the York Timbers sawmills at Jessieville and Sabie, and excursions to Mondi, Sappi, and York Timbers plantation sites where real-life forestry operations were observed.
The required input data was first identified through the development of the concept models and then obtained from either published forestry research or estimated and verified by subject-matter experts. Both the cost and the productivity data were acquired in this way.
The concept models were translated into the chosen computer simulation software through the use of object-orientated programming. Finally, validation was done by presenting the models and preliminary production run results to several members of the stakeholder companies. Adjustments were made where needed, and an iterative process was followed until the stakeholders were satisfied that the models were adequate representations of the real world, within the agreed scope and assumptions.
4. THE SIMULATION MODELS DEVELOPED
From the literature review, it was clear that DES models of forestry supply chains exist; however, in this study, the following themes were investigated:
1. Apply DES to the South African forestry case and model both the pulpwood supply chain and the saw-timber supply chain.
2. Include as many stochastic elements as is realistic, including varying resource processing times, unplanned machine breakdowns, worker strikes, demand and supply fluctuations, forest fires, and baboon damage to trees.
3. Demonstrate the use of bi-objective simulation-optimisation.
Simulation software was considered for modelling the supply chains. Several forestry-specific simulation software packages were considered - namely, Remsoft [16], LogiLab [17], and Heureka! PlanWise [18]. However, these were developed specifically for forest management; Remsoft is not a simulation software in the traditional sense of the word, but should rather be viewed as a forestry planning and analytics solution. Logilab is a decision support tool designed to help in tactical decision-making by using modelling and optimisation, and enables the user to quickly view all the product flows between different business units before and after optimisation for a given time horizon. The Heureka system is a set of software packages that allow the user to perform different analyses and management plans for forestry. The decision-maker can perform short- and long-term projections of, for example, timber production, economics, environmental conservation, recreation, and carbon sequestration. The software within the system can be applied to both individual stands and entire landscapes.
There are many simulation software packages that are designed specifically to model discrete-event stochastic processes. Some of the software packages that were considered for use in this study were hybrid simulation packages such as AnyLogistix, Arena, and Simulink. Other DES software considered was Siemens' Tecnomatix Plant Simulation (TPS), Simio, and JaamSim. After careful consideration, TPS was chosen as the most suitable software package for this particular study, given its strong statistical analysis capabilities and the researchers' prior experience in using the software. In addition, TPS allows for the detailed customisation of objects via the programming language SimTalk.
Next, the simulation model structures are presented.
4.1. Simulation model structures
To understand the structure of the simulation models, the forestry process is first briefly described. The functional area known as a stand or compartment (further referred to as 'a stand') is an area of uniform slope and soil where growing stock is planted and tended over the growing cycle of the particular tree genus to produce a particular feedstock for the market (saw-timber or pulpwood). The area size is typically a few hectares - between one and 100 ha - depending on the abovementioned characteristics. Treatment of the newly planted growing stock occurs according to established forestry research-based prescriptions -for example, to apply fertiliser or not, and when to thin the crop to produce the desired resultant tree growth. As with most natural systems, along with predicted tree growth there is an element of natural mortality on the stand brought on mainly by inter-tree competition. This is modelled as a factor to predict naturally occurring stand-based yield decline. To predict the growth of a stand, it is assigned a particular site index (SI) that indicates a particular yield potential [19], [20].
During the lifetime of trees on a stand (from being planted to being harvested), several events can reduce the yield. These include fire, baboon damage, and drought. The simulation model includes all of these possibilities, which, in the end, determine the yield at the time of harvest. The yield affects the harvesting time and resource allocation and transportation requirements. The tree lifetime is typically nine to 30 years.
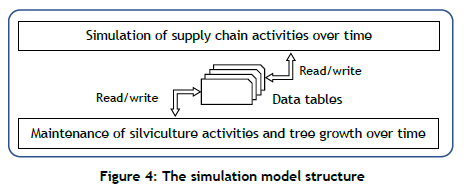
The basic structure of both the pulpwood and the saw-timber simulation models is similar. The model is divided into three interconnected parts. The first is the production part of the model, which includes the harvesting, extraction, processing, and transport operations. The second part of the model simulates the silviculture operations that form part of the supply chains; they are site preparation, establishment, and tending activities. The third part of the model simulates the ordering of seedlings from the nursery and the subsequent transport of the seedlings to the current plantation stand. The structure is shown in Figure 4, which shows the production part at the top and the silviculture and nursery parts at the bottom. Several data tables are used to link the parts: a silviculture process at a site is logged in a table, while another stand is marked as ready for harvesting with its current yield being known. The production part may start harvesting at this stand, and once harvesting is completed, the stand is marked as such. The silviculture part may then begin with site preparation and planting. Note that there may be long delays between such events if the model is configured with few resources.
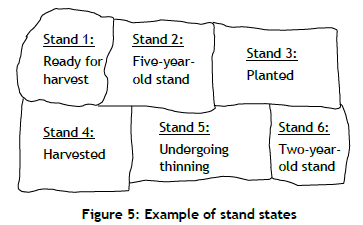
The data tables contain all the information needed for stands - for example, a stand list, which contains for each stand an identification number, a site index (SI) value, a site quality (SQ) value, the site size (ha), the species choice, the planting density, and specific transport distances to various locations, such as distance to the nearest depot or mill. Figure 5 shows several stands in different states, and the simulation models continuously check the states of the stands to determine what to do. The stand data sets are periodically updated to imitate the growth of the trees on a stand. Suppose that the trees on Stand 2 are now five years old; then, after another simulated year, the age of the trees will be increased to six years. Similarly, the age of the trees on Stand 6 will be increased to three years. Stand 1 is ready for harvest and, if the production logic has resources available, the stand will be harvested. The SI at that point will be used to provide the yield in cubic metres of wood. Stand 4 has been harvested, and the silviculture logic may start the preparation and planting process. Seedlings must be obtained from a nursery before planting begins. Stand 5 is undergoing thinning, and a cost penalty will be added to its data set. The decision-maker must configure the models by providing data for all the stands that are to be included in the study and for decision-making. The data sets contain several Boolean flags that the decision-maker can set per stand -for example, fertiliser applied, watering, and mulching. These all indicate whether forestry actions are applied to the stand. When applied, the yield is expected to be higher - but there is a cost involved.
An important data table is the yield table, which contains the yield estimates based on various SI values and ages. These yield tables were created using predefined growth models for a specific planting density and species type, and could be expanded to include yield predictions for more species and planting densities in the future.
There were also tables for the costs (input, operational, and maintenance) associated with each operation or piece of equipment simulated in the model. For each operation, the productivity input was modelled as a triangular distribution using average productivity measures. There were many other input variables in the simulation models that are not discussed in this paper. The simulation models have a very large combinatorial nature, as there are many different combinations of input variables that can be changed in the simulation models.
In terms of structure, there are differences between the pulpwood and saw-timber simulation models. The main features that were included in both the simulation models were these:
• Silviculture operations: site preparation (e.g., mulching, burning, broadcast, de-stumping, and ripping), fertilisation, watering, and weeding. Broadcasting of plantation residues refers to the even distribution of tree branches and other tree-related woody biomass across the plantation stand. Ripping is the method of creating a growing space for tree-growing stock to be planted in by using a tine ripper drawn by a tractor or bulldozer across the stand. This method creates even depth lines for planting.
• A simulation warm-up period allows the simulation models to reach a steady state where stands are established and harvested cyclically.
• Transport units have adjustable travelling speeds, but have been pre-configured with default speeds.
• Trucks and tractors have adjustable turn-around times between trips.
• Production operations: harvesting, extraction of wood, and transport to different locations.
• Machines have adjustable productivities, but have been pre-configured with default productivity values.
• Machines have been pre-configured with default failure and scheduled downtime profiles, but these can be adjusted.
• Seasonality: planting window, which drives some silviculture operations, and a dry/wet season calendar that drives equipment and transport configurations.
• Worker shift calendars: adjustable, but have been pre-configured.
• A temporary unplanted time (TU) calculation. TU is referred to as the time between harvesting the crop and planting/coppicing the next rotation of trees.
• A random fire-event generator, which reduces the available yield when a fire event occurs. The probability of a fire in a certain area can be specified by the user.
• Interaction between fertiliser and weeding in rare cases when fertiliser is applied, but weeding is skipped (in essence, the next weeding becomes more expensive and the SI value is reduced).
• SI value calculation, which is dependent on the user-specified silviculture regime for each site.
• Different data tables can be imported - for example, yield tables, which can be used to estimate stand yields.
• Calibration of silviculture regimes: different simulation experiments can be performed by varying silviculture regimes.
• Cost calculations: costs are accounted for in R/m3 for all operations.
The features that were included only in the saw-timber simulation model were:
• Thinning and pruning operations: the frequency and intensity of these operations depend on the site quality value.
• The inclusion of a theoretical merchandising yard option, which is an important strategic consideration for forestry management. A merchandising yard is a location where tree lengths (harvested) are transported (usually closer to the sawmill) for merchandising into log lengths. The theory is that the sawmill can optimise the intake to the mill by having the raw material on hand and easily available.
• The distinction between steep and flat terrain when production operations are performed. In other words, different equipment is allocated to sites, based on their slope.
• A random baboon damage event generator: simulates a reduction in yield because of a baboon damage event (the probability value is user-specified).
The following general assumptions were made during the development of the simulation models in this study:
1. The supply chains start at the nursery gate and end at the mill gate.
2. Depots are only used during the rainy months. A depot is an intermediate storage area in a plantation. Using a depot implies additional resource requirements, as more loading operations are done.
3. Trucks always take full loads; however, if after six hours there is still not enough wood available for loading, the truck will take what it has and depart.
4. The probability of a fire event occurring in a chosen area is a value chosen by the user.
5. A planting density of 1 667 stems per hectare for pulpwood and 1 333 for saw-timber is assumed. In the future, more planting densities could be added by including each planting density's set of yield tables.
6. Yield tables are based on one common species of tree only - for example, Eucalyptus dunni for pulpwood and Pinus patula for saw-timber. In the future, a large variety of species could be added by the inclusion of each species' set of yield tables.
7. Yield tables are for a range of SI values from 10 to 30.
8. Operational costs, input costs, and productivity data were taken from published forestry data where possible, and unavailable data was estimated by subject-matter experts, and should be viewed as realistic estimates only.
4.2. Results: Simulation output
The simulation models were designed to perform simulation experiments. Various parameters and variables could be set to perform what-if analyses and to do scenario evaluation, resulting in combinatorial optimisation. Examples of such experiments include:
1. The setting of fire damage to varying extents in selected stands.
2. Settings of silviculture parameters per stand - for example, applying fertilisation or not.
3. Doing thinning with or without the previous settings.
These parameter settings must be decided by subject-matter experts in forestry, since not all combinations of values are practical or allowed.
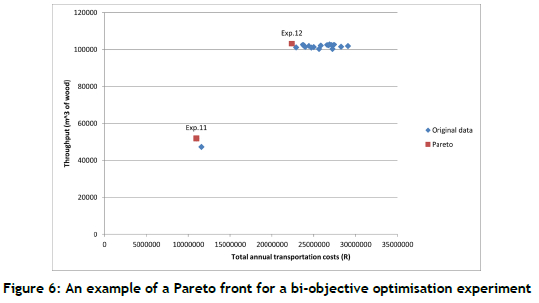
Following is an example of an experiment using the pulpwood supply chain simulation model. The purpose of the experiment was to demonstrate the capability of the simulation models to perform bi-objective optimisation. The result of this experiment is for demonstration purposes only.
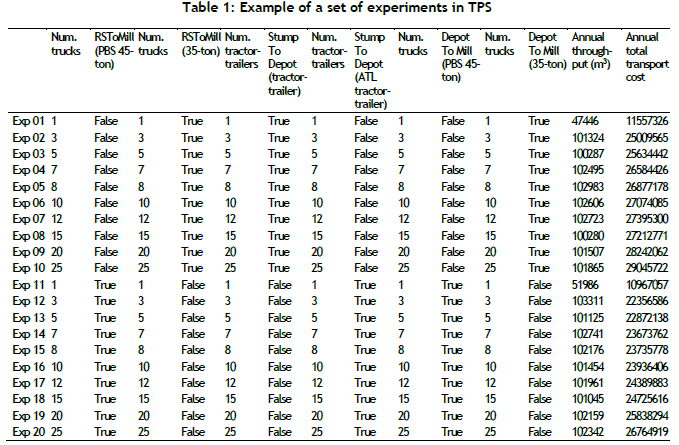
The objective of this experiment was to maximise throughput (the volume of wood delivered to the mill over a specific period) and to minimise costs (input and operating costs related specifically to transport) by varying the number and type of the transport fleet (for transport from the roadside to mill, stump to depot, and depot to mill). Table 1 illustrates the set of experiments that were performed in TPS. There were 20 experiments in all: 10 for the combination of 35-ton trucks and normal tractor-trailers, and 10 for the combination of PBS 45-ton trucks and ATL tractor-trailers. For each experiment, a different fleet size was simulated, as indicated. The table also illustrates a subset of the flags that could be enabled or disabled as part of the analysis; in total, the models allow for 138 decision variables to be adjusted. Not all of them needed to be set for the experiments; it depended on the needs of the decision-makers, which in this illustration was about transport cost.
Figure 6 illustrates the Pareto front that was obtained for the set of experiments, with the transportation cost to be minimised and the throughput to be maximised. Experiments 11 and 12 belonged to the estimated Pareto set, which means that they were equally good. Although Experiment 11 represented a scenario that had a lower transportation cost, the throughput was also lower. Experiment 12 represented a high yield, but at a higher transportation cost. It was clear that the cost-throughput combinations of the other experiments were inferior. From the Pareto front, it could be concluded that Experiment 12 had the best combination of throughput and transportation cost. Relating this to the associated decision variable values, it was found that a fleet size of three PBS 45-ton trucks (for transport from the roadside to mill, and depot to mill) and three ATL tractor-trailers (for stumps to depot extraction) should be used.
Note that the results must be seen in context - i.e., what the decision-maker aimed to achieve. Decision-makers in forestry might improve the input values by doing an additional analysis of supply chain processes in collaboration with industrial engineers.
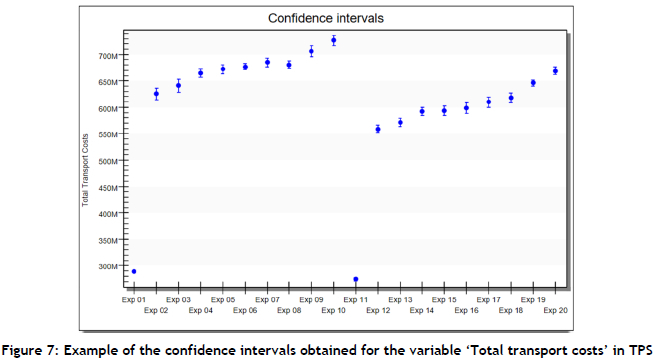
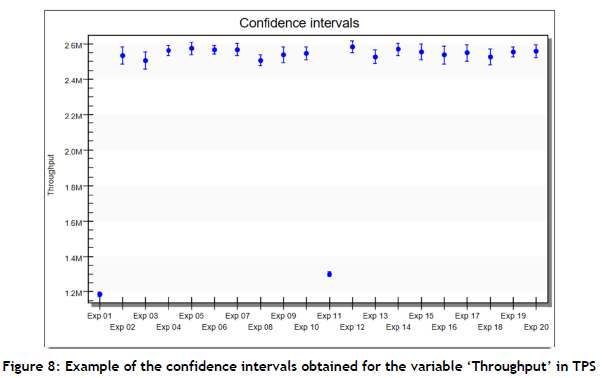
When the experimental results were compared per objective using the ANOVA statistical analysis functionality in TPS, and referring to the confidence interval plots in Figure 7 and Figure 8, it could be confirmed that Experiment 12 was the best.
Experiments 1 and 11 had the lowest transportation cost, while Experiment 1 also had the lowest throughput. The transportation cost of Experiment 12 was lower than that of the remaining experiments, and differed statistically significantly from them. It had similar throughput to the other experiments (excluding Experiments 1 and 11), but was chosen as the best because of the transportation cost objective value. The conclusion that could be drawn from this diagram was that transportation costs increased as the size of the fleet increased, which was to be expected. It also illustrated that choosing to use 35-ton trucks and normal tractor-trailers seemed to be more expensive than using larger PBS 45-ton trucks and ATL tractor-trailers (comparing experiments 1-10 with experiments 11-20).
The conclusion that could be drawn from Figure 8 was that throughput increased significantly if the fleet size was increased from one to three. However, once the fleet size was increased to three units, throughput remained relatively similar, despite increasing the fleet size. This alludes to a point of diminishing returns for throughput in respect of fleet size, as in this case the throughput was limited by the available yield from the plantations and not by the fleet size. This result thus indicated to decision-makers that additional capital layout for equipment was not necessary.
Further recommended experiments include the following: maximise resource utilisation and throughput at various points in the supply chain - for example, the amount of wood available at the roadside, depot, or mill, or the recoverable yield on stands (e.g., by changing silviculture regimes); deliver predetermined volumes of wood to the mill gate while minimising resources; and determine the feasibility of multi-modal transport scenarios (e.g., combining truck and train transport).
5. CONCLUSION
This study contributed by demonstrating the application of discrete-event stochastic simulation (DES) in the South African pulp and saw-timber supply chains while using bi-objective optimisation. It is concluded that the simulation models can provide support for tactical and strategic decision-making by allowing scenario analysis through experimentation and bi-objective optimisation.
This study has identified opportunities for further work and model refinement. Some suggested improvements are related to the following:
1. The refinement of the costs of equipment, machines, and trucks (e.g., the acquisition cost of equipment, maintenance, operating, and labour costs) as well as the productivity measures for each operation.
2. The identification of precise travel distances to and locations of sites, roadside landings, depots, and mills.
3. The estimated effect of silviculture regimes on SI values and the predicted yield of sites (silviculture weights).
4. The interaction between fertiliser and weeding, especially if fertiliser was applied but weeding was skipped. What are the effects on the SI value, cost, and productivity?
5. Yield tables - include more planting densities, species choices, and a larger range of SI values.
6. Truck turnaround times and queueing distributions - for example, when off-loading wood at depots, sidings, or mills.
7. A ranking and selection (R&S) procedure should be integrated with the models to ensure simultaneous statistically significant differences while minimising the number of replications. A method that guarantees the probability of correct selection is Procedure MMY, which is recommended for this improvement [21].
8. The volume of wood and the rate of supply arriving at the mill gate must be reported per scenario analysed, since the mill needs to absorb the wood received.
Finally, this study exemplified the value of cross-discipline collaboration - in this case between industrial engineering and forestry.
REFERENCES
[1] Ackerman, S., Rietz, D. & Titshall, L. 2017. Mapping the South African pulpwood supply chain. 7th Precision Forestry Symposium. Stellenbosch. https://www.researchgate.net/publication/317232140_Mapping_the_South_African_pulpwood_supply_chain [ Links ]
[2] Inglass, R.G. 2014. Introduction to supply chain simulation. In A. Tolk, S.Y. Diallo, I.O. Ryzhov, L. Yilmaz, S. Buckley and J.A. Miller (eds), Proceedings of the 2014 Winter Simulation Conference. Stillwater, OK: Oklahoma State University. https://www.semanticscholar.org/paper/Introduction-to-supply-chain-simulation-Ingalls/5674bfdefb9cba711b0abf0774df24414e93905 [ Links ]
[3] Makatsoris, Y. & Chang, H. 2001. Supply chain modelling using simulation. International Journal of Simulation, 2(1), pp. 24-30. [ Links ]
[4] Godsmark, R. & Oberholtzer, F. 2018. South African Forestry & Forest Products Industry - 2018. https://www.forestry.co.za/uploads/File/industry_info/statistical_data/statistical_data_April_2020/South_African_Forestry_&_Forest_Products_Industry-2018.pdf [ Links ]
[5] Ledger, T. 2017. Case study on the forestry regional value chain in South Africa: South Africa, Mozambique and Tanzania. TIPS Report for the Department of Trade and Industry. https://saiia.org.za/saiia-toolkit/case-study-of-the-forestry-regional-value-chain-in-southern-africa-south-africa-mozambique-and-tanzania/ [ Links ]
[6] Forestry South Africa. 2020. Forestry across 5 provinces, https://www.forestrysouthafrica.co.za/info-graphics/homepage/introducing-commercial-forestry/ [ Links ]
[7] Opacic, L. & Sowlati, T. 2017. Applications of discrete-event simulation in the forest products sector: A review. Forest Products Journal, 67(3/4), pp. 219-229. [ Links ]
[8] Kogler, C. & Rauch, P. 2018. Discrete event simulation of multimodal and unimodal transportation in the wood supply chain: A literature review. Silva Fennica, 52(4), pp. 1-29. https://doi.org/10.14214/sf.9984 [ Links ]
[9] Kogler, C. & Rauch, P. 2019. A discrete-event simulation model to test multimodal strategies for a greener and more resilient wood supply. Canadian Journal of Forest Research, 49(10), pp. 12981310. https://doi.org/10.1139/cjfr-2018-0542 [ Links ]
[10] Shahi, S., Pulkki, R., Leitch, M. & Gaston, C. 2017. Optimal production-inventory model for forest products industry supply chain under demand and supply uncertainty: Case study of a pulp mill in Ontario. Cogent Business & Management, 4(1), pp. 1-13. https://doi.org/10.1080/23311975.2017.1370765 [ Links ]
[11] Kogler, C., Stenitzer, A. & Rauch, P. 2020. Simulating combined self-loading truck and semitrailer truck transport in the wood supply chain. Forests, 11(12), 1245. https://doi.org/10.3390/f11121245 [ Links ]
[12] Pekka, H., Reetta, L., Juha, L. & Tuula, P. 2019. Joining up optimisation of wood supply chains with forest management: A case study of North Karelia in Finland. Forestry: An International Journal of Forest Research, 93, pp. 163-177. doi:10.1093/forestry/cpz058 [ Links ]
[13] Jerbi, W., Gaudreault, J., D'Amours, S., Nourelfath, M., Lemieux, S., Marier, P. & Bouchard, M. 2012. Optimization/simulation-based framework for the evaluation of supply chain management policies in the forest product industry. Conference Proceedings - IEEE International Conference on Systems, Man and Cybernetics. 7. doi:10.1109/ICSMC.2012.6377989 [ Links ]
[14] Shahi, S. & Pulkki, R. 2013. Supply chain network optimization of the Canadian forest products industry: A critical review. American Journal of Industrial and Business Management, 3(7), pp. 631 - 643. doi:10.4236/ajibm.2013.37073 [ Links ]
[15] Scholz, J., De Meyer, A., Marques, A., Pinho, T.M., Cunha, J., Orshoven, J., Rosset, C., Künzi, J., Jaakkola, K. & Nummila, K. 2018. Digital technologies for forest supply chain optimization: Existing solutions and future trends. Environmental Management, 62(1 /2). doi:10.1007/s00267-018-1095-5 [ Links ]
[16] Remsoft. 2020. Forestry. https://remsoft.com/forestry/ [ Links ]
[17] FORAC. 2016. Logilab. https://www.forac.ulaval.ca/en/transfer/platforms/logilab/ [ Links ]
[18] Wikström, Peder & Edenius, Lars & Elfving, Björn & Eriksson, Ljusk & Lamas, Tomas & Sonesson, Johan & Öhman, Karin & Wallerman, Jörgen & Waller, Carina & Klinteback, Fredrik. 2011. The Heureka Forestry Decision Support System: An Overview. Mathematical and Computational Forestry and Natural-Resource Sciences. 3. pp. 87-95. [ Links ]
[19] Von Gadow, K. & Bredenkamp, B. 1992. Forest management. Pretoria: Academica. [ Links ]
[20] Kotze, H., Kassier, H.W., Fletcher, Y. & Morley, T. 2012. Growth modelling and yield tables. In B. Bredenkamp & S.J. Upfold (eds), South African forestry handbook, 5th ed. Stellenbosch: Southern African Institute of Forestry, pp. 175-209. [ Links ]
[21] Bekker, J. & Yoon, M. 2017. Single- and multi-objective ranking and selection procedures in simulation: A historical review. The South African Journal of Industrial Engineering, 28(2), pp. 37-45. doi:https://doi.org/10.7166/28-2-1732 [ Links ]
Submitted by authors 07 Apr 2022
Accepted for publication 26 Sep 2022
Available online 14 Dec 2022
* Corresponding author jb2@sun.ac.za
ORCID® identifiers
J.M. Laubscher: 0000-0001-6705-2938
J. Bekker: 0000-0001-6802-0129
S. Ackerman: 0000-0002-3993-798X

